パロベルサイクルとボリンジャーバンドを組み合わせた移動ストップロス戦略
概要
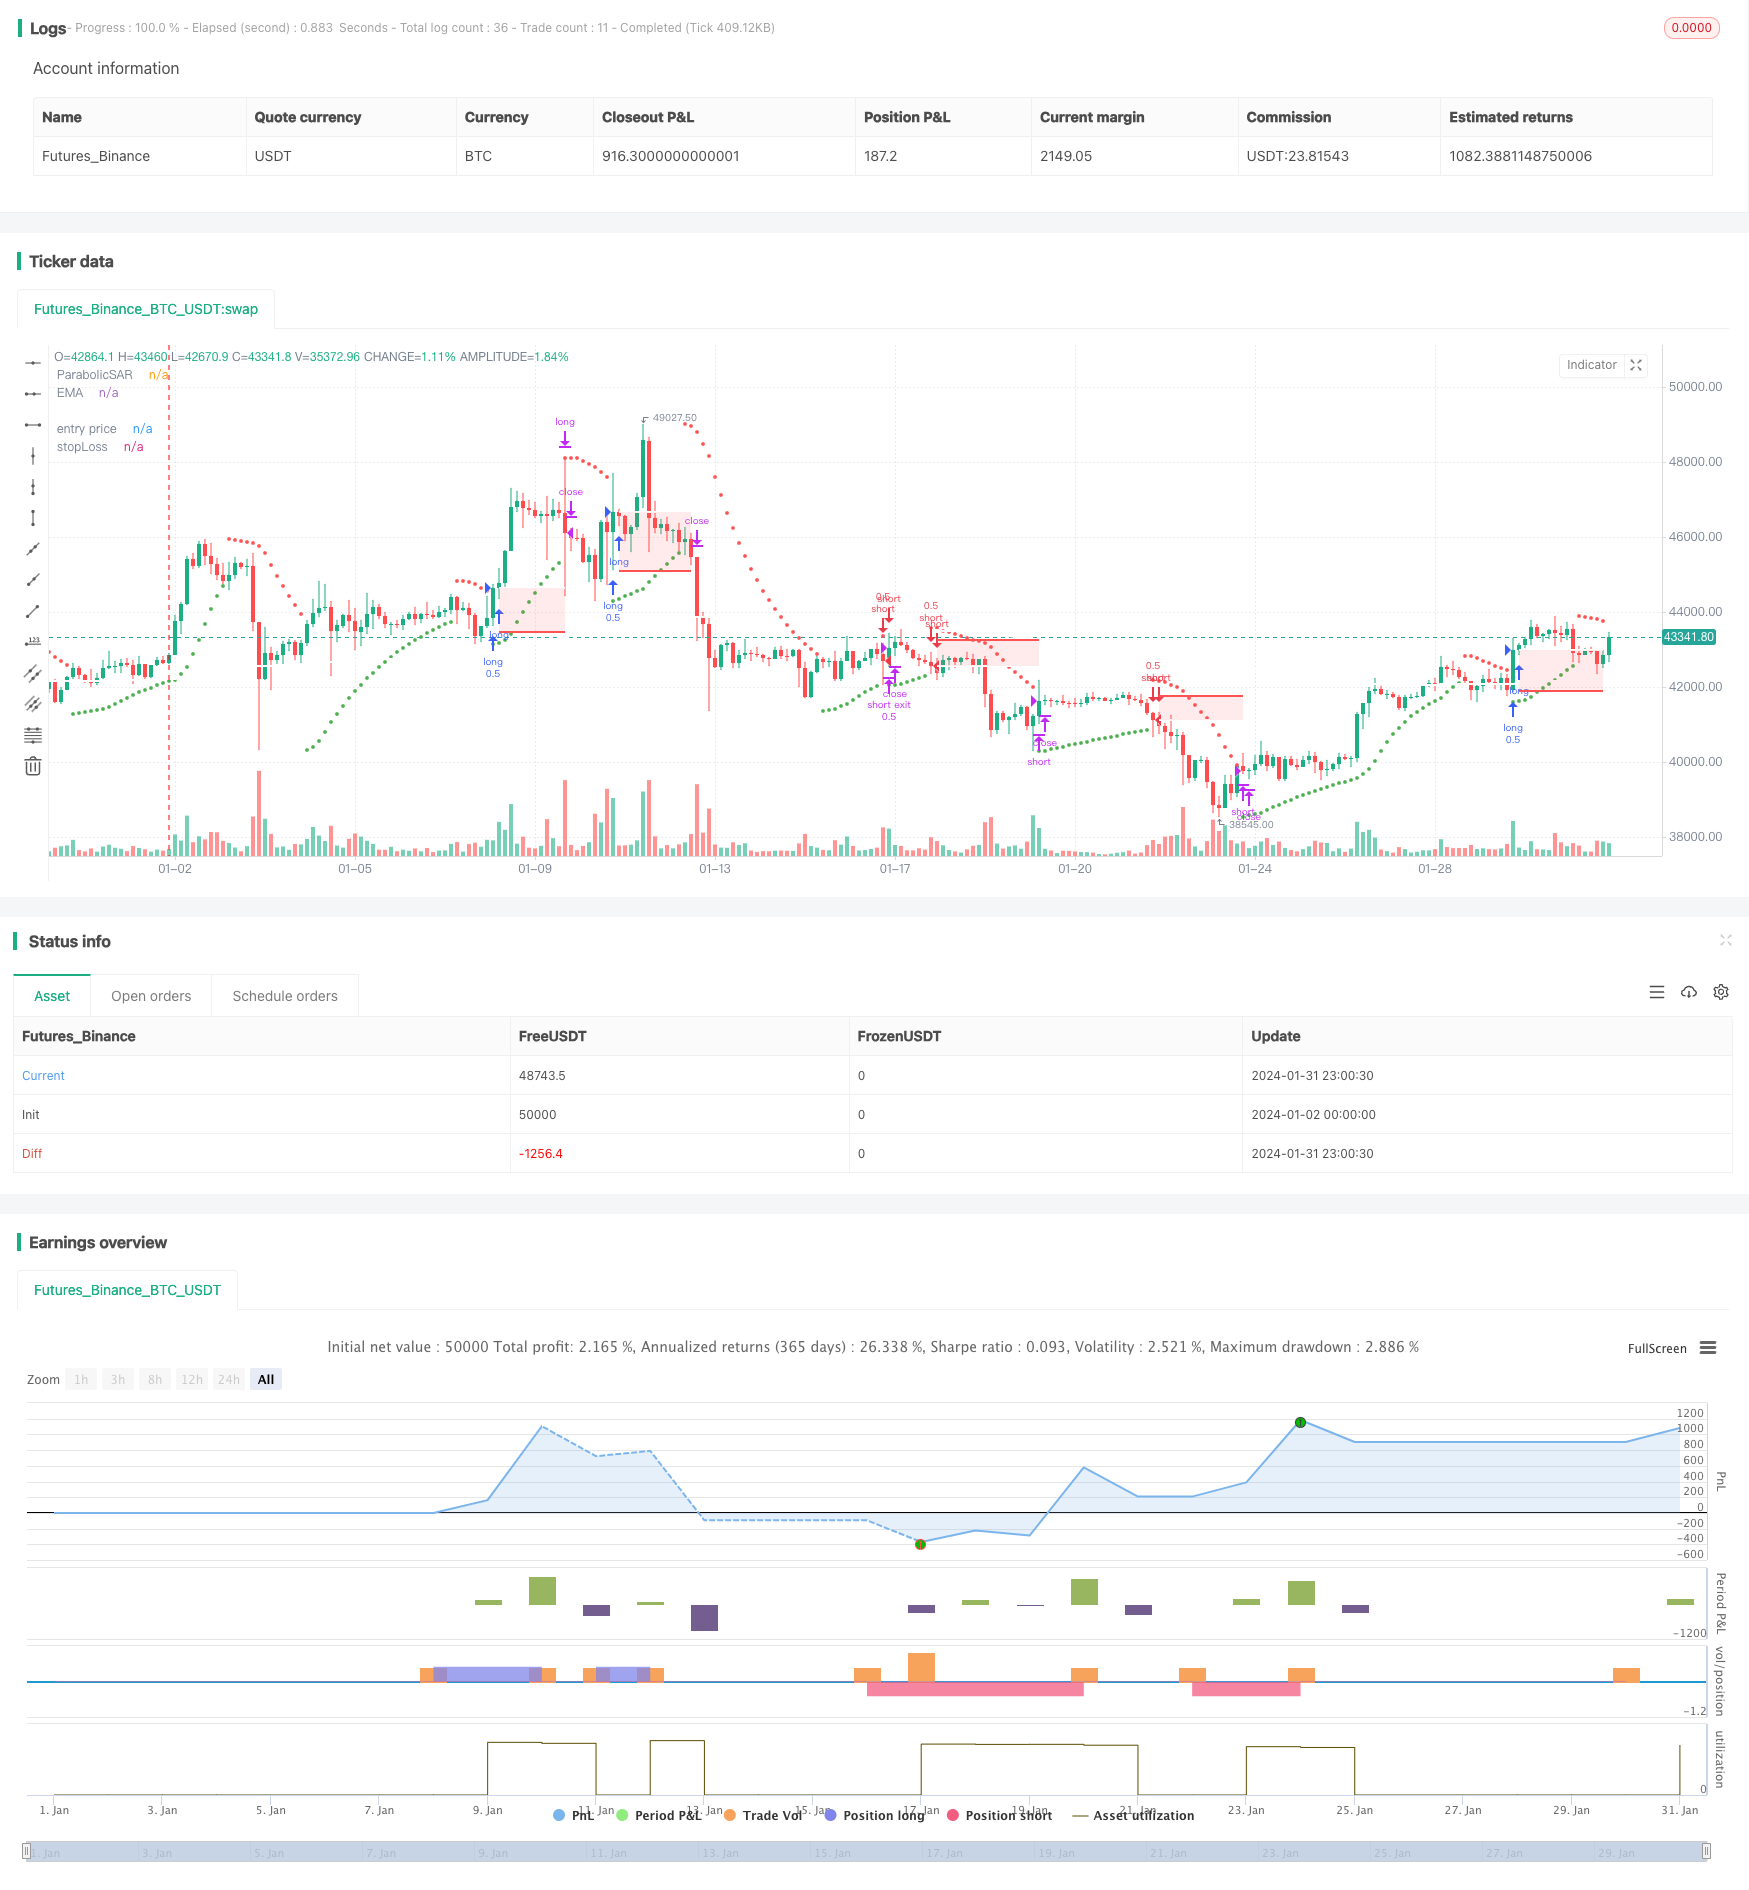
この記事では,パラベルの周期指数とブリン帯の指標を組み合わせて,移動ストップ戦略を設定する量的な取引戦略を紹介する.この戦略は,市場トレンドの方向性を判断するためにパラベルの周期線を計算し,ブリン帯の上軌道と下軌道動態を利用して,移動ストップを設定し,利益をロックする.
戦略原則
まず,この戦略はパロベル指数を使用して,現在の市場動向を判断する.今日の閉盘価格が昨日のパロベル周期線を横切ったとき,市場が反転して悲観的だと考えれば,多めにすることができます.今日の閉盘価格が昨日の周期線を横切ったとき,市場が下落して,空いてください.
第二に,この戦略はブリン帯の指標を組み合わせて動的な止損点を設定する.ブリン帯の上線は,超買区,下線は超売区と見なすことができる.高値の後に,価格がブリン帯の下線を再び破れば,平仓を停止する.空値の後に,価格が上線を再び破れば,出場を停止する.このように,ブリン帯の上下線は,移動する止損線となる.
上述の原理により,この戦略は市場の方向を判断すると同時に,利潤を追跡するダイナミックなストップ・ロスの仕組みを設定する.これは,大きなトレンドの中で部分的な上昇・下降を捉えることができ,同時に,利潤をロックしてリスクを回避するためにストップ・ロスを使用することもできる.
戦略的優位性
伝統的なストップ・ストラテジーは,固定したストップ・ポイントのみを設定する.このストラテジーは,ブリン・バンド指数をストップ・ラインとして使用し,ストップ・ラインは価格の変動に合わせて移動させることができる.これは,比較的に大きな状況でより多くの利益をロックできるようにする.また,単一のパロベル周期ラインを使用するよりも,このストラテジーは,ブリン・バンド指数を追加し,超買い超売り領域を判断し,より正確に行うことができる.
リスクと解決
この戦略の主なリスクは,パラベル指標の判断が強い傾向性がないことにある.変動の状況では,価格がパラベル周期線を何度も上下して,戦略が頻繁な,しかし微利な取引を生む可能性がある.このとき,取引費用と滑点コストは,戦略の収益性を低下させ,取引費用と滑点コストの大きな割合を占める可能性がある.
上記のリスクに対応するために,パラメータを調整し,パラベルの周期線の変化を拡大し,誤判の確率を減らすことを考えることができます.または,他の指標と組み合わせて,入場タイミングをフィルタリングすることができます.例えば,不況指標などの判断は,不必要な取引を減らすために傾向的であるか不況であるかを判断することができます.
戦略の最適化
この戦略は以下の点で最適化できます.
パロベル指標のパラメータを最適化し,パラメータ指標の変化速度を調整し,誤判の可能性を低減する.
MACD,KDなどの判断方法の追加など,他の技術指標のフィルタを追加し,波動市場での利を避ける
ブリン帯のパラメータを最適化し,ブリン帯のパラメータを価格変化に近付くように調整する
取引量,保有量などの量能指標を増加させ,偽突破を避けるための補助判断
戦略的保有株の業績に影響を及ぼす問題を回避するために,株式基本情報と組み合わせる
要約する
この戦略は,パロベル指標を使用して市場のトレンドの方向と強さを判断し,ブリン帯を移動停止位として軌道上下して停止戦略を設定し,トレンド追跡とリスク管理の組み合わせを実現します.従来の固定ストップ戦略と比較して,この戦略は,より大きな状況でより高い収益を得ることができます.パラメータの最適化と他の補助判断指標の追加により,戦略の安定性をさらに強化し,不要な取引を減らすことができます.
/*backtest
start: 2024-01-02 00:00:00
end: 2024-02-01 00:00:00
period: 3h
basePeriod: 15m
exchanges: [{"eid":"Futures_Binance","currency":"BTC_USDT"}]
*/

// This source code is subject to the terms of the Mozilla Public License 2.0 at https://mozilla.org/MPL/2.0/
// © maxencetajet

//@version=5
strategy("HA_RSI", overlay=true, initial_capital=1000, default_qty_type=strategy.fixed, default_qty_value=0.5, slippage=25)

closeHA = request.security(ticker.heikinashi(syminfo.tickerid), timeframe.period, close)

useDateFilter = input.bool(true, title="Filter Date Range of Backtest",
     group="Backtest Time Period")
backtestStartDate = input(timestamp("5 June 2022"),
     title="Start Date", group="Backtest Time Period",
     tooltip="This start date is in the time zone of the exchange " +
     "where the chart's instrument trades. It doesn't use the time " +
     "zone of the chart or of your computer.")
backtestEndDate = input(timestamp("5 July 2022"),
     title="End Date", group="Backtest Time Period",
     tooltip="This end date is in the time zone of the exchange " +
     "where the chart's instrument trades. It doesn't use the time " +
     "zone of the chart or of your computer.")

inTradeWindow = true

swingHighV = input.int(10, title="Swing High", group="number of past candles")
swingLowV = input.int(10, title="Swing Low", group="number of past candles")

emaV = input.int(200, title="Ema Period", group="EMA")

rsiV = input.int(14, title="RSI Period", group="RSI")

start = input(0.02, group="Parabolic SAR")
increment = input(0.02, group="Parabolic SAR")
maximum = input(0.2, "Max Value", group="Parabolic SAR")

ema = ta.ema(closeHA, emaV)
rsi = ta.rsi(closeHA, rsiV)
SAR = ta.sar(start, increment, maximum)

myColor = SAR < low?color.green:color.red

longcondition = closeHA > ema and rsi > 50 and closeHA[1] > SAR and closeHA[1] < SAR[1]
shortcondition = closeHA < ema and rsi < 50 and closeHA[1] < SAR and closeHA[1] > SAR[1]

float risk_long = na
float risk_short = na
float stopLoss = na
float entry_price = na
float takeProfit = na

risk_long := risk_long[1]
risk_short := risk_short[1]

swingHigh = ta.highest(closeHA, swingHighV)
swingLow = ta.lowest(closeHA, swingLowV)

if strategy.position_size == 0 and longcondition and inTradeWindow
    risk_long := (close - swingLow) / close
    strategy.entry("long", strategy.long, comment="Buy")

if strategy.position_size == 0 and shortcondition and inTradeWindow
    risk_short := (swingHigh - close) / close
    strategy.entry("short", strategy.short, comment="Sell")

if strategy.position_size > 0

    stopLoss := strategy.position_avg_price * (1 - risk_long)
    entry_price := strategy.position_avg_price
    strategy.exit("long exit", "long", stop = stopLoss)

if strategy.position_size < 0

    stopLoss := strategy.position_avg_price * (1 + risk_short)
    entry_price := strategy.position_avg_price
    strategy.exit("short exit", "short", stop = stopLoss)

if closeHA[1] < SAR and close > strategy.position_avg_price
    strategy.close("long", comment="Exit Long")

if closeHA[1] > SAR and close < strategy.position_avg_price
    strategy.close("short", comment="Exit Short")

p_ep = plot(entry_price, color=color.new(color.white, 0), linewidth=2, style=plot.style_linebr, title='entry price')
p_sl = plot(stopLoss, color=color.new(color.red, 0), linewidth=2, style=plot.style_linebr, title='stopLoss')
fill(p_sl, p_ep, color.new(color.red, transp=85))

plot(SAR, "ParabolicSAR", style=plot.style_circles, color=myColor, linewidth=1)
plot(ema, color=color.white, linewidth=2, title="EMA")