トリプルオーバーラップスーパートレンド戦略
作成日:
2024-02-26 10:04:18
最終変更日:
2024-02-26 10:04:18
コピー:
3
クリック数:
816
1
フォロー
1751
フォロワー
概要
これは,超トレンドの指標を3つ重複して取引決定を行う戦略である. これは,トレンドの状況の中でより大きな方向性の機会を捉えることができる.
戦略原則
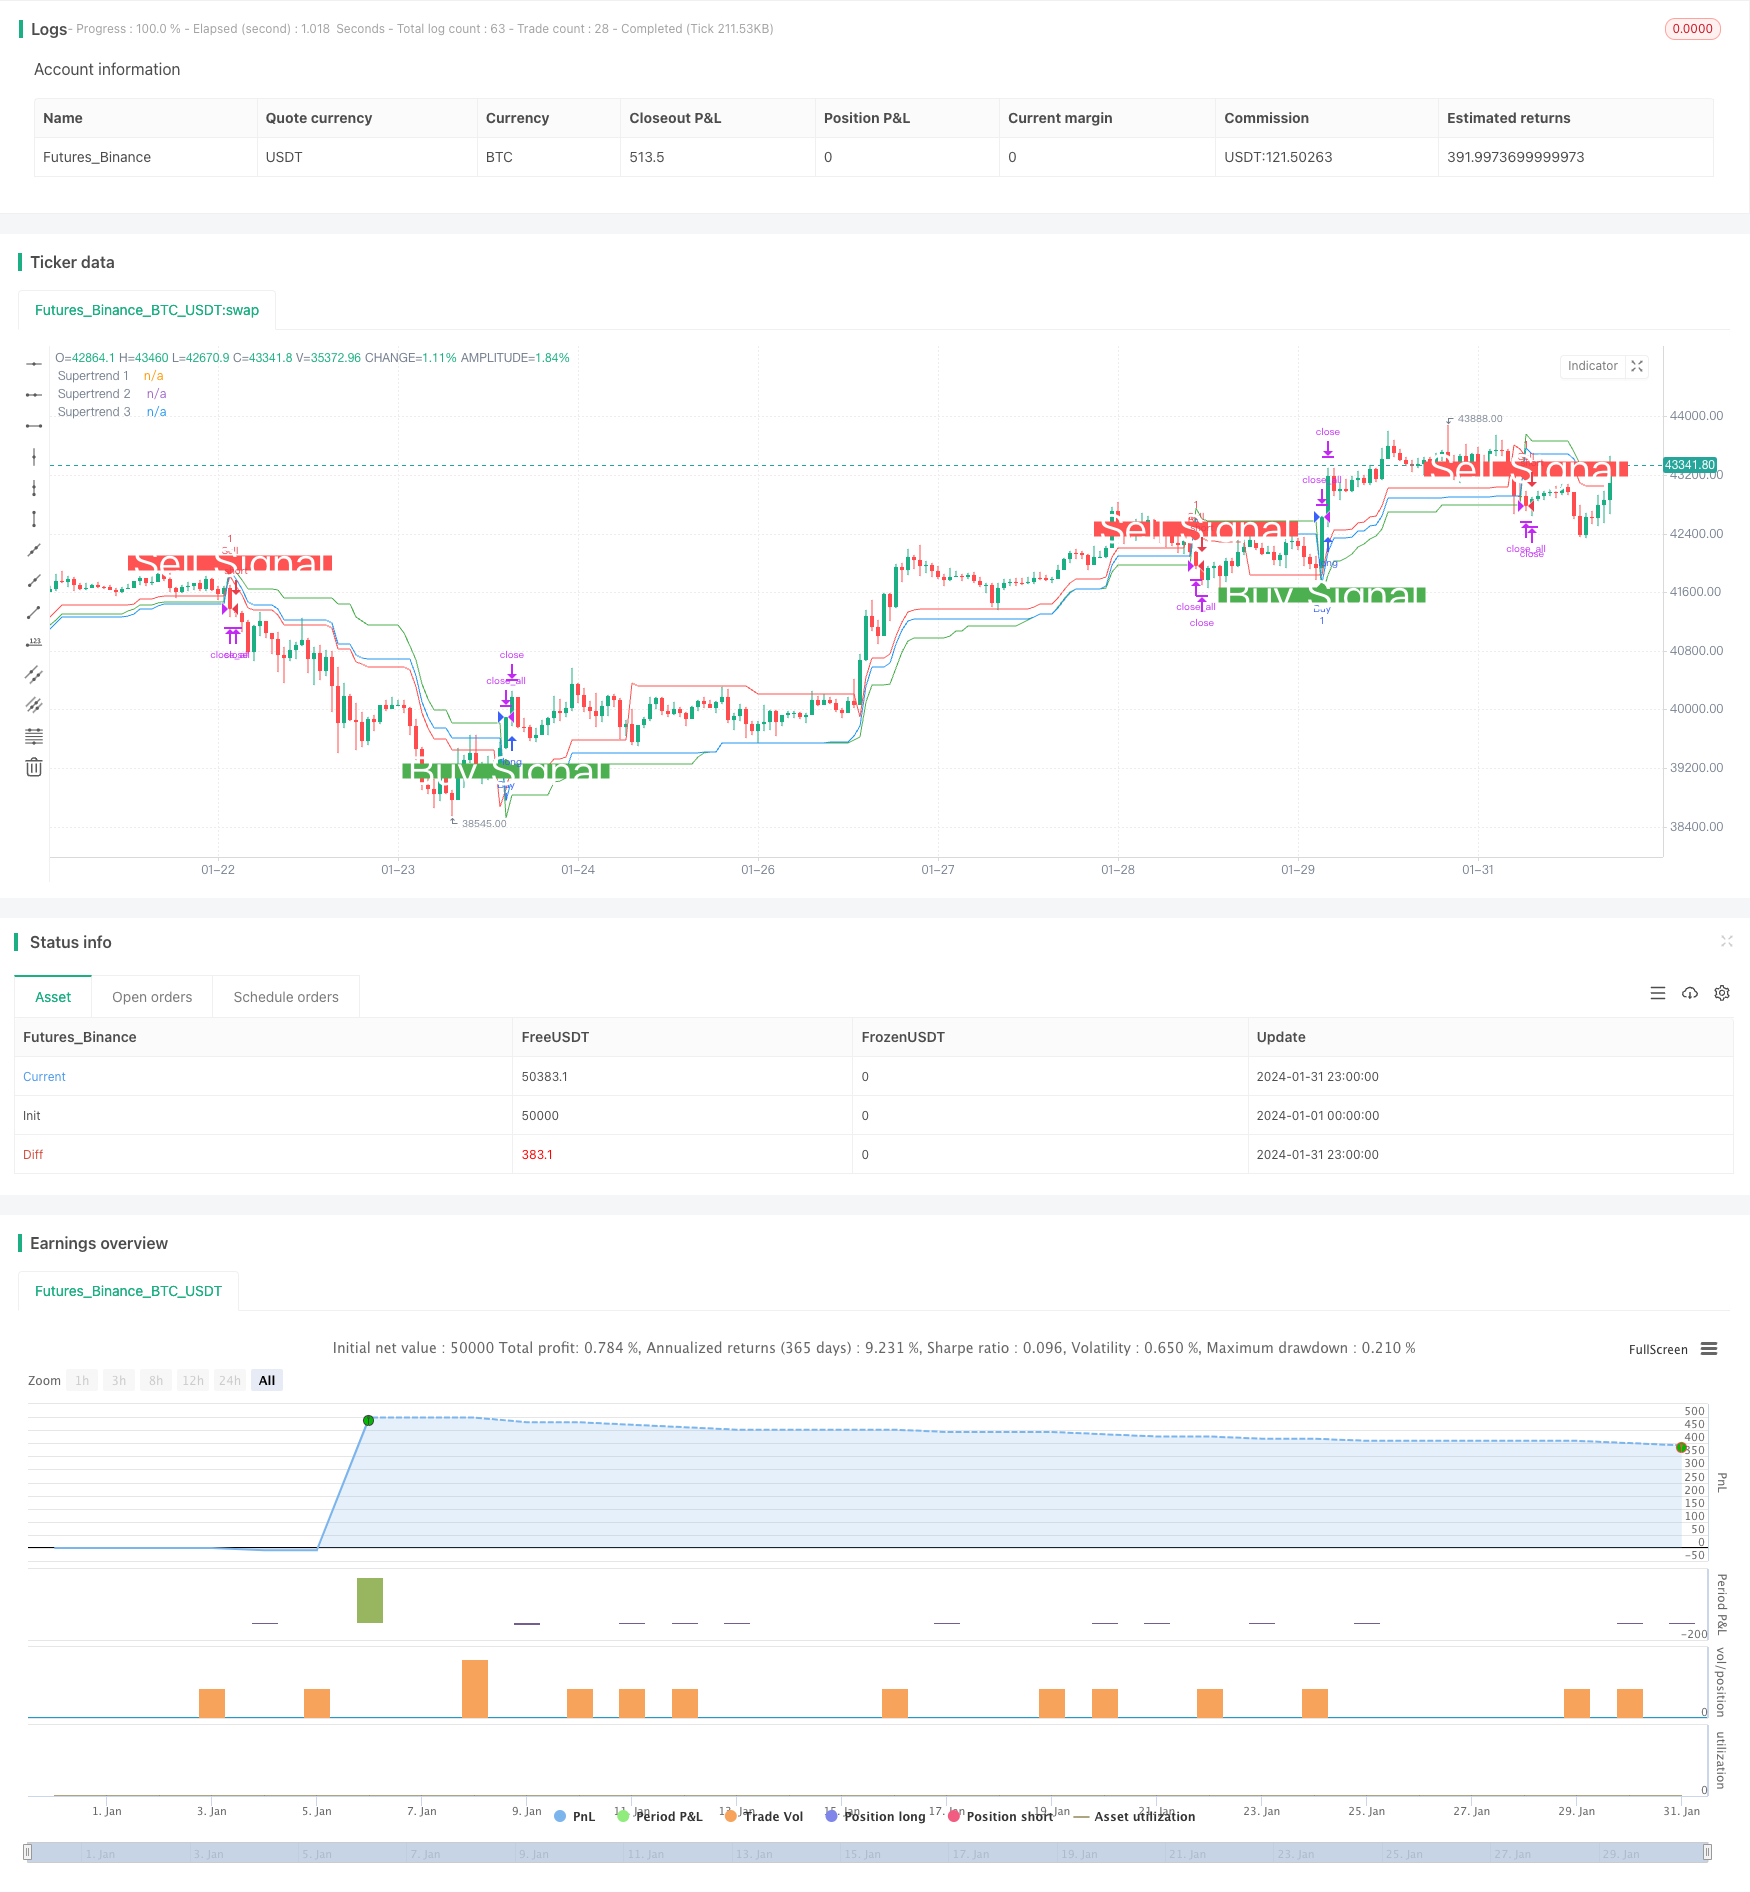
この策略は,ta.supertrend() 関数を使用して,3つの異なるパラメータセットの超トレンド指標を計算する. 10日3倍ATRの超トレンド1,14日2倍ATRの超トレンド2,および20日2.5倍ATRの超トレンド3を計算する. 価格が上から3つの超トレンドを突破すると買取信号を生成する. 価格が下から3つの超トレンドを突破すると売り信号を生成する.
超トレンド指数はATR指数と組み合わせて,価格変化のトレンドを効果的に追跡できます.超トレンドの3重叠の戦略は,シグナルをより信頼性のあるものにして,トレンドの状況でより大きな利益を得ることができます.
戦略的優位性
- 三重フィルタリング機構,偽信号を回避し,信号の質を向上させる
- 超トレンド指標は,それ自体で良い消音機能を持っています.
- 複数の超パラメータの組み合わせを配置し,より広範な市場環境に対応
- リスクと利益の比較で過去テストは順調だった
戦略リスク
- マルチフィルタリング信号は,いくつかの機会を逃している可能性があります.
- 震災の際の表情は悪かった.
- 3組の超パラメータの組み合わせを最適化する
- 集中取引の時間帯は突発的な出来事の影響を受けやすい.
リスクを下げるには,以下のようなことを考えてください.
- フィルタリング条件を調整し,超トレンド1つまたは2つを保持します.
- ストップ・ロスの策略を増やす
- 超パラメータを最適化して勝利率を上げる
戦略最適化の方向性
- より多くのパラメータの組み合わせをテストし,最適の超パラメータを探します.
- 機械学習アルゴリズムを追加し,リアルタイムでパラメータを最適化します.
- 単一損失を抑えるためのストップ・ロース戦略を強化する
- 他の指標と組み合わせて,トレンドと揺れを識別します.
- 取引時間を拡張し,単一の時間ノードのリスクを回避する
要約する
この戦略は,超トレンドの3重叠によって意思決定を行い,トレンドの方向を効果的に識別することができる. それは,信号の質が高く,パラメータが最適化されるなどの利点を持っている. 同時に,異なる市場環境に対応するためにパラメータと退出タイミングを調整する必要のある一定のリスクもあります. 全体的に,この戦略は,優れたパフォーマンスを発揮し,さらなる研究と適用に値する.
ストラテジーソースコード
/*backtest
start: 2024-01-01 00:00:00
end: 2024-01-31 23:59:59
period: 1h
basePeriod: 15m
exchanges: [{"eid":"Futures_Binance","currency":"BTC_USDT"}]
*/

//@version=5
strategy('Combined Supertrend Strategy - Ajit Prasad', overlay=true)

// Function to calculate Supertrend
supertrendFunc(atrLength, factor) =>
    [supertrend, direction] = ta.supertrend(factor, atrLength)
    [supertrend, direction]

// Input parameters for the first Supertrend
atrPeriod1 = input(10, 'ATR Length 1')
factor1 = input(3, 'Factor 1')

// Calculate the first Supertrend
[supertrend1, direction1] = supertrendFunc(atrPeriod1, factor1)

// Input parameters for the second Supertrend
atrPeriod2 = input(14, 'ATR Length 2') // Change values as needed
factor2 = input(2, 'Factor 2') // Change values as needed

// Calculate the second Supertrend
[supertrend2, direction2] = supertrendFunc(atrPeriod2, factor2)

// Input parameters for the third Supertrend
atrPeriod3 = input(20, 'ATR Length 3') // Change values as needed
factor3 = input(2.5, 'Factor 3') // Change values as needed

// Calculate the third Supertrend
[supertrend3, direction3] = supertrendFunc(atrPeriod3, factor3)

// Define market opening and closing times
marketOpenHour = 9
marketOpenMinute = 15
marketCloseHour = 15
marketCloseMinute = 30
exitTimeHour = 15
exitTimeMinute = 10

// Fetch historical close values using security function
histClose = request.security(syminfo.tickerid, "D", close)

// Buy condition
buyCondition = close > supertrend1 and close > supertrend2 and close > supertrend3 and close[1] <= supertrend1[1]

// Sell condition
sellCondition = close < supertrend1 and close < supertrend2 and close < supertrend3 and close[1] >= supertrend1[1]

// Exit conditions
buyExitCondition = close < supertrend1[1] or close < supertrend2[1] or close < supertrend3[1]
sellExitCondition = close > supertrend1[1] or close > supertrend2[1] or close > supertrend3[1]

// Execute orders with market timing
if true
    // Buy condition without 'and not'
    strategy.entry('Buy', strategy.long, when = buyCondition)

    // Sell condition without 'and not'
    strategy.entry('Sell', strategy.short, when = sellCondition)

    // Close conditions
    strategy.close('Buy', when = buyExitCondition )
    strategy.close('Sell', when = sellExitCondition)

// Close all trades at 3:10 pm IST
if true
    strategy.close_all()

// Plot Supertrends
plot(supertrend1, 'Supertrend 1', color=color.new(color.green, 0), style=plot.style_linebr)
plot(supertrend2, 'Supertrend 2', color=color.new(color.red, 0), style=plot.style_linebr)
plot(supertrend3, 'Supertrend 3', color=color.new(color.blue, 0), style=plot.style_linebr)

// Plot labels
plotshape(buyCondition, style=shape.labelup, location=location.belowbar, color=color.new(color.green, 0), size=size.large, text='Buy Signal', textcolor=color.new(color.white, 0))
plotshape(sellCondition, style=shape.labeldown, location=location.abovebar, color=color.new(color.red, 0), size=size.large, text='Sell Signal', textcolor=color.new(color.white, 0))