スーパーサポートとレジスタンストレンドフォロー戦略
概要
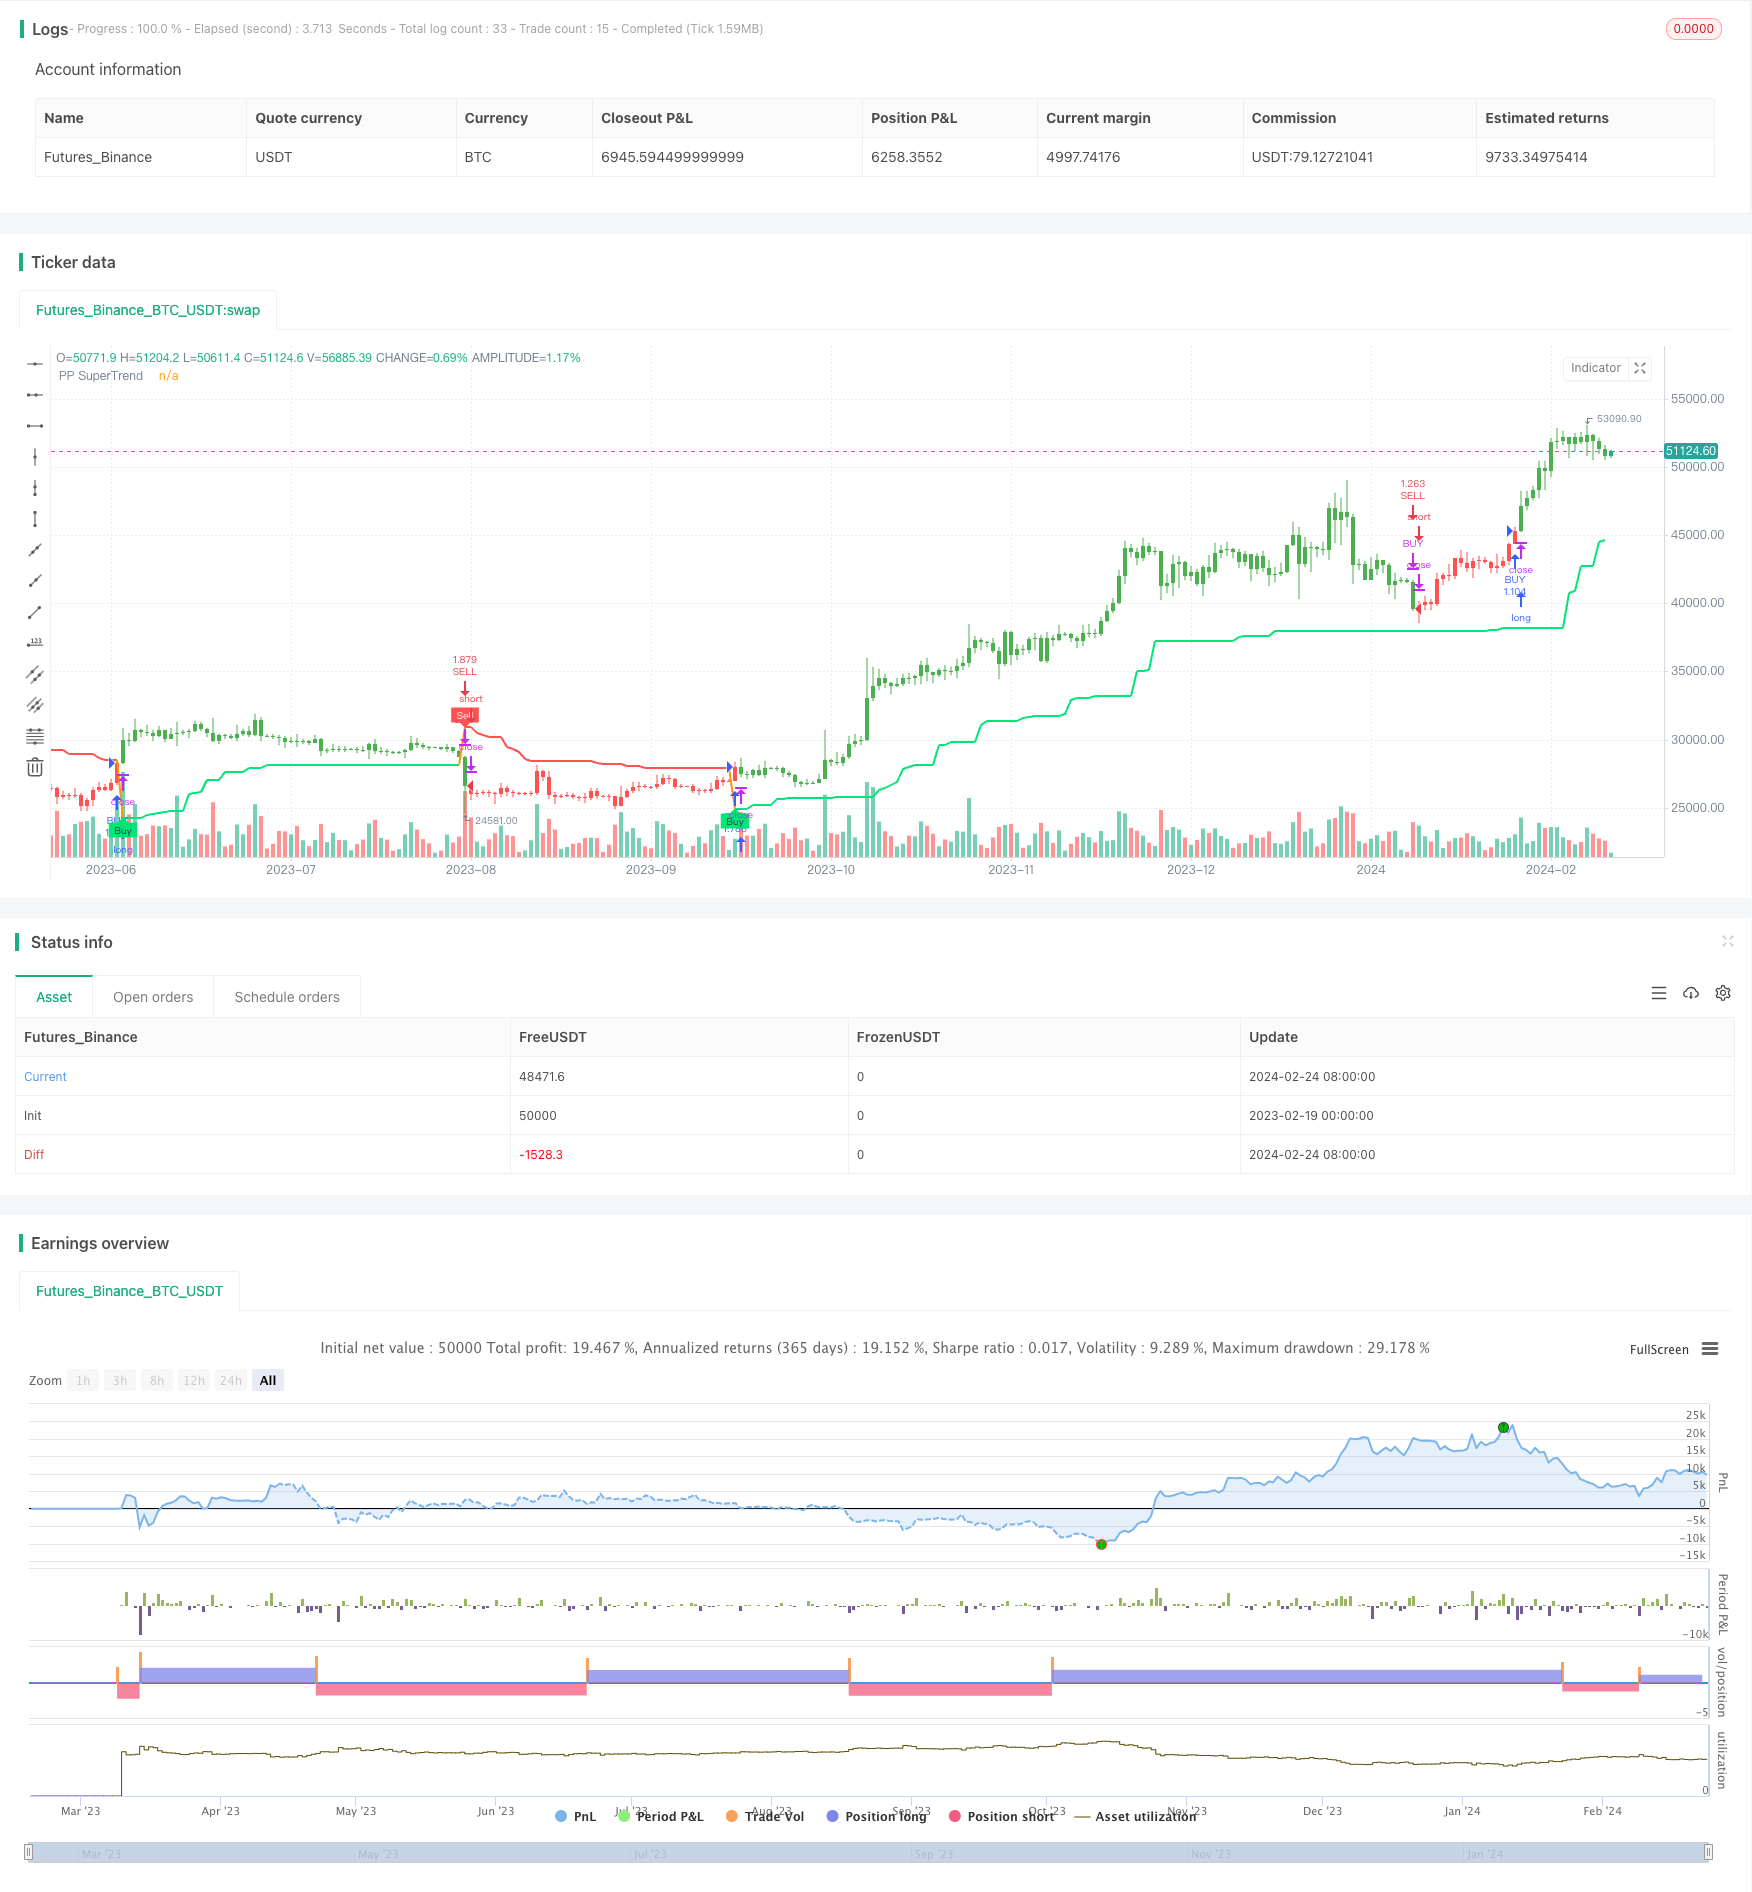
スーパーレジスタンストレンドフォロー戦略は,サポートレジスタンスとスーパートレンドの2つの一般的な指標を融合させ,精度を高めるために追加のトレンドフィルターを追加した革新的なトレンドフォロー戦略です.この戦略は,Lonesome TheBlueのサポートレジスタンススーパートレンドフォロースクリプトにインスピレーションを得て,トレーダーに信頼できるトレンドフォローツールを提供し,偽信号を最大限に減らすことを目指しています.
戦略原則
この戦略の基礎は,サポート・レジスタンスポイントとスーパートレンド指標の融合と,強力なトレンドフィルターの追加である.それは,まず,指定された周期でサポート・ハイとローを計算し,トレンド分析に不可欠な重要な基準点である.重量平均を計算し,これらのサポート・レジスタンスポイントを中央線に形成し,全体の指標をさらに完善する.
次に,中線とユーザが定義したATR因子に基づいて上下が生成されます. これらの波段は市場の変動に応じて自己調整し,戦略に柔軟性を与えます. サポートする抵抗点のスーパートレンド戦略の核心は,価格とスーパートレンド波段の相互作用で,多頭と空頭シグナル間で滑らかに変換する指数の支配的なトレンドを正確に識別することです.
策略の導入により,追加のトレンドフィルターがさらにその能力を強化した. このフィルターは移動平均に基づいており,動的にトレンドの強さと方向を評価する. このトレンドフィルターと原始のサポート・レジスタンス・ポイントのスーパートレンド信号を組み合わせることで,戦略はより賢明で信頼性の高い取引決定を行うことを目的としています.
優位分析
精度向上: トレンドフィルターの追加により,シグナルの生成前に全体的なトレンドの方向を確認することにより,戦略の精度が向上する.
トレンド継続: 抵抗点とスーパートレンドを支えるトレンドフィルターの統合,強力な市場トレンドの間,取引を延長し,潜在的に利益を上げる機会を最大化することを目的としています.
偽信号の減少:戦略の重み平均計算とトレンドフィルターの加算は,偽信号を最小限に抑え,不確実性や市場状況の整合の空飛ぶのを減らすのに役立ちます.
サポート/レジスタンスインサイト: この戦略は,サポート/レジスタンスポイントに応じて,追加のサポートとレジスタンスポイントを提供し続け,トレーダーに貴重な文脈情報を提供します.
リスク分析
パラメータ依存:この戦略はATR周期とATR倍数のパラメータに敏感であり,不適切なパラメータ設定により,余剰取引または見逃した好機が発生する可能性があります.
トレンド反転: トレンド反転点の近くでは,戦略は誤信号を生じ,不必要な損失を引き起こす可能性があります. リスク管理は,ストップ・ロスの併用で行うべきです.
過度に最適化:パラメータは最適化によって最適の組み合わせを得ることができるが,先見性はない.状況と品種の違いがパラメータ選択に与える影響を考慮すべきである.
空置リスク:価格が上下軌道から外れたときに,戦略は空置状態に入ります.これは,トレンドが再び形成された後のチャンスを逃す可能性があります.
最適化の方向
他の指標と組み合わせる:取引量や変動率の指標など,戦略の安定性を高めるために考慮することができる.
ダイナミックパラメータ: 戦略をより適応的にするために,パラメータを自動的に最適化したり,市場環境に応じて調整する方法を研究することができます.
ストップ・損失戦略:戦略の論理を維持する前提で,単一損失を効果的に制御するストップ・損失機構を設計する方法の研究.
品種適合性:評価策略 パラメータを異なる部品や楽器で,特定の品種に応じてパラメータを最適化する.
要約する
スーパーサポートレジスタンストレンド追跡戦略は,非常に有望な量化戦略である.それは簡潔さ,トレンド追跡能力などの複数の次元で独特の優位性を示している.同時に,戦略は,パラメータ,ストップ,品種適合性などの多くの側面で最適化できる改善の余地があり,より一般的で信頼できる量化ツールにすることができます.全体的に,この戦略は,市場トレンドを効果的に捉えるための強力なツールを提供します.
/*backtest
start: 2023-02-19 00:00:00
end: 2024-02-25 00:00:00
period: 1d
basePeriod: 1h
exchanges: [{"eid":"Futures_Binance","currency":"BTC_USDT"}]
*/

// © Julien_Eche
// Strategy based on "Pivot Point Supertrend" Indicator by LonesomeTheBlue

//@version=4

strategy("PPS", overlay=true, initial_capital=500000, currency=currency.USD, default_qty_type=strategy.cash, default_qty_value=50000)

prd = input(defval = 2, title="Pivot Point Period", minval = 1, maxval = 50)
Factor=input(defval = 3, title = "ATR Factor", minval = 1, step = 0.1)
Pd=input(defval = 10, title = "ATR Period", minval=1)
showpivot = input(defval = false, title="Show Pivot Points")
showlabel = input(defval = true, title="Show Buy/Sell Labels")
showcl = input(defval = false, title="Show PP Center Line")
showsr = input(defval = false, title="Show Support/Resistance")

// get Pivot High/Low
float ph = pivothigh(prd, prd)
float pl = pivotlow(prd, prd)

// drawl Pivot Points if "showpivot" is enabled
plotshape(ph and showpivot, text="H",  style=shape.labeldown, color=na, textcolor=color.red, location=location.abovebar, transp=0, offset = -prd)
plotshape(pl and showpivot, text="L",  style=shape.labeldown, color=na, textcolor=color.lime, location=location.belowbar, transp=0, offset = -prd)

// calculate the Center line using pivot points
var float center = na
float lastpp = ph ? ph : pl ? pl : na
if lastpp
    if na(center)
        center := lastpp
    else
        //weighted calculation
        center := (center * 2 + lastpp) / 3

// upper/lower bands calculation
Up = center - (Factor * atr(Pd))
Dn = center + (Factor * atr(Pd))

// get the trend
float TUp = na
float TDown = na
Trend = 0
TUp := close[1] > TUp[1] ? max(Up, TUp[1]) : Up
TDown := close[1] < TDown[1] ? min(Dn, TDown[1]) : Dn
Trend := close > TDown[1] ? 1: close < TUp[1]? -1: nz(Trend[1], 1)
Trailingsl = Trend == 1 ? TUp : TDown

// plot the trend
linecolor = Trend == 1 and nz(Trend[1]) == 1 ? color.lime : Trend == -1 and nz(Trend[1]) == -1 ? color.red : na
plot(Trailingsl, color = linecolor ,  linewidth = 2, title = "PP SuperTrend")

plot(showcl ? center : na, color = showcl ? center < hl2 ? color.blue : color.red : na)

// check and plot the signals
bsignal = Trend == 1 and Trend[1] == -1
ssignal = Trend == -1 and Trend[1] == 1
plotshape(bsignal and showlabel ? Trailingsl : na, title="Buy", text="Buy", location = location.absolute, style = shape.labelup, size = size.tiny, color = color.lime, textcolor = color.black, transp = 0)
plotshape(ssignal and showlabel ? Trailingsl : na, title="Sell", text="Sell", location = location.absolute, style = shape.labeldown, size = size.tiny, color = color.red, textcolor = color.white, transp = 0)

//get S/R levels using Pivot Points
float resistance = na
float support = na
support := pl ? pl : support[1]
resistance := ph ? ph : resistance[1]

// if enabled then show S/R levels
plot(showsr and support ? support : na, color = showsr and support ? color.lime : na, style = plot.style_circles, offset = -prd)
plot(showsr and resistance ? resistance : na, color = showsr and resistance ? color.red : na, style = plot.style_circles, offset = -prd)

// Trend Filter from SuperTrend Long Strategy
Periods = input(title="ATR Period", type=input.integer, defval=10)
src = input(hl2, title="Source")
Multiplier = input(title="ATR Multiplier", type=input.float, step=0.1, defval=3.0)
changeATR = input(title="Change ATR Calculation Method ?", type=input.bool, defval=true)

// Combine the SuperTrend calculations
atr2 = sma(tr, Periods)
atr = changeATR ? atr(Periods) : atr2

up = src - (Multiplier * atr)
up1 = nz(up[1], up)
up := close[1] > up1 ? max(up, up1) : up

dn = src + (Multiplier * atr)
dn1 = nz(dn[1], dn)
dn := close[1] < dn1 ? min(dn, dn1) : dn

trend = 1
trend := nz(trend[1], trend)
trend := trend == -1 and close > dn1 ? 1 : trend == 1 and close < up1 ? -1 : trend

// Moving Average as Trend Filter
periodes_ma = input(title="Moving Average Period", type=input.integer, defval=20)
src_ma = input(title="Moving Average Source", type=input.source, defval=close)
ma = sma(src_ma, periodes_ma)

// Strategy Entry Conditions
FromMonth = input(defval = 9, title = "From Month", minval = 1, maxval = 12)
FromDay   = input(defval = 1, title = "From Day", minval = 1, maxval = 31)
FromYear  = input(defval = 2018, title = "From Year", minval = 999)
ToMonth   = input(defval = 1, title = "To Month", minval = 1, maxval = 12)
ToDay     = input(defval = 1, title = "To Day", minval = 1, maxval = 31)
ToYear    = input(defval = 9999, title = "To Year", minval = 999)

start     = timestamp(FromYear, FromMonth, FromDay, 00, 00)
finish    = timestamp(ToYear, ToMonth, ToDay, 23, 59)

window()  => time >= start and time <= finish ? true : false

// Combined entry conditions
longCondition = (trend == 1 and trend[1] == -1 and close > ma) or (bsignal and window())
shortCondition = (trend == -1 and trend[1] == 1 and close < ma) or (ssignal and window())

if (longCondition)
    strategy.entry("BUY", strategy.long)

if (shortCondition)
    strategy.close("BUY")
    strategy.entry("SELL", strategy.short)

buy1 = barssince((trend == 1 and trend[1] == -1 and close > ma) or (bsignal and window()))
sell1 = barssince((trend == -1 and trend[1] == 1 and close < ma) or (ssignal and window()))
color1 = buy1[1] < sell1[1] ? color.green : buy1[1] > sell1[1] ? color.red : na
barcolor(color1)