
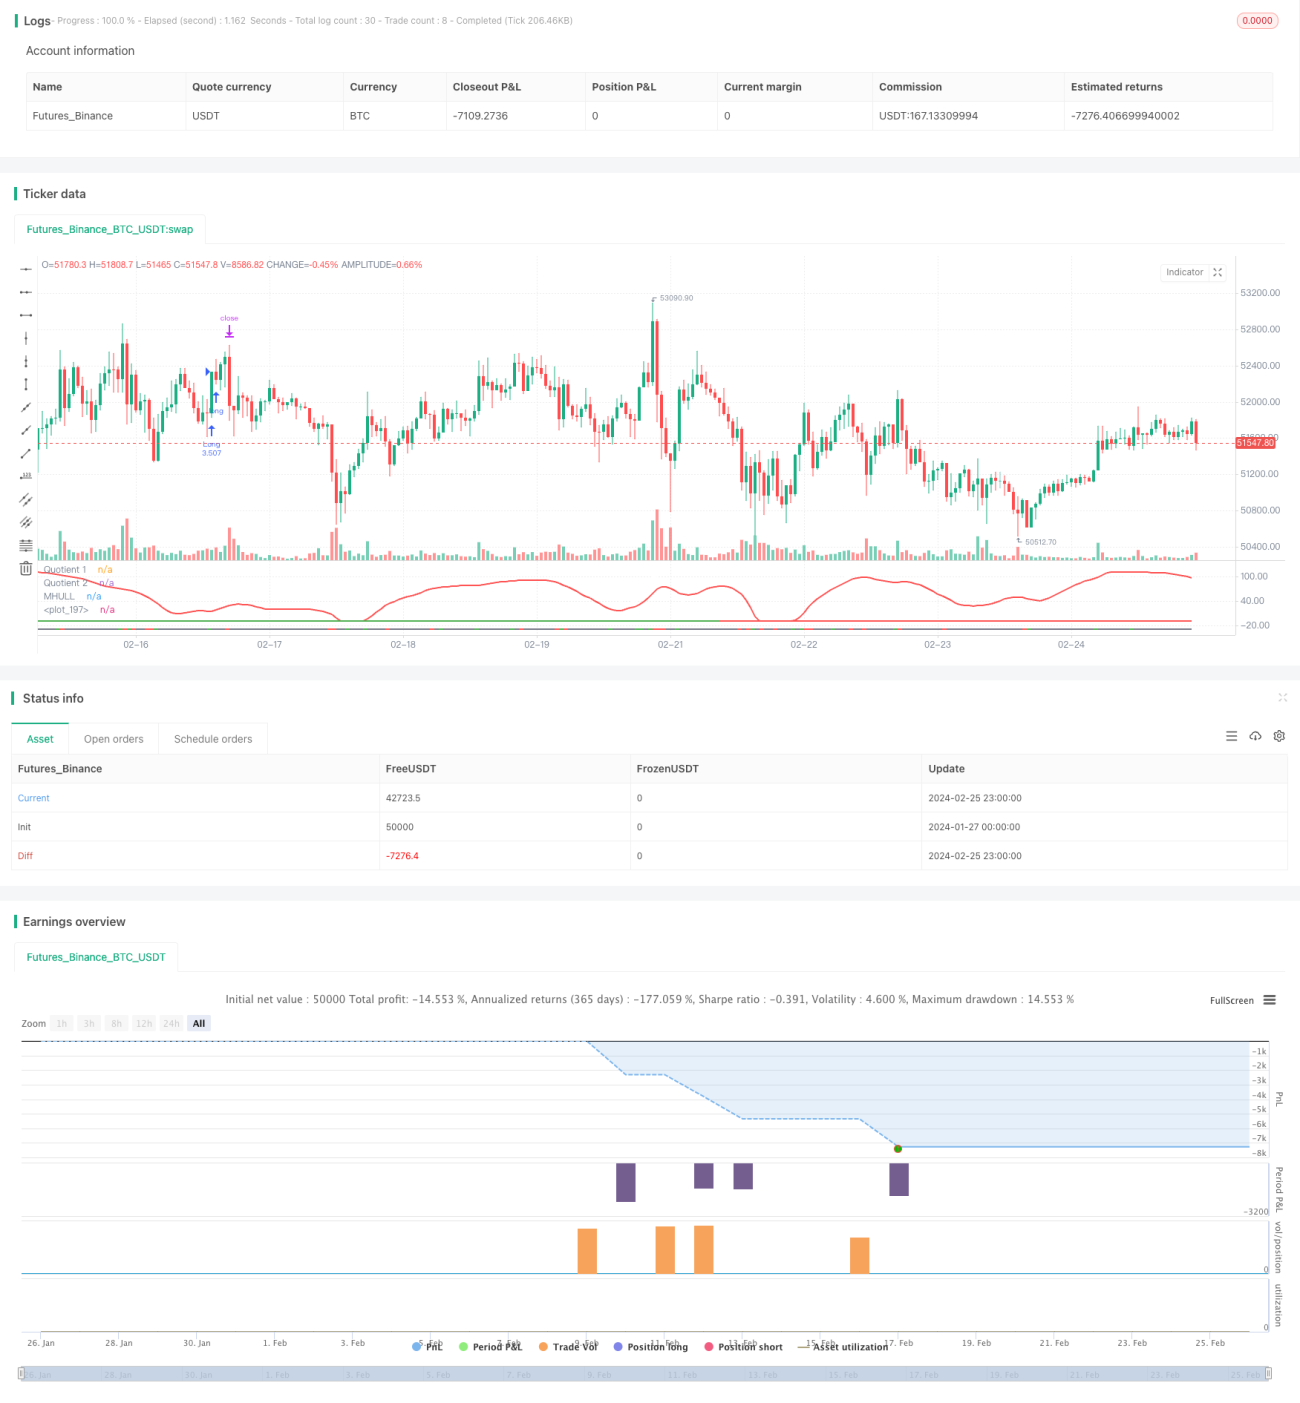
この戦略は,ブームハンター (Boom Hunter),ハル・スイート (Hull Suite) と波動率振動器 (Volatility Oscillator) の3つの指標を組み合わせて,複数の時間枠でトレンドを追跡し,突破取引を行うための量的な戦略を実現します.この戦略は,ビットコインなどの高波動性および突発的な価格状況を持つデジタル資産に適用されます.
この戦略の核心的な論理は以下の3つの指標に基づいています.
ブームハンター:指数圧縮技術を用いた振動器で,2つの指数 (Quotient1とQuotient2) の交差によって買入と売却の信号を判断する.
ハル・スイート:平らな移動均等線指標のセットで,中軌と上下軌の関係によってトレンド方向を判断する.
波動率振動器 (Volatility Oscillator) について価格の変動に関する情報を量化する振動指数である.
この戦略の入場論理は,布職人の2つのQuotient指標が上方または下方交差すると同時に,価格がヘルの中軌道を突破し,上線または下線から離れるようにすることであり, meanwhile波動率指標は超買い超売り領域にあります.これは,いくつかの偽の突破信号をフィルターして,入場の正確性を向上させます.
ストップロスは,特定の周期内 (デフォルトの20根K線) の最低谷または最高峰を探して設定され,利益は,配置のストップロスの比率 (デフォルトの3倍) でストップロスの比率で得られます. ポジションは,アカウントの総資産のパーセント (デフォルトの3%) と特定の標識のストップロスの幅に基づいて計算されます.
解決策は
この戦略は以下の点で最適化できます.
パラメータ最適化: 周期長,圧縮係数などの指標パラメータを変更して最適なパラメータの組み合わせを得る
タイムフレームの最適化異なる時間周期をテストする (例えば,1分,5分,30分など) 最適な取引周期を見つける
ポジション最適化取引ごとにポジションのサイズと割合を変化させ,資金の最適化方法を模索する
ストップ・ロスト・最適化: 異なる取引に応じてストップポジションの調整により,最適のリスク/リターン比率を達成する
条件の最適化: より正確な入場時刻を得るために,指標のフィルタリング条件を増加または減少させる
この戦略は,布置ハンター,ヘル・キット,波動率振動器の3つの指標の組み合わせを使用し,複数の時間枠内のトレンド追跡取引を実現し,価格の突発的な行動を効果的に識別することができ,高波動性のデジタル資産に適用されます. この戦略は,リスクが制御され,パラメータ,波条件,および止損などによって多方面で最適化され,強力な実戦性および拡張性があります.
/*backtest
start: 2024-01-27 00:00:00
end: 2024-02-26 00:00:00
period: 1h
basePeriod: 15m
exchanges: [{"eid":"Futures_Binance","currency":"BTC_USDT"}]
*/
// Strategy based on the 3 indicators:
// - Boom Hunter Pro
// - Hull Suite
// - Volatility Oscillator
//
// Strategy was designed for the purpose of back testing.
// See strategy documentation for info on trade entry logic.
//
// Credits:
// - Boom Hunter Pro: veryfid (https://www.tradingview.com/u/veryfid/)
// - Hull Suite: InSilico (https://www.tradingview.com/u/InSilico/)
// - Volatility Oscillator: veryfid (https://www.tradingview.com/u/veryfid/)
//@version=5
strategy("Boom Hunter + Hull Suite + Volatility Oscillator Strategy", overlay=false, initial_capital=1000, currency=currency.NONE, max_labels_count=500, default_qty_type=strategy.cash, commission_type=strategy.commission.percent, commission_value=0.01)
// =============================================================================
// STRATEGY INPUT SETTINGS
// =============================================================================
// ---------------
// Risk Management
// ---------------
swingLength = input.int(20, "Swing High/Low Lookback Length", group='Strategy: Risk Management', tooltip='Stop Loss is calculated by the swing high or low over the previous X candles')
accountRiskPercent = input.float(3, "Account percent loss per trade", step=0.1, group='Strategy: Risk Management', tooltip='Each trade will risk X% of the account balance')
profitFactor = input.float(3, "Profit Factor (R:R Ratio)", step = 0.1, group='Strategy: Risk Management')
// ----------
// Date Range
// ----------
start_year = input.int(title='Start Date', defval=2022, minval=2010, maxval=3000, group='Strategy: Date Range', inline='1')
start_month = input.int(title='', defval=1, group='Strategy: Date Range', inline='1', options = [1, 2, 3, 4, 5, 6, 7, 8, 9, 10, 11, 12])
start_date = input.int(title='', defval=1, group='Strategy: Date Range', inline='1', options = [1, 2, 3, 4, 5, 6, 7, 8, 9, 10, 11, 12, 13, 14, 15, 16, 17, 18, 19, 20, 21, 22, 23, 24, 25, 26, 27, 28, 29, 30, 31])
end_year = input.int(title='End Date', defval=2023, minval=1800, maxval=3000, group='Strategy: Date Range', inline='2')
end_month = input.int(title='', defval=1, group='Strategy: Date Range', inline='2', options = [1, 2, 3, 4, 5, 6, 7, 8, 9, 10, 11, 12])
end_date = input.int(title='', defval=1, group='Strategy: Date Range', inline='2', options = [1, 2, 3, 4, 5, 6, 7, 8, 9, 10, 11, 12, 13, 14, 15, 16, 17, 18, 19, 20, 21, 22, 23, 24, 25, 26, 27, 28, 29, 30, 31])
in_date_range = true
// =============================================================================
// INDICATORS
// =============================================================================
// ---------------
// Boom Hunter Pro
// ---------------
square = input.bool(true, title='Square Line?', group='Main Settings')
//Quotient
LPPeriod = input.int(6, title='Quotient | LPPeriod', inline='quotient', group='EOT 1 (Main Oscillator)')
K1 = input.int(0, title='K1', inline='quotient', group='EOT 1 (Main Oscillator)')
esize = 60 //, title = "Size", inline = "quotient2", group = "EOT 1 (Main Oscillator)")
ey = 50 //, title = "Y axis", inline = "quotient2", group = "EOT 1 (Main Oscillator)")
trigno = input.int(1, 'Trigger Length', group='EOT 1 (Main Oscillator)', inline='quotient2')
trigcol = input.color(color.white, title='Trigger Color:', group='EOT 1 (Main Oscillator)', inline='q2')
// EOT 2
//Inputs
LPPeriod2 = input.int(28, title='LPPeriod2', group='EOT 2 (Red Wave)', inline='q2')
K22 = input.float(0.3, title='K2', group='EOT 2 (Red Wave)', inline='q2')
//EOT 1
//Vars
alpha1 = 0.00
HP = 0.00
a1 = 0.00
b1 = 0.00
c1 = 0.00
c2 = 0.00
c3 = 0.00
Filt = 0.00
Peak = 0.00
X = 0.00
Quotient1 = 0.00
pi = 2 * math.asin(1)
//Highpass filter cyclic components
//whose periods are shorter than 100 bars
alpha1 := (math.cos(.707 * 2 * pi / 100) + math.sin(.707 * 2 * pi / 100) - 1) / math.cos(.707 * 2 * pi / 100)
HP := (1 - alpha1 / 2) * (1 - alpha1 / 2) * (close - 2 * nz(close[1]) + nz(close[2])) + 2 * (1 - alpha1) * nz(HP[1]) - (1 - alpha1) * (1 - alpha1) * nz(HP[2])
//SuperSmoother Filter
a1 := math.exp(-1.414 * pi / LPPeriod)
b1 := 2 * a1 * math.cos(1.414 * pi / LPPeriod)
c2 := b1
c3 := -a1 * a1
c1 := 1 - c2 - c3
Filt := c1 * (HP + nz(HP[1])) / 2 + c2 * nz(Filt[1]) + c3 * nz(Filt[2])
//Fast Attack - Slow Decay Algorithm
Peak := .991 * nz(Peak[1])
if math.abs(Filt) > Peak
Peak := math.abs(Filt)
Peak
//Normalized Roofing Filter
if Peak != 0
X := Filt / Peak
X
Quotient1 := (X + K1) / (K1 * X + 1)
// EOT 2
//Vars
alpha1222 = 0.00
HP2 = 0.00
a12 = 0.00
b12 = 0.00
c12 = 0.00
c22 = 0.00
c32 = 0.00
Filt2 = 0.00
Peak2 = 0.00
X2 = 0.00
Quotient4 = 0.00
alpha1222 := (math.cos(.707 * 2 * pi / 100) + math.sin(.707 * 2 * pi / 100) - 1) / math.cos(.707 * 2 * pi / 100)
HP2 := (1 - alpha1222 / 2) * (1 - alpha1222 / 2) * (close - 2 * nz(close[1]) + nz(close[2])) + 2 * (1 - alpha1222) * nz(HP2[1]) - (1 - alpha1222) * (1 - alpha1222) * nz(HP2[2])
//SuperSmoother Filter
a12 := math.exp(-1.414 * pi / LPPeriod2)
b12 := 2 * a12 * math.cos(1.414 * pi / LPPeriod2)
c22 := b12
c32 := -a12 * a12
c12 := 1 - c22 - c32
Filt2 := c12 * (HP2 + nz(HP2[1])) / 2 + c22 * nz(Filt2[1]) + c32 * nz(Filt2[2])
//Fast Attack - Slow Decay Algorithm
Peak2 := .991 * nz(Peak2[1])
if math.abs(Filt2) > Peak2
Peak2 := math.abs(Filt2)
Peak2
//Normalized Roofing Filter
if Peak2 != 0
X2 := Filt2 / Peak2
X2
Quotient4 := (X2 + K22) / (K22 * X2 + 1)
q4 = Quotient4 * esize + ey
//Plot EOT
q1 = Quotient1 * esize + ey
trigger = ta.sma(q1, trigno)
Plot3 = plot(trigger, color=trigcol, linewidth=2, title='Quotient 1')
Plot44 = plot(q4, color=color.new(color.red, 0), linewidth=2, title='Quotient 2')
// ----------
// HULL SUITE
// ----------
//INPUT
src = input(close, title='Source')
modeSwitch = input.string('Hma', title='Hull Variation', options=['Hma', 'Thma', 'Ehma'])
length = input(200, title='Length(180-200 for floating S/R , 55 for swing entry)')
lengthMult = input(2.4, title='Length multiplier (Used to view higher timeframes with straight band)')
useHtf = input(false, title='Show Hull MA from X timeframe? (good for scalping)')
htf = input.timeframe('240', title='Higher timeframe')
//FUNCTIONS
//HMA
HMA(_src, _length) =>
ta.wma(2 * ta.wma(_src, _length / 2) - ta.wma(_src, _length), math.round(math.sqrt(_length)))
//EHMA
EHMA(_src, _length) =>
ta.ema(2 * ta.ema(_src, _length / 2) - ta.ema(_src, _length), math.round(math.sqrt(_length)))
//THMA
THMA(_src, _length) =>
ta.wma(ta.wma(_src, _length / 3) * 3 - ta.wma(_src, _length / 2) - ta.wma(_src, _length), _length)
//SWITCH
Mode(modeSwitch, src, len) =>
modeSwitch == 'Hma' ? HMA(src, len) : modeSwitch == 'Ehma' ? EHMA(src, len) : modeSwitch == 'Thma' ? THMA(src, len / 2) : na
//OUT
_hull = Mode(modeSwitch, src, int(length * lengthMult))
HULL = useHtf ? request.security(syminfo.ticker, htf, _hull) : _hull
MHULL = HULL[0]
SHULL = HULL[2]
//COLOR
hullColor = MHULL > SHULL ? color.green : color.red
//PLOT
///< Frame
Fi1 = plot(-10, title='MHULL', color=hullColor, linewidth=2)
// -----------------
// VOLUME OSCILLATOR
// -----------------
volLength = input(80)
spike = close - open
x = ta.stdev(spike, volLength)
y = ta.stdev(spike, volLength) * -1
volOscCol = spike > x ? color.green : spike < y ? color.red : color.gray
plot(-30, color=color.new(volOscCol, transp=0), linewidth=2)
// =============================================================================
// STRATEGY LOGIC
// =============================================================================
// Boom Hunter Pro entry conditions
boomLong = ta.crossover(trigger, q4)
boomShort = ta.crossunder(trigger, q4)
// Hull Suite entry conditions
hullLong = MHULL > SHULL and close > MHULL
hullShort = MHULL < SHULL and close < SHULL
// Volatility Oscillator entry conditions
volLong = spike > x
volShort = spike < y
inLong = strategy.position_size > 0
inShort = strategy.position_size < 0
longCondition = boomLong and hullLong and volLong and in_date_range
shortCondition = boomShort and hullShort and volShort and in_date_range
swingLow = ta.lowest(source=low, length=swingLength)
swingHigh = ta.highest(source=high, length=swingLength)
atr = ta.atr(14)
longSl = math.min(close - atr, swingLow)
shortSl = math.max(close + atr, swingHigh)
longStopPercent = math.abs((1 - (longSl / close)) * 100)
shortStopPercent = math.abs((1 - (shortSl / close)) * 100)
longTpPercent = longStopPercent * profitFactor
shortTpPercent = shortStopPercent * profitFactor
longTp = close + (close * (longTpPercent / 100))
shortTp = close - (close * (shortTpPercent / 100))
// Position sizing (default risk 3% per trade)
riskAmt = strategy.equity * accountRiskPercent / 100
longQty = math.abs(riskAmt / longStopPercent * 100) / close
shortQty = math.abs(riskAmt / shortStopPercent * 100) / close
if (longCondition and not inLong)
strategy.entry("Long", strategy.long, qty=longQty)
strategy.exit("Long SL/TP", from_entry="Long", stop=longSl, limit=longTp, alert_message='Long SL Hit')
buyLabel = label.new(x=bar_index, y=high[1], color=color.green, style=label.style_label_up)
label.set_y(id=buyLabel, y=-40)
label.set_tooltip(id=buyLabel, tooltip="Risk Amt: " + str.tostring(riskAmt) + " Qty: " + str.tostring(longQty) + " Swing low: " + str.tostring(swingLow) + " Stop Percent: " + str.tostring(longStopPercent) + " TP Percent: " + str.tostring(longTpPercent))
if (shortCondition and not inShort)
strategy.entry("Short", strategy.short, qty=shortQty)
strategy.exit("Short SL/TP", from_entry="Short", stop=shortSl, limit=shortTp, alert_message='Short SL Hit')
sellLabel = label.new(x=bar_index, y=high[1], color=color.red, style=label.style_label_up)
label.set_y(id=sellLabel, y=-40)
label.set_tooltip(id=sellLabel, tooltip="Risk Amt: " + str.tostring(riskAmt) + " Qty: " + str.tostring(shortQty) + " Swing high: " + str.tostring(swingHigh) + " Stop Percent: " + str.tostring(shortStopPercent) + " TP Percent: " + str.tostring(shortTpPercent))