勢いバースト追跡戦略に基づく
概要
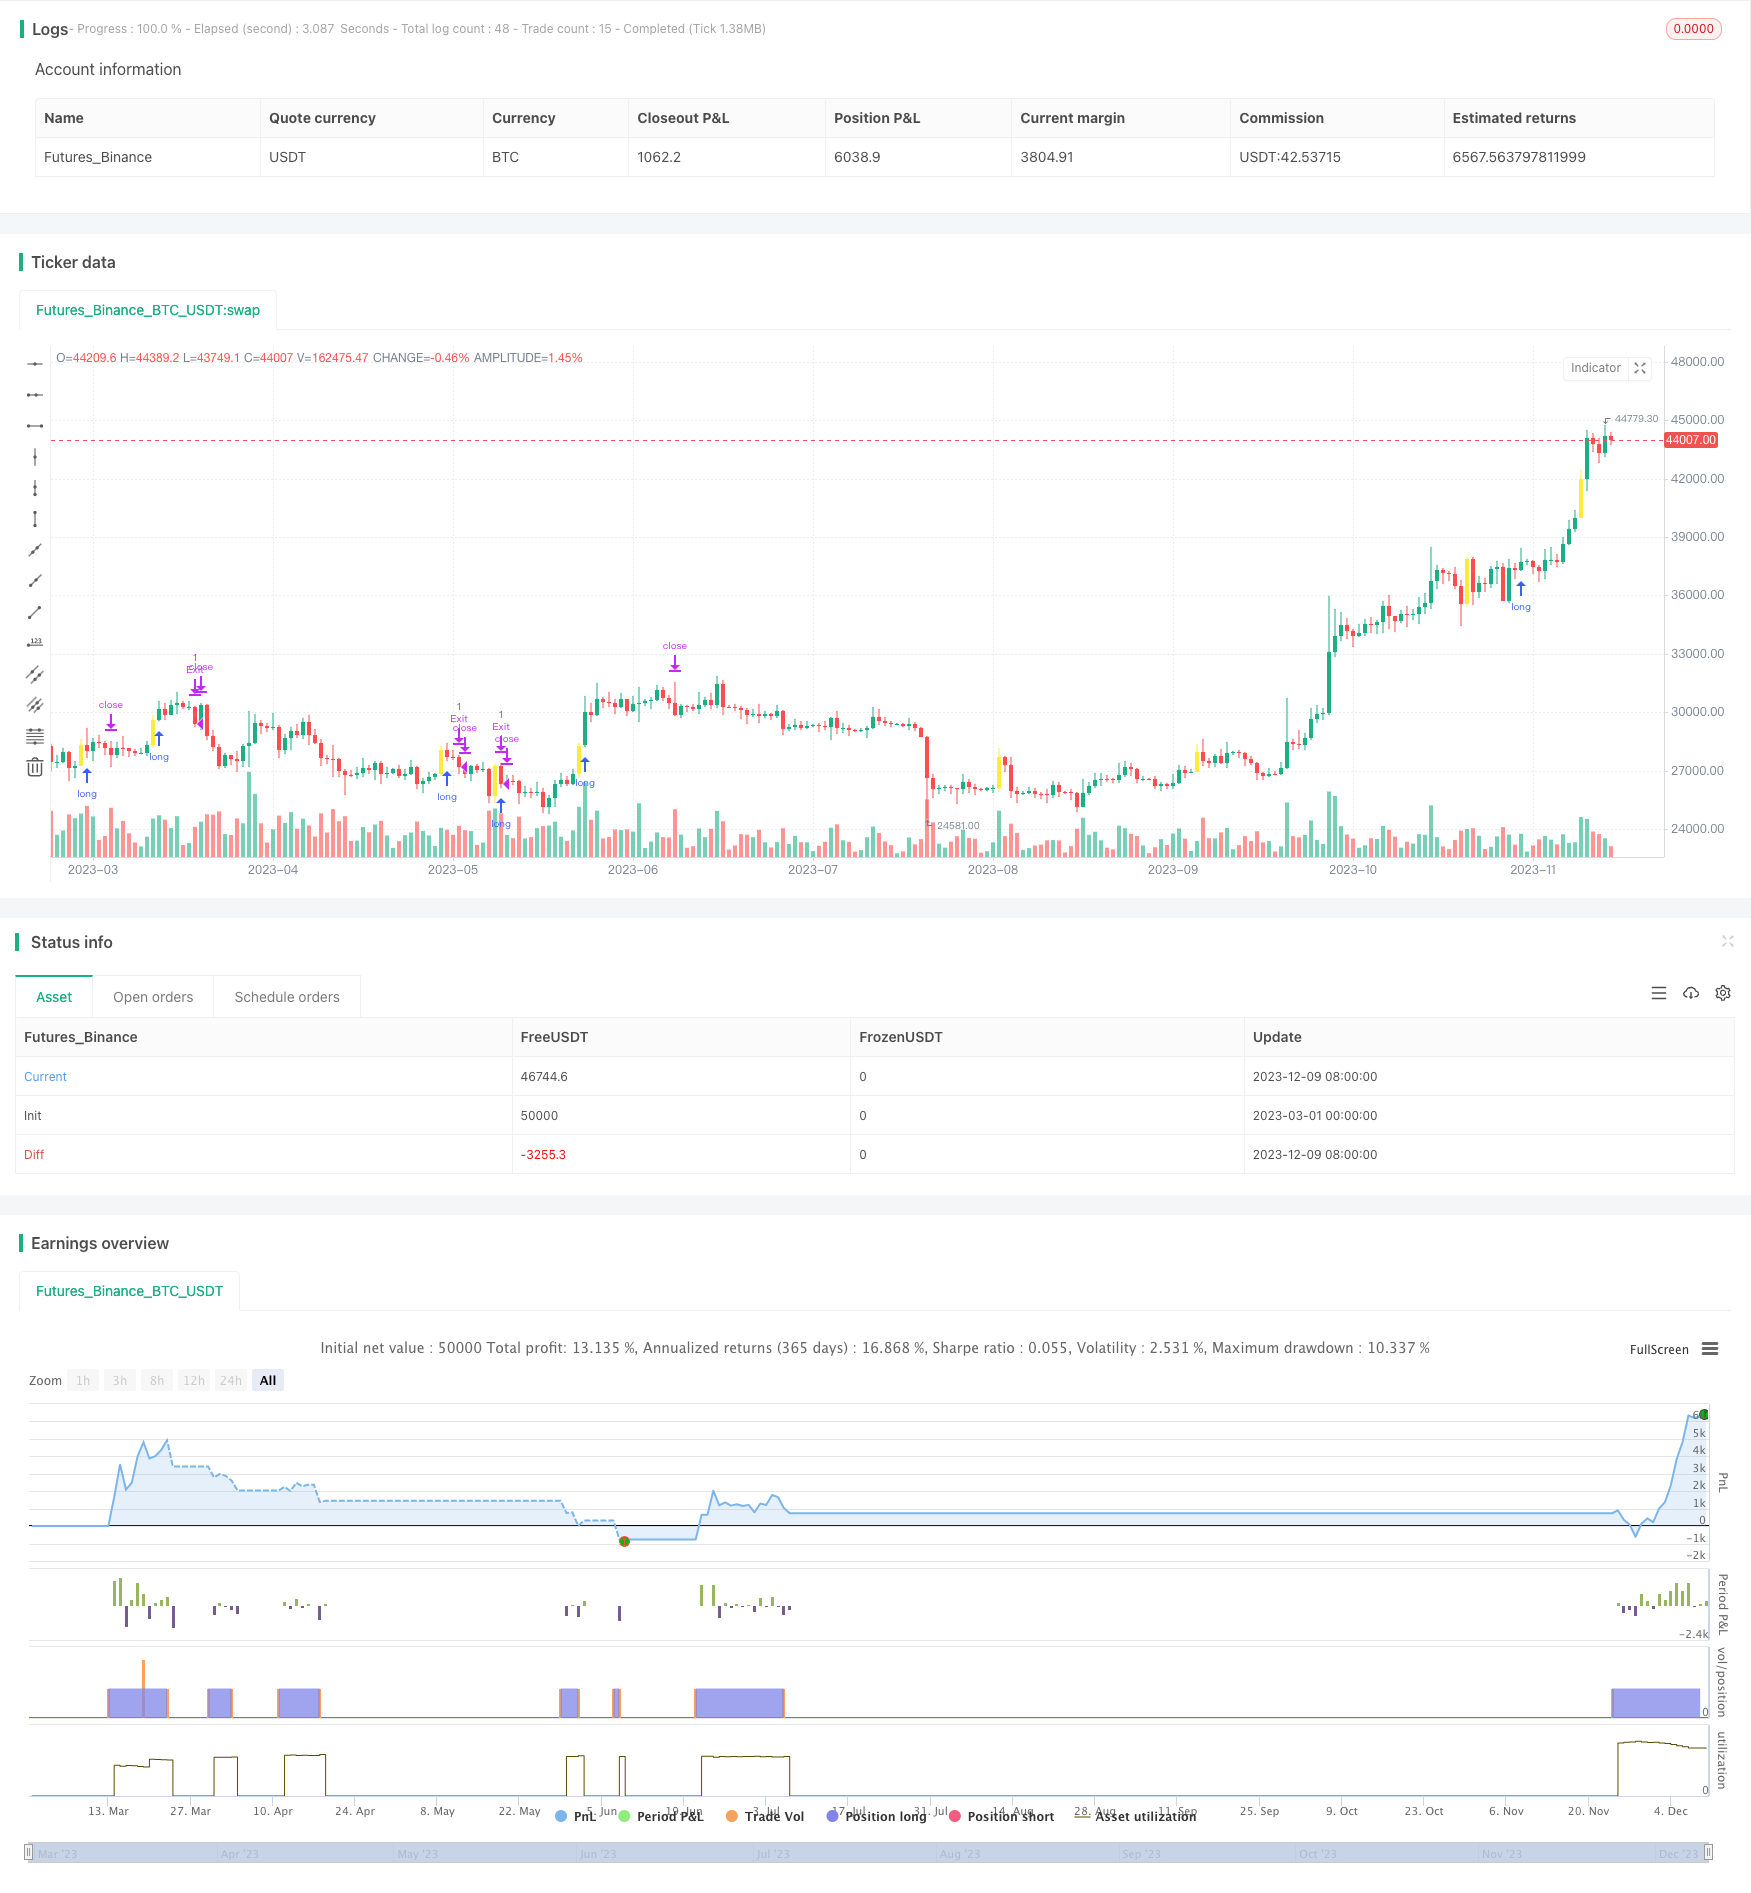
動力の爆発追跡戦略は,価格変化のパーセントを計算して価格の突破を判断し,交差量フィルタリング信号を合成し,高い確率でトレンドをキャプチャする突破点を実現する.買取信号が誘発された後に,この戦略は,価格の追跡のストップダスの方法で利益をロックし,過剰な撤回を回避する.
戦略原則
この戦略は,以下の指標によって購入のタイミングを判断します.
価格変化のパーセント ((isFourPercentBull) - 価格が有効に突破されたかどうかを判断するために,前日の閉店価格に対する閉店価格の変化のパーセントを計算します.
閉店価格と最高価格の比率 (HighCloseRatio) - 閉店価格と最高価格の比率を計算して,価格の突破強さを判断する.
取引量 (volume) - 取引量が前日より大きいことを要求し,有効なブレークスルーを確保する.
200日単調移動平均 ((SMA)) - 閉盘価格と開盤価格の両方が200日線より高いことを要求し,トレンドの方向を判断する.
上記の複数の条件が同時に満たされると,買取信号を発する.その後,この戦略は,価格追跡のストップ・ロスを採用して,積極的にストップ・ロスを実行し,利益をロックする.具体的には,ストップ・ロスを追跡する計算式は以下の通りである.
trailPrice = close * (100 - trailPercent) / 100
このTrailPercentは,設定可能なストップトラッキングパーセントである.これは,価格が上昇すれば,ストップラインも上昇し,利益をロックします.価格がストップラインに戻ると,平仓ストップです.
戦略的優位性
これは典型的な突破策で,以下の利点があります.
- 複数の条件のフィルタリングにより,突破の有効性を確保し,偽突破を回避する.
- 価格の追跡によるストップ・ロスは,最大限の撤回を回避するために,積極的にストップ・ロスを実行し,利益をロックします.
- 戦略の論理はシンプルでわかりやすく,理解しやすく,最適化できます.
戦略リスク
この戦略にはいくつかのリスクがあります.
- 破綻の可能性は依然としてあり,損失は完全に避けられない.
- 追跡停止の過度に過激化により,頻繁に停止することがあります.
- パラメータを正しく設定しない場合,取引頻度が高くなり,信号が失われる可能性があります.
リスクに対応する解決策は
- パラメータを最適化し,ストップ・ローズを低減し,十分なスペースを確保する.
- 明確なトレンドを見逃さないように,破裂条件を適切に緩和する.
- 異なる品種をテストし,戦略の安定性を評価する.
最適化の方向
この戦略の高いストップ・ロー率を考慮して,以下の方向でさらに最適化することができます.
- 他のストップトラッキング方法を試してみましょう. 平均トラッキング,ATR,波動率トラッキングなどです.
- 機械学習のアルゴリズムを追加し,歴史データ訓練に基づいて,より効果的な突破パラメータの組み合わせを判断する.
- 取引量によるブレイクによる補助判断条件を追加し,ブレイク効果を確保する.
- 異なる品種のパラメータ設定の違いを評価し,最適の適合品種を探します.
要約する
動力爆発追跡戦略は,全体的に非常に実用的なトレンド追跡戦略である.それは,突破戦略で有効な止損と停止ができない問題を解決し,トレンドをキャプチャしながら,リスクをうまく制御することができる.パラメータ最適化や機械学習などの手段の導入により,この戦略の効果はさらに向上する余地があり,深入の研究と応用に値する.
/*backtest
start: 2023-03-01 00:00:00
end: 2023-12-10 05:20:00
period: 1d
basePeriod: 1h
exchanges: [{"eid":"Futures_Binance","currency":"BTC_USDT"}]
*/

// This source code is subject to the terms of the Mozilla Public License 2.0 at https://mozilla.org/MPL/2.0/
// © doks23

//@version=5
strategy(title = "SD:Momentum Burst", overlay=true, initial_capital=1000,commission_value = 0,slippage = 0,process_orders_on_close=true)

//Check Vol
checkVol = input.bool(defval=false,title="IncludeAvgVolume?")
volSMAlength = input(50, title="VolumeLength")
volumeSma = ta.sma(volume, volSMAlength)
highvolume = volume >= volumeSma
volumeCond=checkVol?highvolume:true

// Profit and Loss
trailPercent    = input.float(title="Trail%", defval=3, step=0.1)

//longCondition
PercentThreshold=input.float(3.8,'BreakoutPercent', step=0.1)
MaxThreshold=input.float(10,'Max Breakout', step=0.1)
HighCloseRatio=input.float(70,'Close to High Ratio', step=1)
float candleCloseBull = ((close[0] - open[0]) / (high[0] - open[0]) * 100)
float isFourPercentBull = (((close[0] - close[1]) / close[1]) * 100)
LongCond=volume > volume[1] and isFourPercentBull > PercentThreshold and candleCloseBull > HighCloseRatio and isFourPercentBull<MaxThreshold
barcolor(color=(LongCond?color.yellow: na),title='BObar')
longCondition= LongCond and volumeCond and close>ta.sma(close,200) and open>ta.sma(close,200)

//Input Strategy
DateCheck=  input.bool(title = 'Custom Date Range?', defval=true,group = 'Strategy')
FromDate=   input(defval = timestamp("1 Jan 2019 00:00"),group = 'Strategy')
ToDate      =input(defval = timestamp("31 Dec 2023 00:00"),group = 'Strategy')
PostionSize =input.string('Contract','Select Position Size',options = ['Percent of Equity','Contract'],group = 'Strategy')
ContractQty =input.int(1,'No of Contract',group = 'Strategy')

//Backtesting Date Range
TimeWindow=true
// Number of Contract
var int trade_qty=na
if(PostionSize=='Contract')
    trade_qty:=ContractQty
else
    trade_qty:= (strategy.equity>strategy.initial_capital)?math.floor(strategy.equity/strategy.initial_capital):ContractQty


//Position Buy
BuyTriggerPrice = ta.valuewhen(longCondition,high,0)
//Trailing price
var float trailPrice    = na
float percentMulti = (100 - trailPercent) / 100
longCondition2=longCondition and TimeWindow
if longCondition2
    strategy.entry("Long", strategy.long,qty=trade_qty,stop = BuyTriggerPrice)
    trailPrice := close*percentMulti
if strategy.position_size>0
    trailPrice := math.max(close*percentMulti,trailPrice[1])
    if low <= trailPrice
        strategy.exit('Exit','Long',stop = trailPrice)
        if strategy.position_size==0
            trailPrice:=na
// Plot Strategy
var float trail_long_SL=na
if strategy.position_size>0
    trail_long_SL:=trailPrice
else
    trail_long_SL:=na
//Strategy Plot
PlotMA=input.bool(title="Plot MA?", defval=false)
plot(PlotMA?ta.sma(close,10):na,color = color.red,title = '10MA')
plot(PlotMA?ta.sma(close,21):na,color = color.white,title = '21MA')
plot(PlotMA?ta.sma(close,200):na,color = color.orange,title = '200MA')
// plot(trail_long_SL,color = color.gray,style = plot.style_steplinebr,linewidth = 1)