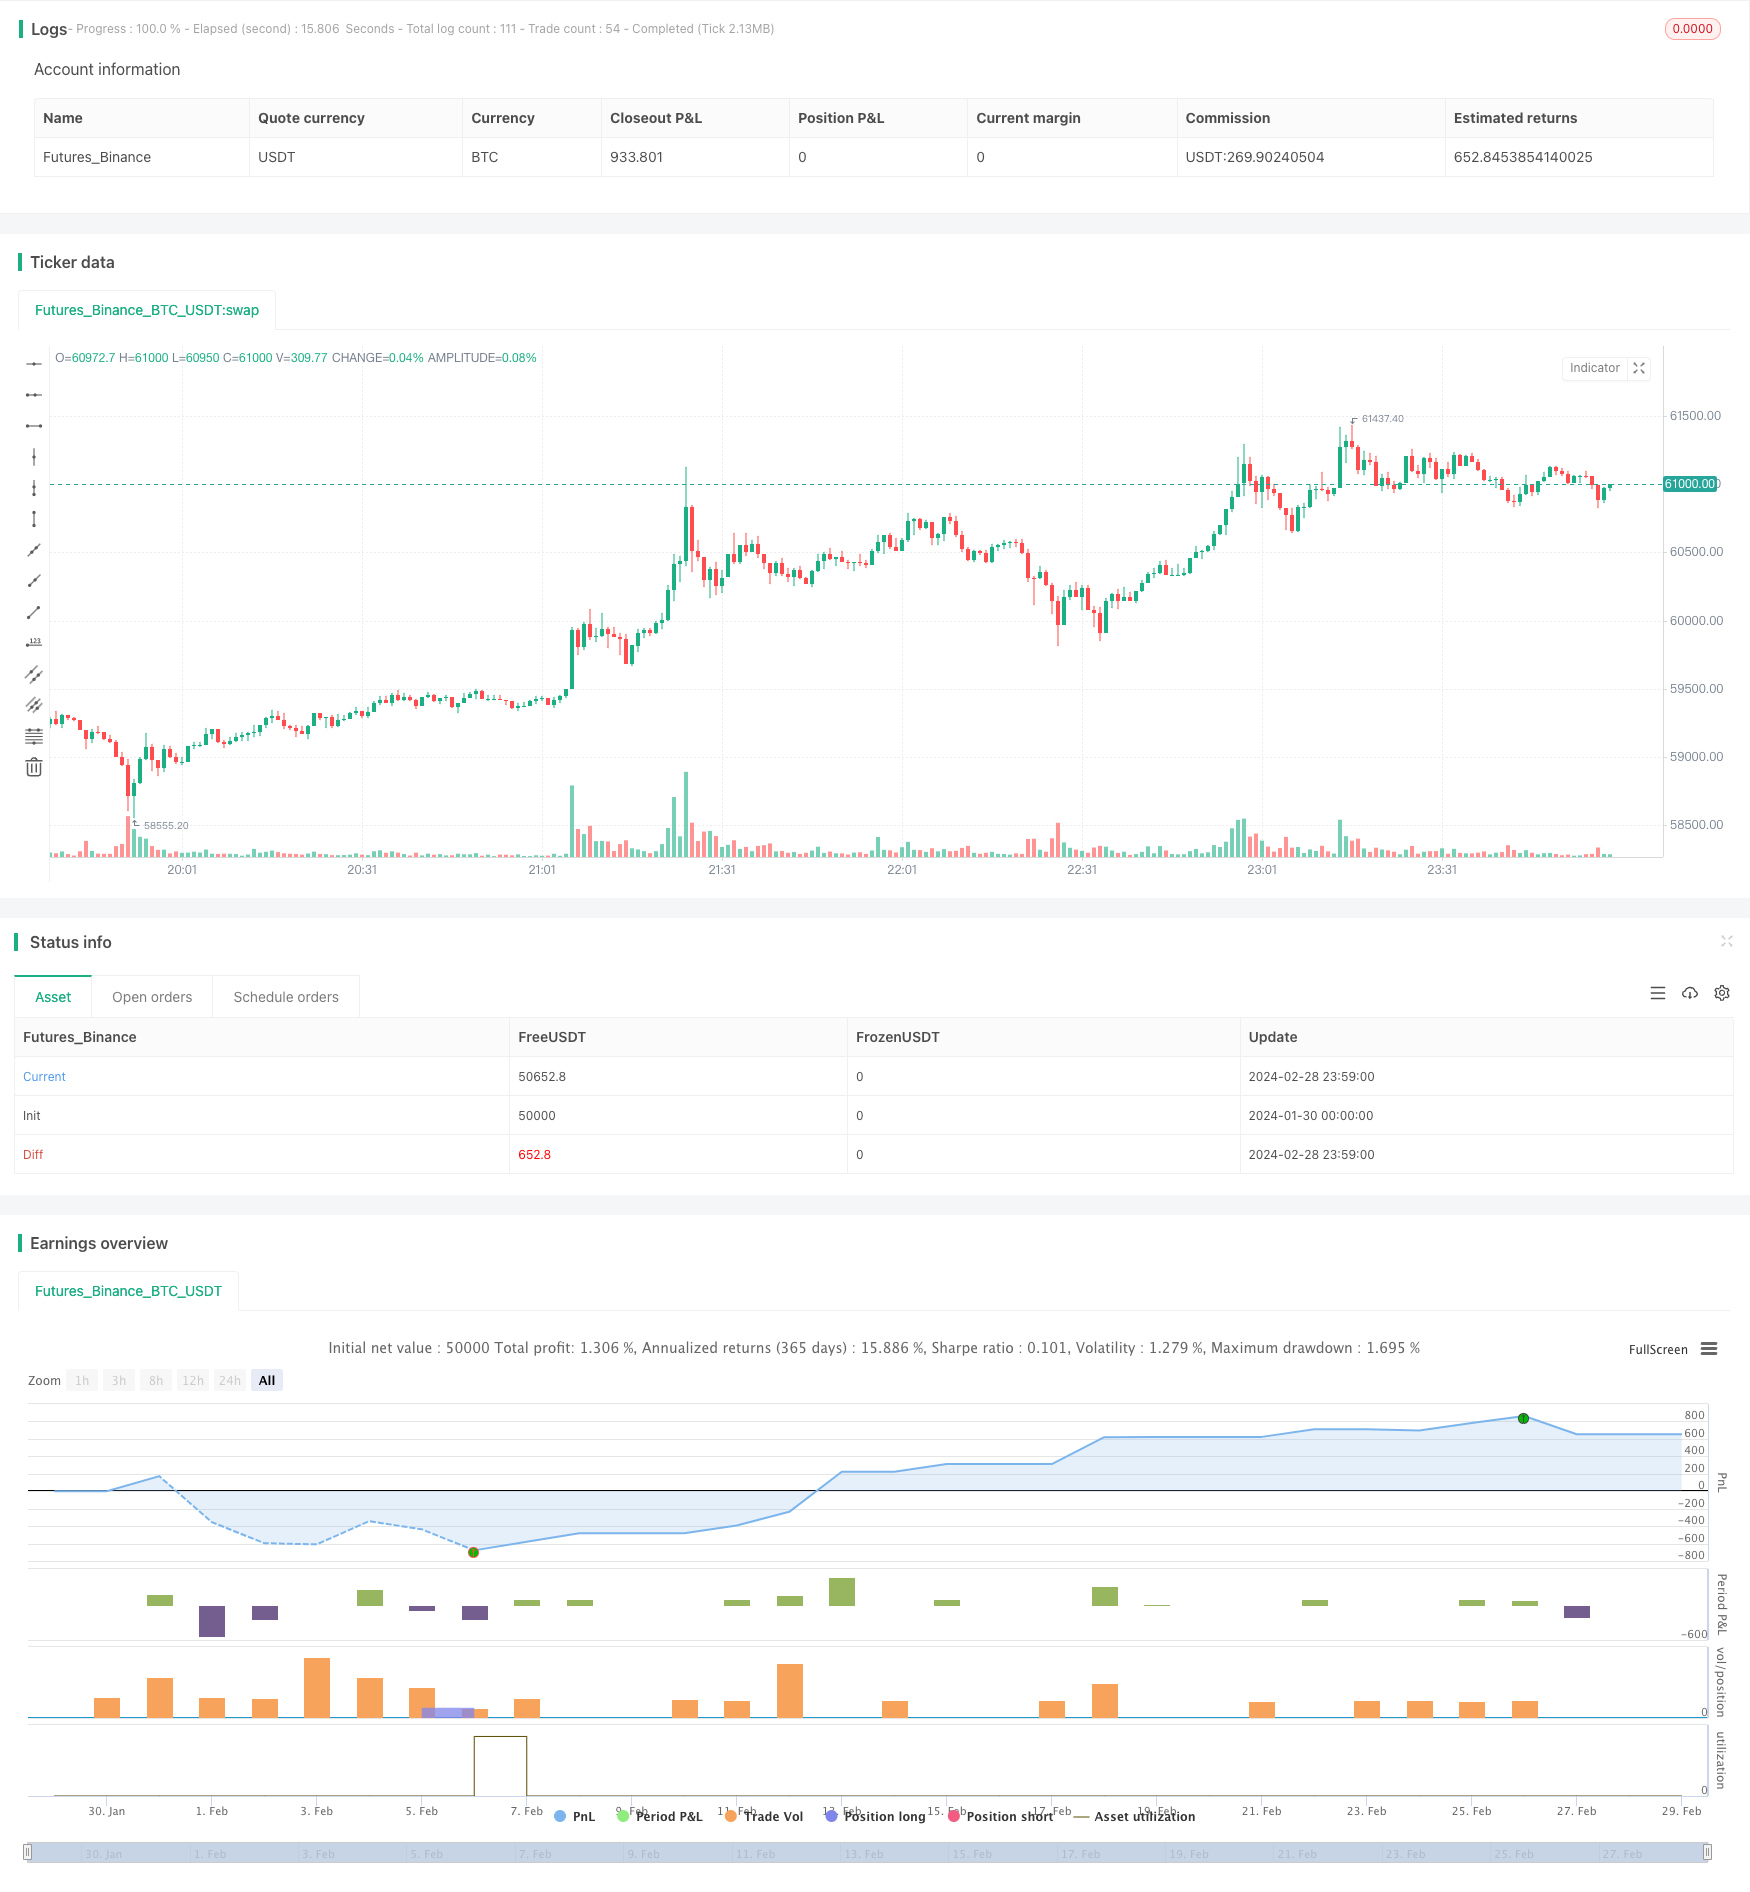
RSIと平滑化RSI戦略の強気パターン
作成日:
2024-03-01 12:11:58
最終変更日:
2024-03-01 12:11:58
コピー:
2
クリック数:
818
1
フォロー
1664
フォロワー

概要
この戦略は,RSI指標と平らなRSI指標を組み合わせて,価格の低点での購入の機会を探します.RSI指標が低で,価格が低くないとき,多頭型型信号と見なされます.平らなRSI指標のトレンド判断を組み合わせて,戦略の効果を高めることができます.
戦略原則
- RSIを計算すると,パラメータは14日線である.
- 平らなRSIを計算し,二重WMA平均によって平らな効果を実現する.
- RSIが30以下なら,オーバーセールです.
- 滑らかなRSIが35以下であるかどうかを判断し,方向性が強い.
- RSIの最低値が25より低いかどうかを判断する.
- RSIの分類を計算する,つまりRSIが低で価格が低でない状況を探すこと.
- RSIを平らにするには,3日間の周期が必要です.
- 上記の条件が満たされた場合,購入シグナルが生成されます.
- 停止・停止条件を設定する.
この戦略は,主にRSI指標の反転性に依存し,平らなRSI判断の傾向と組み合わせて,価格が圧力を負うとRSIが超売りするときに購入する. ストップまたはストップ・ロスの後に平らなポジションに達する.
戦略的優位分析
- 戦略の効果を高めるための二重RSI指標の組み合わせ.
- RSIの反転特性を利用して,一定の確率の優位性があります.
- RSIの平らな判断は,偽の逆転を避けるのに役立ちます.
- 完全なストップ・ストップ・ストップの論理により,リスクが制限されます.
リスク分析
- RSIの逆転の失敗の可能性は,完全に避けられない.
- RSIの平滑は後退し,ベスト・バイのタイミングを逃しているかもしれない.
- ストップポイントが過度に緩やかになり,損失が拡大するリスクがある.
RSIのパラメータを調整することで,購入のタイミングを最適化できます. 適切な停止間隔を短縮し,停止速度を加速します. 他の指標と組み合わせて,トレンドのリスクを判断し,偽の反転の確率を減らすことができます.
最適化の方向
- RSI指標の効果を異なるパラメータでテストすることができます.
- 滑らかなRSIの計算方法の最適化,滑らかな品質の向上
- 最適なリスク/リターン比率を探すために,ストップ・ストップ・ストラストを調整する.
- 判断力を高め,能力不足を回避する.
パラメータの調整とより多くの指標の組み合わせにより,戦略取引の効果をさらに高めることができます.
要約する
この戦略全体は,RSI反転特性を利用する戦略思路である.双RSI指標の組み合わせは,RSI反転の効果を充分に発揮しながら,指標の差異によってもたらされる不確実性を増加させる.全体は,典型的な指標戦略思路である.継続的なテストにより,指標のパラメータの適性を向上させることができる.また,誤判の確率を低減し,戦略の強さを高めるために,より多くの指標の判断を組み合わせることができる.
ストラテジーソースコード
/*backtest
start: 2024-01-30 00:00:00
end: 2024-02-29 00:00:00
period: 1m
basePeriod: 1m
exchanges: [{"eid":"Futures_Binance","currency":"BTC_USDT"}]
*/

// This source code is subject to the terms of the Mozilla Public License 2.0 at https://mozilla.org/MPL/2.0/
// © BigBitsIO

//@version=4
strategy(title="RSI and Smoothed RSI Bull Div Strategy [BigBitsIO]", shorttitle="RSI and Smoothed RSI Bull Div Strategy [BigBitsIO]", overlay=true, pyramiding=1, default_qty_type=strategy.percent_of_equity, default_qty_value=100, commission_type=strategy.commission.percent, commission_value=.1, slippage=0)


TakeProfitPercent = input(3, title="Take Profit %", type=input.float, step=.25)
StopLossPercent = input(1.75, title="Stop Loss %", type=input.float, step=.25)

RSICurve = input(14, title="RSI Lookback Period", type=input.integer, step=1)
BuyBelowTargetPercent = input(0, title="Buy Below Lowest Low In RSI Divergence Lookback Target %", type=input.float, step=.05)
BuyBelowTargetSource = input(close, title="Source of Buy Below Target Price", type=input.source)
SRSICurve = input(10, title="Smoothed RSI Lookback Period", type=input.integer, step=1)
RSICurrentlyBelow = input(30, title="RSI Currently Below", type=input.integer, step=1)
RSIDivergenceLookback = input(25, title="RSI Divergence Lookback Period", type=input.integer, step=1)
RSILowestInDivergenceLookbackCurrentlyBelow  = input(25, title="RSI Lowest In Divergence Lookback Currently Below", type=input.integer, step=1)
RSISellAbove = input(65, title="RSI Sell Above", type=input.integer, step=1)
MinimumSRSIDownTrend = input(3, title="Minimum SRSI Downtrend Length", type=input.integer, step=1)
SRSICurrentlyBelow = input(35, title="Smoothed RSI Currently Below", type=input.integer, step=1)

PlotTarget = input(false, title="Plot Target")


RSI = rsi(close, RSICurve)
SRSI = wma(2*wma(RSI, SRSICurve/2)-wma(RSI, SRSICurve), round(sqrt(SRSICurve))) // Hull moving average

SRSITrendDownLength = 0
if (SRSI < SRSI[1])
    SRSITrendDownLength := SRSITrendDownLength[1] + 1

// Strategy Specific
ProfitTarget = (close * (TakeProfitPercent / 100)) / syminfo.mintick
LossTarget = (close * (StopLossPercent / 100)) / syminfo.mintick
BuyBelowTarget = BuyBelowTargetSource[(lowestbars(RSI, RSIDivergenceLookback)*-1)] - (BuyBelowTargetSource[(lowestbars(RSI, RSIDivergenceLookback)*-1)] * (BuyBelowTargetPercent / 100))

plot(PlotTarget ? BuyBelowTarget : na)


bool IsABuy = RSI < RSICurrentlyBelow and SRSI < SRSICurrentlyBelow and lowest(SRSI, RSIDivergenceLookback) < RSILowestInDivergenceLookbackCurrentlyBelow and BuyBelowTargetSource < BuyBelowTarget and SRSITrendDownLength >= MinimumSRSIDownTrend and RSI > lowest(RSI, RSIDivergenceLookback)
bool IsASell = RSI > RSISellAbove

if IsABuy
    strategy.entry("Positive Trend", true) // buy by market
    strategy.exit("Take Profit or Stop Loss", "Positive Trend", profit = ProfitTarget, loss = LossTarget)
if IsASell
    strategy.close("Positive Trend")