RSI MTF Ob+Os
저자:발명가 양자화, 날짜: 2022-05-09 15:35:09태그:RSI
안녕하세요, 상인 여러분
이 지표는 제 이전 지표와 동일한 개념을 사용합니다.
그것은 단순한
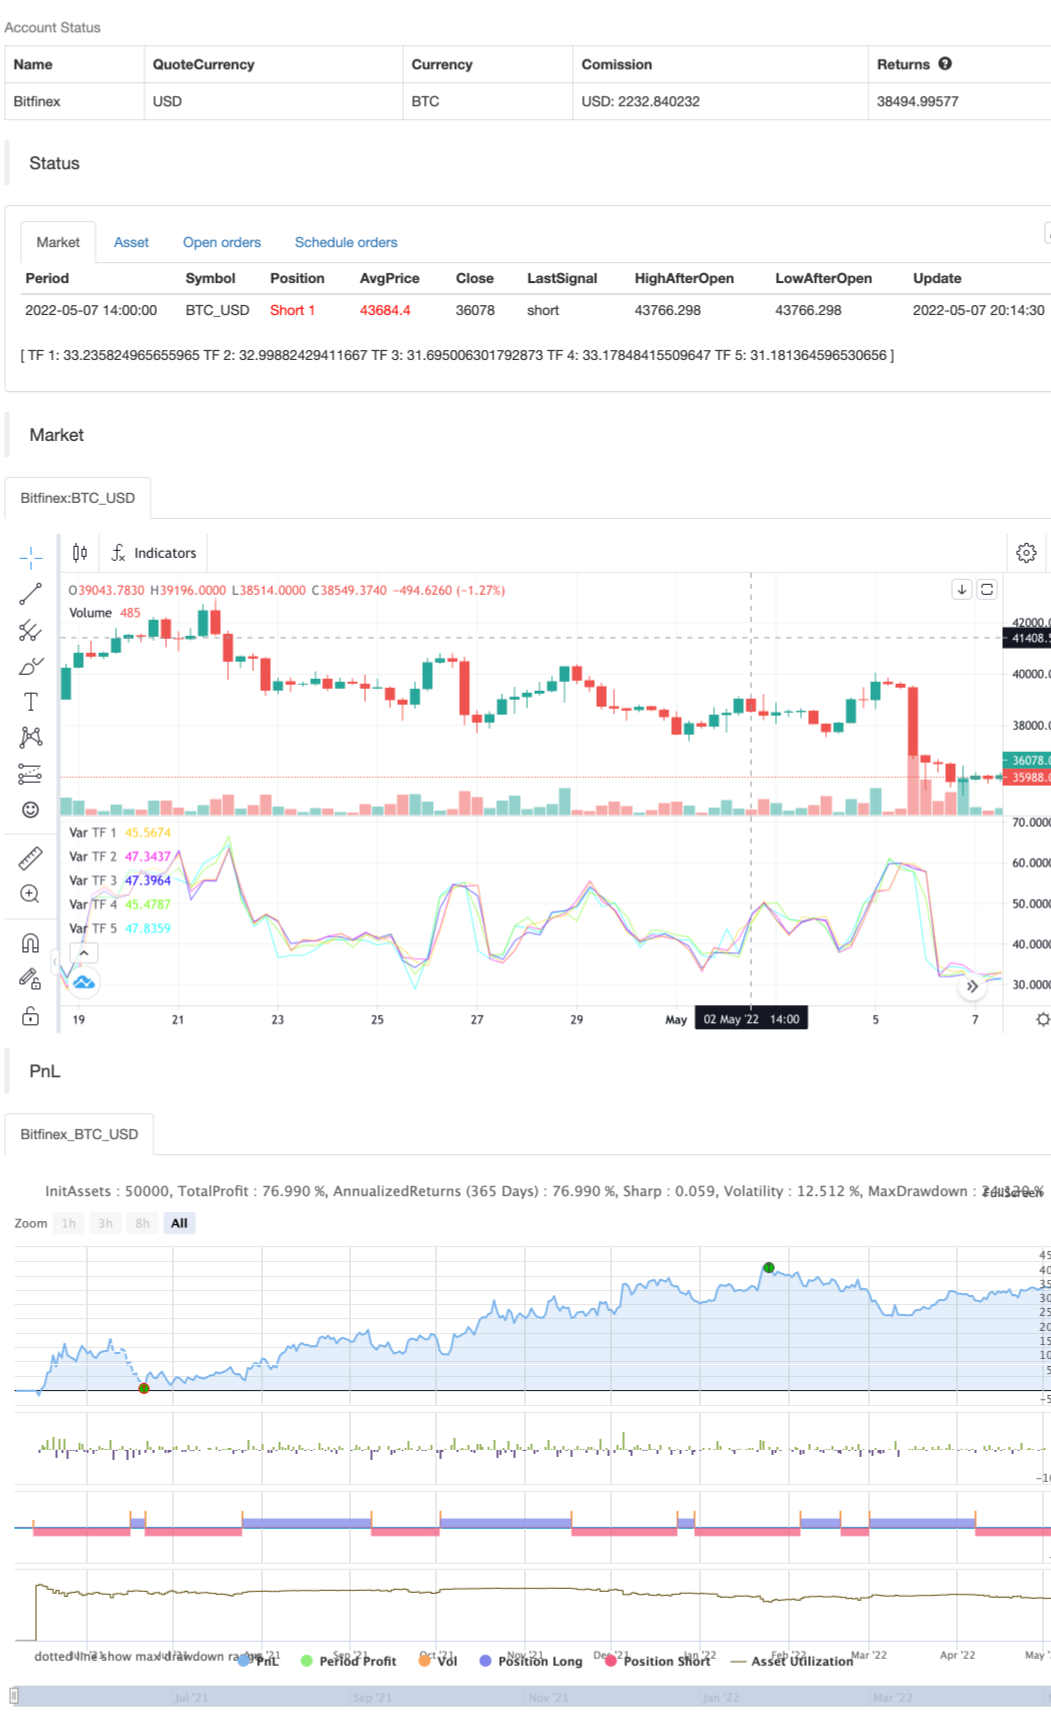
5 시간 프레임까지 과잉 구매 및 과잉 판매 수준을 감지 할 수 있습니다. 이는 거래자가 잠재적인 반전 지점을 더 쉽게 발견하는 데 도움이됩니다.
1-5 시간 프레임을 선택하여 과반 구매 및 과반 판매를 감지할 수 있는 옵션이 있습니다.
아쿠아 배그라운드는
잘 보내세요:)
/*backtest
start: 2021-05-08 00:00:00
end: 2022-05-07 23:59:00
period: 6h
basePeriod: 15m
exchanges: [{"eid":"Bitfinex","currency":"BTC_USD"}]
*/

// This source code is subject to the terms of the Mozilla Public License 2.0 at https://mozilla.org/MPL/2.0/

// © thakon33

//    __  __        __             ____ ____

//   / /_/ /  ___ _/ /_____  ___  |_  /|_  /

//  / __/ _ \/ _ `/  '_/ _ \/ _ \_/_ <_/_ <

//  \__/_//_/\_,_/_/\_\\___/_//_/____/____/


//@version=5

indicator("RSI MTF Ob+Os")


//------------------------------------------------------------------------------

// Input

var g_rsi       = "[ RSI SETTING ]"

rsiSrc          = input    (title="Source",     defval=close,                                group=g_rsi)

rsiLength       = input.int(title="Length",     defval=14,     minval=1,                     group=g_rsi)

rsiOverbought   = input.int(title="Overbought", defval=65,     minval=50, maxval=99, step=1, group=g_rsi)

rsiOversold     = input.int(title="Oversold",   defval=35,     minval=1,  maxval=50, step=1, group=g_rsi)


var g_tf        = "[ SELECT TIMEFRAME ]"

rsiTf1          = input.timeframe(title="Timeframe 1", defval="15",  group=g_tf, inline="tf1")

rsiTf2          = input.timeframe(title="Timeframe 2", defval="30",  group=g_tf, inline="tf2")

rsiTf3          = input.timeframe(title="Timeframe 3", defval="60",  group=g_tf, inline="tf3")

rsiTf4          = input.timeframe(title="Timeframe 4", defval="120", group=g_tf, inline="tf4")

rsiTf5          = input.timeframe(title="Timeframe 5", defval="240", group=g_tf, inline="tf5")

rsiTf1_E        = input.bool(title="", defval=true, group=g_tf, inline="tf1")

rsiTf2_E        = input.bool(title="", defval=true, group=g_tf, inline="tf2")

rsiTf3_E        = input.bool(title="", defval=true, group=g_tf, inline="tf3")

rsiTf4_E        = input.bool(title="", defval=true, group=g_tf, inline="tf4")

rsiTf5_E        = input.bool(title="", defval=true, group=g_tf, inline="tf5")


//------------------------------------------------------------------------------

// Calculate RSI


Fsec(Sym, Tf, Exp) =>

    request.security(Sym, Tf, Exp[barstate.isrealtime ? 1 : 0], barmerge.gaps_off, barmerge.lookahead_off) [barstate.isrealtime ? 0 : 1]


rsi1            = Fsec(syminfo.tickerid, rsiTf1, ta.rsi(rsiSrc, rsiLength))

rsi2            = Fsec(syminfo.tickerid, rsiTf2, ta.rsi(rsiSrc, rsiLength))

rsi3            = Fsec(syminfo.tickerid, rsiTf3, ta.rsi(rsiSrc, rsiLength))

rsi4            = Fsec(syminfo.tickerid, rsiTf4, ta.rsi(rsiSrc, rsiLength))

rsi5            = Fsec(syminfo.tickerid, rsiTf5, ta.rsi(rsiSrc, rsiLength))


//------------------------------------------------------------------------------

// RSI Overbought and Oversold detect


rsi1_Ob         = not rsiTf1_E or rsi1 >= rsiOverbought

rsi2_Ob         = not rsiTf2_E or rsi2 >= rsiOverbought

rsi3_Ob         = not rsiTf3_E or rsi3 >= rsiOverbought

rsi4_Ob         = not rsiTf4_E or rsi4 >= rsiOverbought

rsi5_Ob         = not rsiTf5_E or rsi5 >= rsiOverbought


rsi1_Os         = not rsiTf1_E or rsi1 <= rsiOversold

rsi2_Os         = not rsiTf2_E or rsi2 <= rsiOversold

rsi3_Os         = not rsiTf3_E or rsi3 <= rsiOversold

rsi4_Os         = not rsiTf4_E or rsi4 <= rsiOversold

rsi5_Os         = not rsiTf5_E or rsi5 <= rsiOversold


rsiOb           = rsi1_Ob and rsi2_Ob and rsi3_Ob and rsi4_Ob and rsi5_Ob

rsiOs           = rsi1_Os and rsi2_Os and rsi3_Os and rsi4_Os and rsi5_Os


//------------------------------------------------------------------------------

// Drawing on chart

plot    (rsiTf1_E ? rsi1 : na, title="TF 1",            color=color.rgb(255, 205, 22, 20),                                linewidth=1)

plot    (rsiTf2_E ? rsi2 : na, title="TF 2",            color=color.rgb(255, 22, 239, 20),                                linewidth=1)

plot    (rsiTf3_E ? rsi3 : na, title="TF 3",            color=color.rgb(38, 22, 255, 0),                                  linewidth=1)

plot    (rsiTf4_E ? rsi4 : na, title="TF 4",            color=color.rgb(123, 253, 22, 20),                                linewidth=1)

plot    (rsiTf5_E ? rsi5 : na, title="TF 5",            color=color.rgb(0, 255, 255, 50),                               linewidth=1)


strategy.entry("BUY", strategy.long, when=rsiOb)
strategy.entry("SELL", strategy.short, when=rsiOs)


//==============================================================================

//==============================================================================
관련
- MACD RSI 이치모쿠 모멘텀 트렌드
- RSI 방향 변경 전략
- 향상된 볼링거 밴드 RSI 거래 전략
- 중추 및 동력 전략
- 이동 평균 및 RSI 종합 거래 전략
- 토요일 전환 전략 (주말 필터)
- RSI/MACD/ATR과 함께 강화된 EMA 크로스오버 전략
- MACD와 RSI 결합된 장기 거래 전략
- RSI2 전략 내일 반전 승률 역시험
- 전략에 따른 다중 지표 트렌드
- AlphaTradingBot 거래 전략
더 많은
- EHMA 범위 전략
- 이동 평균 구매 판매
- 미다스 Mk. II - 최고의 암호화 스윙
- TMA-레거시
- TV의 높고 낮은 전략
- 가장 좋은 트레이딩 뷰 전략
- 빅 스냅퍼 경고 R3.0 + Chaiking 변동성 상태 + TP RSI
데 크롤 스톱 - CCI + EMA와 RSI 크로스 전략
- EMA 대역 + leledc + Bollinger 대역 트렌드 포스팅 전략
- MACD 위일리 전략
- RSI - 구매 판매 신호
- 하이킨-아시 추세
- HA 시장 편견
- 이치모쿠 클라우드 매끄러운 오시레이터
- 윌리엄스 %R - 부드럽다
- QQE MOD + SSL 하이브리드 + 와다 아타르 폭발
- Strat를 구매/판매
- EMA와 ADX와 함께 트리플 슈퍼트렌드
- 톰 데마크 연속 열 지도