트렌드 스칼프-프랙탈박스-3EMA
저자:차오장, 날짜: 2022-05-23 11:45:02태그:EMA
윌리엄의 프랙탈과 알리거터와 함께 많은 지표가 있습니다. 많은 사람들이 EMA를 사용하기 때문에 트렌드 스칼핑을 위해 3-EMA 리본을 정의하고 프랙탈 레벨 / 박스를 결합하는 것이 유용 할 수 있습니다. 나는 커뮤니티에서 이러한 유형의 지표를 검색했습니다. 일부는 프랙탈, 일부는 단지 레벨, 일부는 알리거터 등을 보여줍니다. 그러나 필요한 것을 찾을 수 없었습니다. 따라서 다른 사용자에게도 관심이있을 수있는이 지표를 생각했습니다.
핵심 요점:
EMA 리본은 3 개의 EMA 35/70/105를 사용하여 생성됩니다. 사용자는 선호도에 따라 변경할 수 있습니다. 이것은 트렌드 식별에 사용됩니다. 1. 가격 > EMA1 > EMA2 > EMA3 경우 상승 편향. 2. 가격 < EMA1 < EMA2 < EMA3 경우 하락 편향.
EMA1와 EMA2를 넘을 때 배경은 표시되어 트렌드 변경에 대한 경고가 됩니다.
5바 프랙탈은 프랙탈 레벨을 표시하는 데 사용되며 상위와 하위 프랙탈 사이의 배경은 프랙탈 상자를 만들기 위해 채워집니다.
프랙탈 레벨은 프랙탈 형성이 완료되었을 때만 표시됩니다. 오프셋이 사용되면 이것은 지연됩니다.
사용 방법:
기울기 EMA 리본은 트렌드를 식별하는 데 사용됩니다.
프랙탈 박스 브레이크아웃/브레이크다운은 엔트리/SL를 위해 프랙탈 하위/하위와 함께 거래를 촉발하는 데 사용됩니다. EMA 리본으로 향하는 가격 수축을 기다리는 것이 더 작은 박스로 이어지는 것이 거래를 시작하는 열쇠입니다. SL
면책: 이 지표는 교육적 참고를 위해만 만들어졌으며 투자 자문을 구성하지 않습니다. 이 지표는 실제 거래 결정을 내리기 전에 광범위한 독립적인 시장 연구를 대체할 수 있는 지표로 신뢰해서는 안됩니다. 시장 데이터 또는 다른 모든 내용은 알림 없이 언제든지 변경될 수 있습니다. 이 지표의 사용으로 인해 직접 또는 간접적으로 발생할 수 있는 손실 또는 손해에 대한 책임은 제한 없이 이 지표의 사용으로 인해 발생할 수 있는 모든 손실 또는 손해에 대한 책임은 그것을 사용하는 사용자의 책임입니다.
백테스트
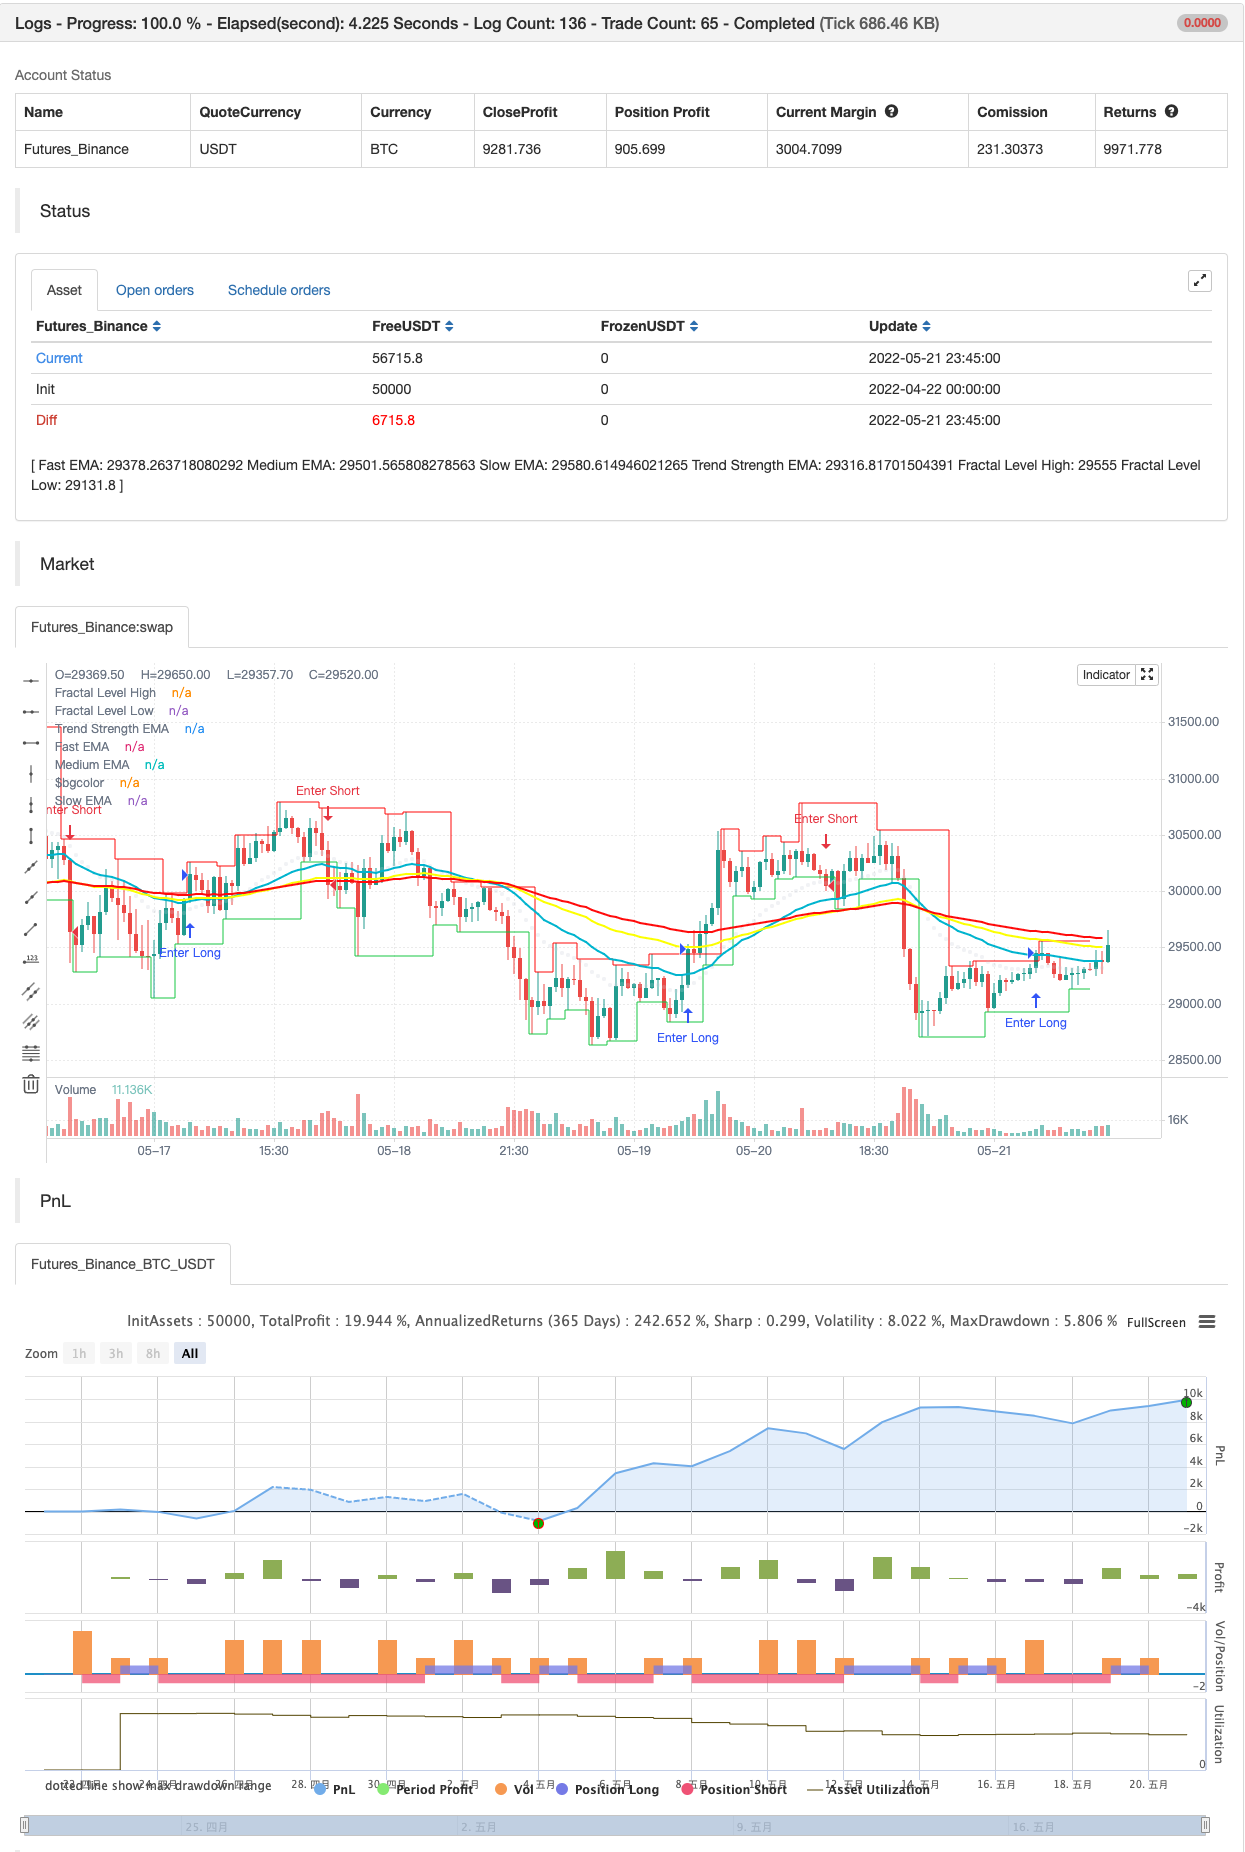
/*backtest
start: 2022-04-22 00:00:00
end: 2022-05-21 23:59:00
period: 45m
basePeriod: 5m
exchanges: [{"eid":"Futures_Binance","currency":"BTC_USDT"}]
*/

//@version=5

indicator('[VDB]TrendScalp-FractalBox-3EMA', shorttitle='[VDB]TS-FB-3EMA', overlay=true, max_lines_count=500)

// By: ©vireshdb/vdb/vdb007
//
//Description:
//          There are many indicators with William’s Fractal and Alligator. As many use EMA’s it may be useful to define an EMA ribbon and
//          combining Fractal levels/box (filling background between top and bottom fractals) for trend scalping. I searched for this kind of indicator in community – some show fractals,
//          some just levels, some with alligator etc.but couldn't find the one needed. Hence thought of this indicator which may be of interest to other users too.
//Key Points:
//          EMA ribbon is created using3 EMA’s 35/70/105. Users can change these as per their preference. This is used for trend identification –
//              1. Bullish bias if Price > EMA1 > EMA2 > EMA3. 2. Bearish bias if Price < EMA1 < EMA2 < EMA3.
//          Background is marked during crossing of EMA1 and EMA2 to alert possible change in trend.
//          5-bar fractals are used to mark the Fractal levels and backgrounds between top and bottom fractals are filled to create the Fractal Box.
//          Fractal levels are marked with offset 2 only when the fractal formation is complete and hence are lagging.
//How to Use:
//          Sloping EMA ribbon is used for identifying the trend.
//          Trend strength ema is enabled. Angle of 30degree and above is strength
//          Fractal box break-out/ break-downs are used to trigger the trade with fractal high/low for entry/stoploss.
//              - Waiting for price contraction towards EMA ribbon resulting in smaller boxes is key to initiate trade.
//              - Avoid bigger boxes as SL’s will be big and price may move within.
//              - To draw the vertical lines of FractalBox change fractal level0 style to stepline.
//          This indicator -
//              - Combined with the cycle/ banded indicators such as CCI/Stochastic/RSI etc can make it a good trend scalping setup
//              - While trading in the direction of momentum in higher timeframe.
// Reference : This indicator was achieved by combing some fractal ideas from "Fractal Framer by brobear"
//
// Copyright 2022 vireshdb
//
// This program is free software: you can redistribute it and/or modify
// it under the terms of the GNU General Public License as published by
// the Free Software Foundation, either version 3 of the License, or
// any later version.
//
// This program is distributed in the hope that it will be useful,
// but WITHOUT ANY WARRANTY; without even the implied warranty of
// MERCHANTABILITY or FITNESS FOR A PARTICULAR PURPOSE.  See the
// GNU General Public License for more details.
//
// The GNU General Public License can be found here
// <http://www.gnu.org/licenses/>.
//
// Start of code *************************************************************************************************

showema = input.bool(true, title='Show EMA Ribbon')
fastema = input.int(35, title='Fast EMA', minval=1)
medema = input.int(70, title='Medium EMA', minval=1)
slowema = input.int(105, title='Slow EMA', minval=1)
trstrema = input.int(20, title='Trend Strength EMA', minval=1)
EMA1 = ta.ema(close, fastema)
EMA2 = ta.ema(close, medema)
EMA3 = ta.ema(close, slowema)
TSEMA = ta.ema(close, trstrema)

plot(showema and fastema ? EMA1 : na, title='Fast EMA', color=color.new(#00bcd4, 0), linewidth=2)
plot(showema and medema ? EMA2 : na, title='Medium EMA', color=color.new(#fcff00, 0), linewidth=2)
plot(showema and slowema ? EMA3 : na, title='Slow EMA', color=color.new(#ff0909, 0), linewidth=2)
plot(showema and trstrema ? TSEMA : na, title='Trend Strength EMA', color=color.new(#d1d4dc, 75), linewidth=1, style=plot.style_circles)

bgcolor(color=ta.crossover(EMA1, EMA2) ? color.new(color.lime, 90) : ta.crossunder(EMA1, EMA2) ? color.new(color.red, 90) : na, title='Trend Marker')

// FRACTAL Levels and Box *******************************************************************************************
PlotFractLevel = input(defval=true, title='Show Fractal Levels and Box')
lnwidth = input.int(defval=1, title='Fractal Line Width', minval=1, maxval=3)

//----- Main ---------------------
fractLevelHigh = float(na)
fractLevelLow = float(na)
fractHigh = bool(na)
fractLow = bool(na)
lag = 0
lag := 2
fractHigh := high[4] <= high[2] and high[3] <= high[2] and high[2] > high[1] and high[2] > high ? true : false
fractLow := low[4] >= low[2] and low[3] >= low[2] and low[2] < low[1] and low[2] < low ? true : false

// Fractal levels
fractLevelHigh := fractHigh ? nz(high[lag], high) : nz(fractLevelHigh[1], high)
fractLevelLow := fractLow ? nz(low[lag], low) : nz(fractLevelLow[1], low)

//---- Plotting Fractal levels ---------------------
p1 = plot(PlotFractLevel ? fractLevelHigh : na, title='Fractal Level High', color=color.new(#ff0909, 0), linewidth=lnwidth, offset=-lag, style=plot.style_stepline)
p2 = plot(PlotFractLevel ? fractLevelLow : na, title='Fractal Level Low', color=color.new(#1bce4e, 0), linewidth=lnwidth, offset=-lag, style=plot.style_stepline)
fill(p1, p2, title='Fill Fractal Box', color=fractLevelHigh >= fractLevelLow ? color.new(#d1d4dc,90) : color.new(#fff59d, 90))

// Alert conditions
alertcondition(close > nz(fractLevelHigh, high), title='Above Fractal Level High', message='Fractal High Breakout')
alertcondition(close < nz(fractLevelLow, low), title='Below Fractal Level Low', message='Fractal Low Breakdown')

// End of FRACTAL Levels and Box ****************************************************************************************
// End of code***********************************************************************************************************

if close > nz(fractLevelHigh, high)
    strategy.entry("Enter Long", strategy.long)
else if close < nz(fractLevelLow, low)
    strategy.entry("Enter Short", strategy.short)
- 연속 MACD 금색과 죽음의 십자가에 기초한 거래 전략
- 향상된 볼링거 밴드 RSI 거래 전략
- 트리플 EMA 크로스오버 전략
- 기하급수적인 이동평균 크로스오버 레버리지 전략
- GM-8 & ADX 이중 이동 평균 전략
- RSI/MACD/ATR과 함께 강화된 EMA 크로스오버 전략
- Z-Score 트렌드 전략
- EMA의 긴 입장은 위험 관리 전략과 교차합니다
- VWAP 거래 전략
- 웨이브 트렌드 크로스 레이지 베어 전략
- AlphaTradingBot 거래 전략
- MACD 재충전 전략
- 슈퍼트렌드 이동 평균
- 거래 ABC
- 15MIN BTCUSDTPERP BOT
논 엔트로피 V2 - 수퍼트렌드 ATR TRAILING STOP LOSS
- 부피 흐름 v3
- ma & rsi - ogcheckers와 함께 암호화 선물 시간 스칼핑
- ATR 평평화
- 주문 블록 검색어
- QQE 신호
- U비트 격자 팽창 필터링
- CM MACD 사용자 지정 지표 - 여러 시간 프레임 - V2
- HODL 라인
- 2 이동 평균 색 방향 탐지
- Scalping PullBack 도구 R1
- 매수 전략은 AO+Stoch+RSI+ATR에 달려 있습니다.
- EMA 트렌드 클라우드
- RedK 부피 가속 방향 에너지 비율
- 돈치안 브레이크아웃