모멘텀 아비트라지 전략의 백테스팅 분석

1 전략 이름
이 전략의 주요 특징에 따라, 저는 이것을 '<unk>동량배당 전략'이라고 이름 붙일 것입니다.
2 전략 개요
이 전략은 Chande의 동력 흔들림 지표를 계산하고 상하의 하위치를 설정하여 다공간 신호를 구축하여 중개 기회를 형성하여 수익을 창출합니다.
세번째, 전략적 원칙
코드는 먼저 변수 Length, TopBand, LowBand를 설정합니다. Length는 계산 동력의 수일 주기, TopBand와 LowBand는 설정된 상하의 <unk>값을 나타냅니다.
그리고는 가장 최근의 <unk>트날의 절대 이동량을 xMom로 계산하고, <unk>트날의 간단한 이동 평균 xSMA_mom을 계산한다.
그 다음으로 <unk>스 (Length) 의 하루 동안의 누적 운동 xMomLength를 계산한다.
다음으로 동력 흔들림 지표 nRes를 계산하여 xMomLength를 xSMA_mom으로 나누고 그 다음에 Length를 곱하여 100배 확대한다.
nRes와 상하 임계 값의 크기와의 관계에 따라 다공방향을 판단하고, pos에 저장한다.
최종적으로 역거래 수정pos가 활성화되었는지 여부에 따라 거래 신호 possig을 생성하여 다공백 엔트리를 생성한다.
네, 전략적 장점
- 동력 지표를 사용하여 트렌드의 잠재적인 전환점을 식별하여 트렌드를 잡는 데 도움이됩니다.
- <unk>값 필터링과 함께 명확한 다공간 신호를 형성하여 잘못된 거래를 방지합니다.
- 역전 거래에 대한 아이디어를 적용하여 역전 기회를 얻을 수 있습니다.
- 매개 변수는 공간적으로 크게 조정할 수 있으며, 다른 품종, 주기에 대해 최적화할 수 있습니다.
- 시각화 파라미터가 직관적이어서 거래 논리를 쉽게 이해할 수 있습니다.
다섯째, 전략적 위험
- 동력 요소만 고려하면 다른 기술 지표가 형성하는 거래 기회를 놓칠 수 있습니다.
- 동력 돌파는 반드시 트렌드 전환을 의미하지 않으며, 잘못된 판단의 위험이 있습니다.
- 역거래는 수익을 창출할 수 있지만 손실을 증가시킬 수 있습니다.
- 잘못된 변수 최적화는 너무 자주 거래하거나 최적의 지점을 놓치게 할 수 있습니다.
- 갑작스러운 사건으로 인한 단기 동력 변증에 대한 적절한 필터링
트렌드, 변동률과 같은 다른 기술 지표와 결합하여 동력 신호의 신뢰성을 확인하고, 변수를 조정하여 거래 빈도를 낮추고, 적절히 느슨한 스톱 손실 지점 등을 통해 위험을 제어 할 수 있습니다.
6 전략적 최적화
- 다른 기술 지표 필터링을 추가하여 거래 신호의 정확도를 향상시킵니다.
동력 신호가 발동되기 전에, 종전 가격이 평행선 시스템의 위에 있는지, 또는 변동률이 정상적인 범위 안에 있는지 판단할 수 있으며, 오해를 피한다.
- 품종 특성에 따라 최적화 매개 변수
변동률이 높은 품종은 변동량 변동의 정상적인 경계가 적절히 확장되어 거래 빈도를 줄일 수 있다.
- 다른 시간 주기에 따라 여러 시간 프레임의 최적화
낮에는 더 작은 주기적인 Length를 사용하여 초단계 거래를 할 수 있습니다. 주선이나 달선에 따라 파라미터를 조정하여 중장선 트렌드에 초점을 맞추십시오.
- 조건에서 벗어난 바닥을 설정합니다.
시조 신호가 발동될 때, 이전 파도보다 높은 가격 조건이 추가되어 트렌드 반전의 가짜 신호를 피해야 한다.
VII. 결론
이 전략은 주로 동력 지표를 통해 단기 트렌드 반전 기회를 식별하고, 변수 필터링과 결합하여 거래 신호를 생성하며, 트렌드 추적과 반전 캡처를 병행하며, 위험을 제어할 수 있다. 여러 시간 프레임을 최적화하고 다른 기술 지표를 조합하여 전략 거래 효과를 향상시킬 수 있으며, 추가 연구 및 응용에 가치가 있다.
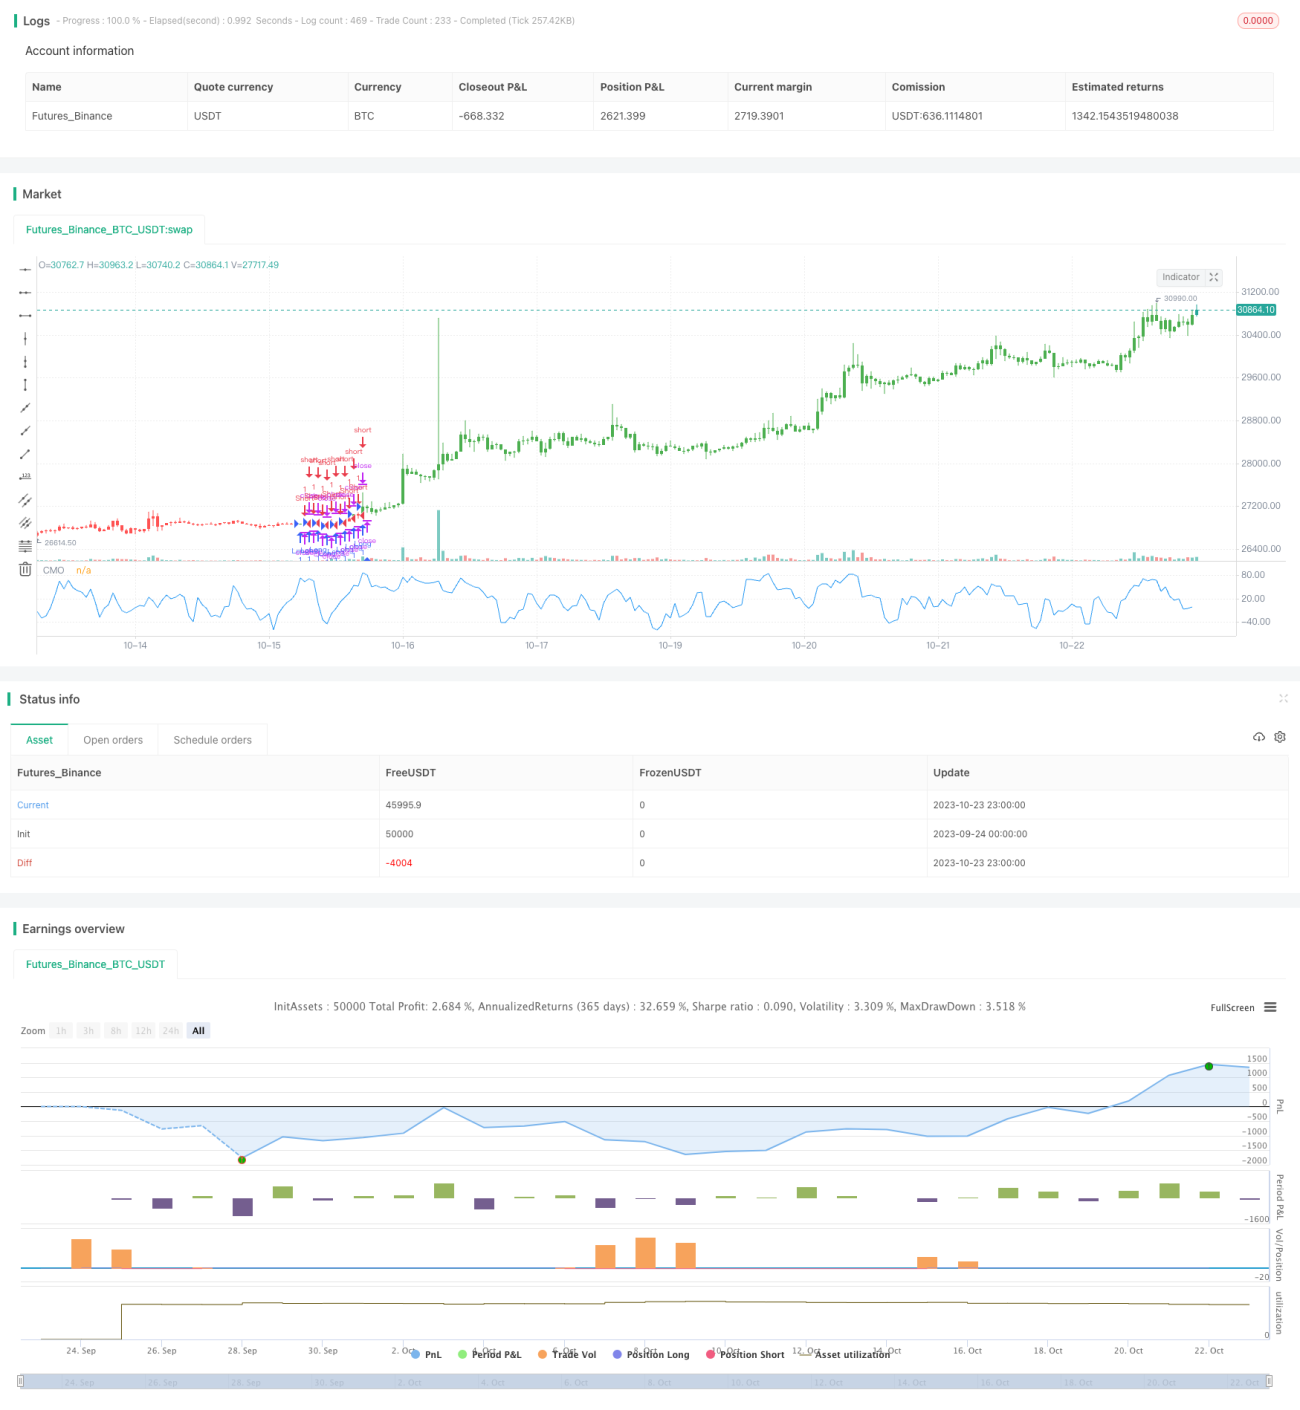
/*backtest
start: 2023-09-24 00:00:00
end: 2023-10-24 00:00:00
period: 1h
basePeriod: 15m
exchanges: [{"eid":"Futures_Binance","currency":"BTC_USDT"}]
*/

//@version=2
////////////////////////////////////////////////////////////
//  Copyright by HPotter v1.0 07/02/2017
// This indicator plots Chande Momentum Oscillator. This indicator was - 1