다차원 지표 의사결정을 기반으로 한 단기 추세 전략


생성 날짜: 2023-10-25 15:31:30 마지막으로 수정됨: 2023-10-25 15:31:30
복사: 0 클릭수: 615
avatar of ChaoZhang ChaoZhang
1
집중하다
1617
수행원

다차원 지표 의사결정을 기반으로 한 단기 추세 전략

개요

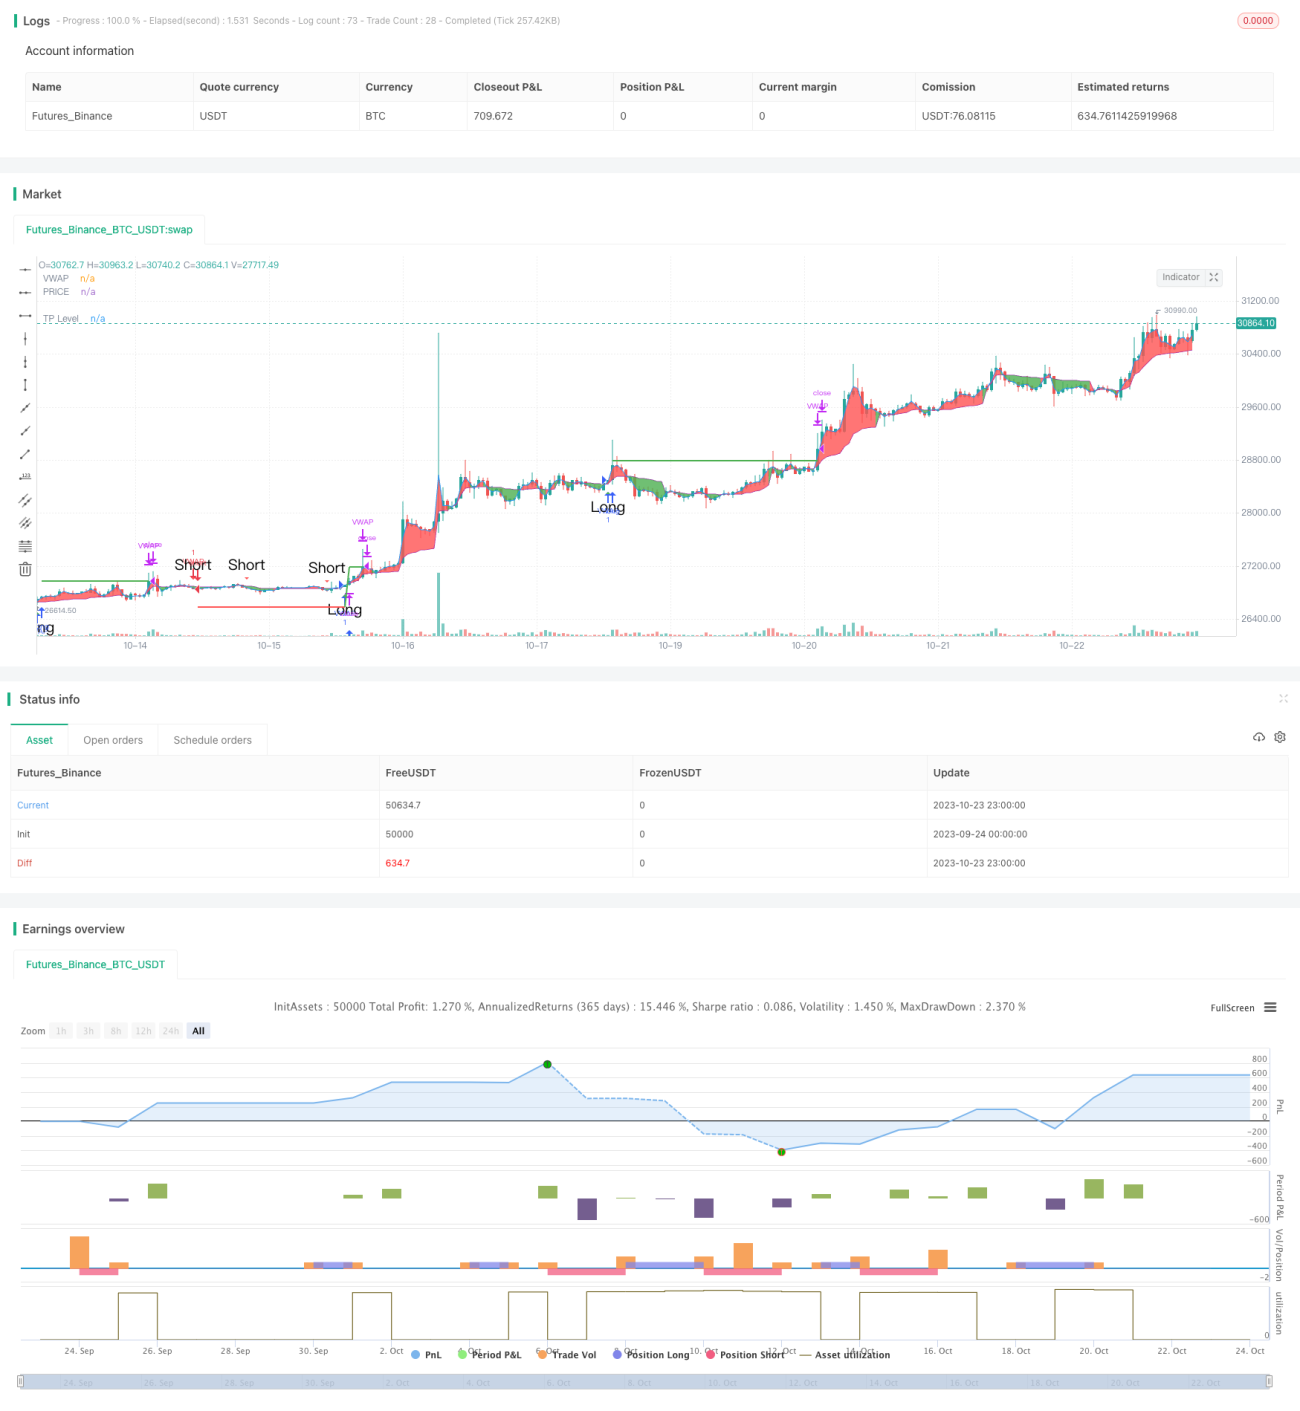
이 전략은 세 가지 다른 차원의 기술 지표를 결합합니다. 그것은 저항 지점을 지원하고, 평균 선 시스템과 과잉 구매 과잉 판매 지표입니다.

전략 원칙

코드는 먼저 표준 진동축과 피보나치 지지 저항을 포함한 가격의 지지 저항 지점을 계산하고 차트에 그려집니다. 가격이 이러한 중요한 지점을 돌파 할 때 중요한 트렌드 신호로 간주됩니다.

그리고는 중도 이동 평균 VWAP와 평균값을 계산하여 그들의 황금십자과 사각지대 신호를 판단한다. 이것은 중장기 경향 판단에 속한다.

마지막으로 Stochastic RSI를 계산하여, 그 골드 크로스 및 데드 포크 신호를 판단하여, 과매매 과매매 지표에 속한다.

이 세 차원의 지표를 통합하면, 지지부진, VWAP 평균선, Stochastic RSI가 동시에 구매 신호를 발신하면 더 많은 주문을 열고, 세 명이 동시에 판매 신호를 발신하면 공명 주문을 열습니다.

우위 분석

이 전략의 가장 큰 장점은 3개의 다른 차원의 지표를 결합하여 판단을 더 포괄적으로 정확하고 승률이 높다는 것입니다. 먼저 저항 지점을 판단하여 큰 추세를 결정합니다. 그 다음에는 VWAP 판단하여 중간 긴 선의 추세를 결정합니다. 마지막으로 Stochastic RSI 판단하여 과매매 과매매 상황을 결정합니다. 3차원 지표는 동시에 신호를 발산하여 가짜 신호를 크게 필터링하여 진입의 성공률을 향상시킬 수 있습니다.

또한, 전략에는 금고 기능이 추가되어 수익의 일정한 비율을 고정시킬 수 있으며, 이는 자금 관리에 도움이 된다.

위험 분석

이 전략의 주요 위험은 다공간 의사결정은 지표에 의존하여 동시 신호를 발송하는 데 있습니다. 일부 지표가 잘못된 신호를 발송하면 의사결정 오류가 발생할 수 있습니다. 예를 들어, Stochastic RSI는 과매매 신호를 발송하지만, VWAP 및 지원 저항 판단은 여전히 낙관적입니다.

또한, 지표 파라미터를 잘못 설정하면 신호 판단 오류가 발생할 수 있으며, 반복적으로 재검토를 통해 최적의 파라미터를 찾아내야 한다.

또한, 주식 시장은 단기간에 종종 블랙 스윙 사건이 발생하여 지표의 실패로 이어진다. 이러한 위험을 방지하기 위해, 단독 손실이 너무 커지는 것을 방지하기 위해, 손해 방지 전략에 참여할 수 있다.

최적화 방향

이 전략은 다음의 몇 가지 측면에서 계속 개선될 수 있습니다.

  1. 트렌드 강점과 약점을 판단하고 의사 결정의 정확성을 높이기 위해 트랜드량 지표와 같은 더 많은 지표 신호를 추가하십시오.

  2. 기계 학습 모형을 추가하여 다차원 지표에 대한 훈련을 수행하고 최적의 거래 전략을 자동으로 찾습니다.

  3. 다양한 품종의 파라미터에 따라 최적화하고, 적응 파라미터를 설정한다.

  4. 손실을 막는 전략을 강화하고, 리스크를 더 잘 통제하는 것은 리드위치의 크기에 따라 통제된다.

  5. 포트폴리지를 최적화하고, 포트폴리지를 위해 연관성이 낮은 품종을 찾고, 포트폴리지를 철회하는 것을 줄인다.

요약하다

이 전략은 전체적으로 단기 트렌드 거래에 매우 적합하다. 그것은 다차원 지표를 사용하여 결정을 내리고, 많은 잡음을 필터링 할 수 있으며, 승률이 높다. 그러나 지표가 잘못된 신호를 보내는 위험을 주의해야하며, 계속 최적화하면 이 전략은 효율적이고 안정적인 단선 전략이 될 수 있다.

전략 소스 코드
/*backtest
start: 2023-09-24 00:00:00
end: 2023-10-24 00:00:00
period: 1h
basePeriod: 15m
exchanges: [{"eid":"Futures_Binance","currency":"BTC_USDT"}]
*/

// EmperorBTC's VWAP Indicator & Strategy
//              v2.1
// 
//      coded by Bogdan Vaida

// This indicator was created after EmperorBTC's conditions on Twitter. 
// Good timeframes for it: 30', 15', 5'
// To convert from strategy to study switch the commented lines in the beginning
// and at the end of the script and vice versa.

// What this indicator does is to check if:
// o Pivot Point was crossed
// o Stoch-RSI and VWAP were crossed in current or previous candle
// o Candle (or previous candle) close is in the trend direction
// If all these are true then it will go long or short based on direction.


// FUTURE IDEAS: 
//  - Volume Expansion
//  - Candle Stick patterns

//@version=4

// 🔥Uncomment the line below for the indicator and comment the strategy lines
// study(title="EmperorBTC's VWAP Indicator", shorttitle="EMP-VWAP", overlay=true)

// 🔥 Uncomment the line below for the strategy and comment the above line
strategy(title="EmperorBTC's VWAP Strategy", shorttitle="EMP-VWAP", overlay=true, pyramiding=1)

plotAveragePriceCrossedPivotPoint = input(false, title="Plot Close Price Crossing Pivot Points?", group="Pivot Points")
plotPivotPoints = input(false, title="Plot Pivot Points?", group="Pivot Points")
pivotPointsType = input(title="Pivot Points type", defval="Fibonacci", options=["Fibonacci", "Traditional"], group="Pivot Points")

pivotPointCircleWidth = input(2, title="Width of Pivot Point circles", minval=1, group="Pivot Points")

plotVWAP = input(true, title="Plot VWAP?", group="VWAP")
plotAvgPrice = input(true, title="Plot Average Price?", group="VWAP")
plotVWAPCrossPrice = input(false, title="Plot Price Crossing VWAP?", group="VWAP")
reso = input(title="Period", type=input.resolution, defval="D", group="VWAP")
cumulativePeriod = input(14, "VWAP Cumulative Period", group="VWAP")

plotStochRSICross = input(false, title="Plot StochRSI Cross?", group="StochRSI")
smoothK = input(3, "K", minval=1, group="StochRSI", inline="K&D")
smoothD = input(3, "D", minval=1, group="StochRSI", inline="K&D")
lengthRSI = input(14, "RSI Length", minval=1, group="Stochastic-RSI", inline="length")
lengthStoch = input(14, "Stochastic Length", minval=1, group="Stochastic-RSI", inline="length")
rsiSrc = input(close, title="RSI Source", group="Stochastic-RSI")

plotLong = input(true, title="Plot Long Opportunity?", group="Strategy only")
plotShort = input(true, title="Plot Short Opportunity?", group="Strategy only")
tradingDirection = input(title="Strategy trading Direction: ", defval="L&S", options=["L&S", "L", "S"], group="Strategy only")
takeProfit = input(1.0, title='Take Profit %', group="Strategy only") / 100
plotTP = input(true, title="Plot Take Profit?", group="Strategy only")
startDate = input(title="Start Date", type=input.integer,
     defval=1, minval=1, maxval=31, group="Backtesting range", inline="Start Date")
startMonth = input(title="Start Month", type=input.integer,
     defval=1, minval=1, maxval=12, group="Backtesting range", inline="Start Date")
startYear = input(title="Start Year", type=input.integer,
     defval=2017, minval=1800, maxval=2100, group="Backtesting range", inline="Start Date")
endDate = input(title="End Date", type=input.integer,
     defval=31, minval=1, maxval=31, group="Backtesting range", inline="End Date")
endMonth = input(title="End Month", type=input.integer,
     defval=12, minval=1, maxval=12, group="Backtesting range", inline="End Date")
endYear = input(title="End Year", type=input.integer,
     defval=2050, minval=1800, maxval=2100, group="Backtesting range", inline="End Date")


// PivotPoint code (PVTvX by DGT has some nice code on PP)
candleHigh  = security(syminfo.tickerid,"D", high[1], lookahead=barmerge.lookahead_on)
candleLow   = security(syminfo.tickerid,"D", low[1], lookahead=barmerge.lookahead_on)
candleClose = security(syminfo.tickerid,"D", close[1], lookahead=barmerge.lookahead_on)

pivotPoint = (candleHigh+candleLow+candleClose) / 3

float resistance1 = na
float resistance2 = na
float resistance3 = na
float support1 = na
float support2 = na
float support3 = na

if pivotPointsType == "Fibonacci"
    resistance1 := pivotPoint + 0.382 * (candleHigh - candleLow)
    resistance2 := pivotPoint + 0.618 * (candleHigh - candleLow)
    resistance3 := pivotPoint + (candleHigh - candleLow)
    support1 := pivotPoint - 0.382 * (candleHigh - candleLow)
    support2 := pivotPoint - 0.618 * (candleHigh - candleLow)
    support3 := pivotPoint - (candleHigh - candleLow)
else if pivotPointsType == "Traditional"
    resistance1 := 2 * pivotPoint - candleLow
    resistance2 := pivotPoint + (candleHigh - candleLow)
    resistance3 := candleHigh + 2 * (pivotPoint - candleLow) 
    support1 := 2 * pivotPoint - candleHigh
    support2 := pivotPoint - (candleHigh - candleLow)
    support3 := candleLow - 2 * (candleHigh - pivotPoint)

plot(series = plotPivotPoints ? support1 : na, color=#ff0000, title="S1", style = plot.style_circles, linewidth = pivotPointCircleWidth)
plot(series = plotPivotPoints ? support2 : na, color=#800000, title="S2", style = plot.style_circles, linewidth = pivotPointCircleWidth)
plot(series = plotPivotPoints ? support3 : na, color=#330000, title="S3", style = plot.style_circles, linewidth = pivotPointCircleWidth)
plot(series = plotPivotPoints ? pivotPoint : na, color=#FFA500, title="PP", style = plot.style_circles, linewidth = pivotPointCircleWidth)
plot(series = plotPivotPoints ? resistance1 : na, color=#00FF00, title="R1", style = plot.style_circles, linewidth = pivotPointCircleWidth)
plot(series = plotPivotPoints ? resistance2 : na, color=#008000, title="R2", style = plot.style_circles, linewidth = pivotPointCircleWidth)
plot(series = plotPivotPoints ? resistance3 : na, color=#003300, title="R3", style = plot.style_circles, linewidth = pivotPointCircleWidth)

pivotPointCrossedUp = ((low < support3) and (close > support3)) or ((low < support2) and (close > support2)) or ((low < support1) and (close > support1)) or  ((low < pivotPoint) and (close > pivotPoint))
pivotPointCrossedDown = ((high > support3) and (close < support3)) or ((high > support2) and (close < support2)) or ((high > support1) and (close < support1)) or  ((high > pivotPoint) and (close < pivotPoint))
plotPPColor = pivotPointCrossedUp ? color.green :
     pivotPointCrossedDown ? color.red :
     na

plotshape(series = plotAveragePriceCrossedPivotPoint ? (pivotPointCrossedUp or pivotPointCrossedDown) : na, title="PP Cross", style = shape.triangleup, location=location.belowbar, color=plotPPColor, text="PP", size=size.small)

// VWAP (taken from the TV code)
// There are five steps in calculating VWAP:
//
// 1. Calculate the Typical Price for the period. [(High + Low + Close)/3)]
// 2. Multiply the Typical Price by the period Volume (Typical Price x Volume)
// 3. Create a Cumulative Total of Typical Price. Cumulative(Typical Price x Volume)
// 4. Create a Cumulative Total of Volume. Cumulative(Volume)
// 5. Divide the Cumulative Totals. 
//
// VWAP = Cumulative(Typical Price x Volume) / Cumulative(Volume)

// Emperor's Edition
t = time(reso)
debut = na(t[1]) or t > t[1]

addsource = ohlc4 * volume
addvol = volume
addsource := debut ? addsource : addsource + addsource[1]
addvol := debut ? addvol : addvol + addvol[1]
vwapValue = addsource / addvol

pVWAP = plot(series = plotVWAP ? vwapValue : na, color=color.purple, title="VWAP")
pAvgPrice = plot(series = plotAvgPrice ? ohlc4 : na, color=color.blue, title="PRICE")
fill(pVWAP, pAvgPrice, color = ohlc4 > vwapValue ? color.red : color.green, title="VWAP PRICE FILL")

vwapCrossUp = (low < vwapValue) and (vwapValue < high) and (close > open) // added green candle check
vwapCrossDown = (high > vwapValue) and (vwapValue > low) and (close < open) // added red candle check

plotVWAPColor = vwapCrossUp ? color.green :
     vwapCrossDown ? color.red :
     na
plotshape(series = plotVWAPCrossPrice ? (vwapCrossUp or vwapCrossDown) : na, title="VWAP Cross Price", style=shape.triangleup, location=location.belowbar, color=plotVWAPColor, text="VWAP", size=size.small)


// Stochastic RSI

rsi1 = rsi(rsiSrc, lengthRSI)
k = sma(stoch(rsi1, rsi1, rsi1, lengthStoch), smoothK)
d = sma(k, smoothD)

sRsiCrossUp = k[1] < d[1] and k > d
sRsiCrossDown = k[1] > d[1] and k < d

plotColor = sRsiCrossUp ? color.green :
     sRsiCrossDown ? color.red :
     na
plotshape(series = plotStochRSICross ? (sRsiCrossUp or sRsiCrossDown) : na, title="StochRSI Cross Up", style=shape.triangleup, location=location.belowbar, color=plotColor, text="StochRSI", size=size.small)

// Long Trades
sRsiCrossedUp = sRsiCrossUp or sRsiCrossUp[1]
vwapCrossedUp = vwapCrossUp or vwapCrossUp[1]
// longCond1 = (sRsiCross and vwapCross) or (sRsiCross[1] and vwapCross) or (sRsiCross and vwapCross[1])
longCond1 = (sRsiCrossedUp[1] and vwapCrossedUp[1])
longCond2 = pivotPointCrossedUp[1]
longCond3 = (close[1] > open[1]) and (close > open) // check this
longCond = longCond1 and longCond2 and longCond3
plotshape(series = plotLong ? longCond : na, title="Long", style=shape.triangleup, location=location.belowbar, color=color.green, text="Long", size=size.normal)

// Short Trades
sRsiCrossedDown = sRsiCrossDown or sRsiCrossDown[1]
vwapCrossedDown = vwapCrossDown or vwapCrossDown[1]
shortCond1 = (sRsiCrossedDown[1] and vwapCrossedDown[1])
shortCond2 = pivotPointCrossedDown[1]
shortCond3 = (close[1] < open[1]) and (close < open)
shortCond = shortCond1 and shortCond2 and shortCond3
plotshape(series = plotShort ? shortCond : na, title="Short", style=shape.triangledown, location=location.abovebar, color=color.red, text="Short", size=size.normal)

// alertcondition(condition=longCond, title="Long", message="Going long")
// alertcondition(condition=shortCond, title="Short", message="Going short")

// 🔥 Uncomment the lines below for the strategy and revert for the study
takeProfitLong     = strategy.position_avg_price * (1 + takeProfit)
takeProfitShort     = strategy.position_avg_price * (1 - takeProfit)
exitTp = ((strategy.position_size > 0) and (close > takeProfitLong)) or ((strategy.position_size < 0) and (close < takeProfitShort))
strategy.risk.allow_entry_in(tradingDirection == "L" ? strategy.direction.long : tradingDirection == "S" ? strategy.direction.short : strategy.direction.all)
plot(series = (plotTP and strategy.position_size > 0) ? takeProfitLong : na, title="TP Level",color=color.green, style=plot.style_linebr, linewidth=2)
plot(series = (plotTP and strategy.position_size < 0) ? takeProfitShort : na, title="TP Level",color=color.red, style=plot.style_linebr, linewidth=2)
inDateRange = (time >= timestamp(syminfo.timezone, startYear,
         startMonth, startDate, 0, 0)) and (time < timestamp(syminfo.timezone, endYear, endMonth, endDate, 0, 0))
strategy.entry("VWAP", strategy.long, comment="Long", when=longCond and inDateRange)
strategy.entry("VWAP", strategy.short, comment="Short", when=shortCond and inDateRange)
strategy.close(id="VWAP", when=exitTp)
if (not inDateRange)
    strategy.close_all()