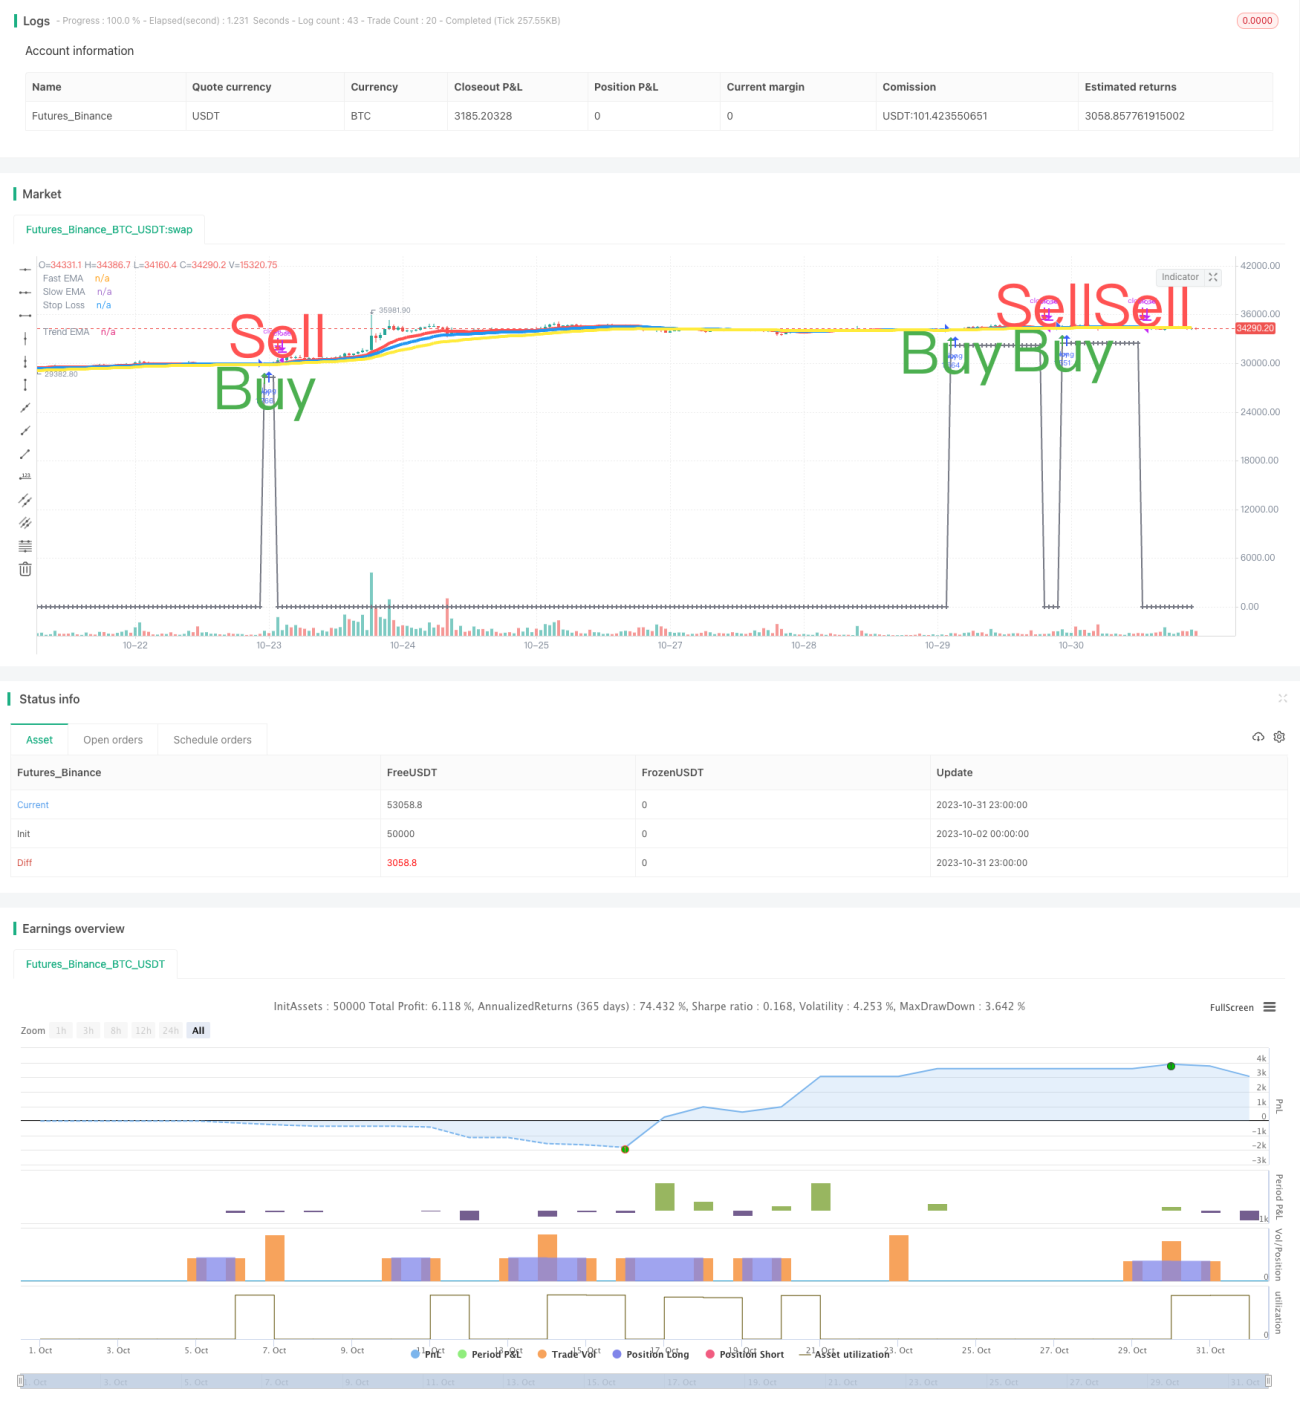
이중 압력 양적 거래 전략

저자:차오장, 날짜: 2023-11-02 13:56:23
태그:

img

전반적인 설명

이중 압력 양적 거래 전략은 스토카스틱 및 볼륨 지표를 결합한 트렌드 다음 전략입니다. 주로 스토카스틱 K 및 D 라인을 볼륨 지표와 함께 구매 및 판매 신호를 생성하기 위해 사용합니다. 추가 신호를위한 이동 평균 교차로 보완됩니다.

전략 논리

구매 신호

주요 구매 신호는 다음과 같이 발생합니다.

  1. 두 K와 D 라인은 과반 판매 영역 (예를 들어 20) 아래를 넘어서서 올라가고 K와 D 모두 상승합니다.

  2. 부피가 한 임계치를 초과합니다 (예를 들어 평균 부피의 1.4배)

  3. 닫는 것은 열기보다 높습니다 (하얀 )

추가 구매 신호는 다음과 같이 나타날 수 있습니다.

  1. 금색 십자: 빠른 EMA는 느린 EMA를 넘고, 둘 다 상승합니다.

  2. K와 D 모두 낮은 영역에서 중간 영역으로 상승합니다 (예: 20 이하에서 20-80까지)

판매 신호

주요 판매 신호는 다음과 같이 발생합니다.

  1. K와 D 모두 과잉 매수 영역 (예를 들어 80 이상) 에 들어가

  2. 죽음의 교차: 빠른 EMA는 느린 EMA 아래로 교차

  3. K는 D 아래로 넘어가고 K와 D는 모두 떨어지고 있습니다.

손실 중지

구매 가격 아래의 비율 (예: 6%) 는 스톱 로스 수준으로 설정됩니다. 이보다 낮아지면 스톱 로스가 발생합니다.

이점 분석

  • 이중 스토카스틱은 잘못된 신호를 피합니다.
  • 부피는 소음을 필터하고 트렌드를 보장합니다.
  • 여러 신호가 결합되어 정확도를 향상시킵니다.
  • 이동 평균은 전체 추세를 지원합니다
  • 스톱 로스 리스크 제어

장점 1: 이중 스토카스틱은 잘못된 신호를 피합니다.

단일 스토카스틱은 많은 잘못된 신호를 생성할 수 있습니다. 이중 스토카스틱 조합은 잘못된 신호를 필터링하고 신뢰성을 향상시킵니다.

장점 2: 부피 는 소음 을 필터 하고 경향 을 보장 한다

부피 조건은 낮은 부피의 트렌드가 아닌 지점을 필터링하고 갇히는 위험을 줄입니다.

장점 3: 여러 신호 를 통해 정확성 을 향상 시킨다

실제 거래 신호를 유발하기 위해 여러 지표가 정렬되어야합니다. 이것은 신호 신뢰성을 향상시킵니다.

장점 4: 이동 평균 은 전체 추세 를 지원 한다

이중 이동 평균과 같은 규칙은 신호가 전체 트렌드와 일치하도록 보장합니다. 이것은 역 트렌드 거래를 피합니다.

장점 5: 스톱 로스 위험 조절

스톱 로스 로직은 수익을 실현하고 단일 트레이드에서 손실을 제어합니다.

위험 분석

  • 매개 변수는 신중한 최적화가 필요합니다, 잘못된 설정은 낮은 성능으로 이어집니다
  • 스톱 로스 투입은 격차 위험을 고려해야 합니다.
  • 거래 상품에 대한 유동성 위험은 모니터링되어야 합니다.
  • 서로 다른 시간 프레임 사이의 룩백 문제

위험 1: 매개 변수 를 신중 하게 최적화 해야 한다

전략은 여러 매개 변수를 가지고 있습니다. 다른 도구에 최적화가 필요합니다. 그렇지 않으면 성능이 떨어집니다.

리스크 2: 스톱 로스 투입은 격차 리스크를 고려해야 합니다.

스톱 로즈 포인트는 가격 격차 시나리오를 고려해야 합니다. 구매 가격에 너무 가깝지 않아야 합니다.

리스크 3: 유동성 리스크를 모니터링합니다.

유동성 없는 도구의 경우, 볼륨 규칙은 너무 많은 신호를 필터할 수 있습니다. 볼륨 문턱은 완화되어야 합니다.

위험 4: 시간 프레임 간 회상 문제

다른 시간 프레임에서 신호의 오차가 발생할 수 있습니다. 신호의 일치가 확인되어야합니다.

더 나은 기회

이 전략은 다음과 같은 분야에서 강화될 수 있습니다.

  1. 견고성을 위한 매개 변수를 최적화

  2. 적응 매개 변수를 위한 기계 학습을 도입

  3. 스톱 로스 비율을 줄이기 위해 스톱 로스 전략을 개선

  4. 거래 빈도를 줄이기 위해 필터를 추가합니다.

  5. 조건부 명령이나 수익을 취하여 보상을 개선하는 방법을 탐구합니다.

기회 1: 견고성 을 위한 매개 변수를 최적화 한다

유전 알고리즘과 같은 방법은 시장 체제에서 안정성을 위한 매개 변수를 체계적으로 최적화할 수 있습니다.

기회 2: 적응 매개 변수를 위한 기계 학습을 도입

모델은 시장 조건을 평가하고 그에 따라 매개 변수를 조정하여 동적 최적화를 달성 할 수 있습니다.

기회 3: 스톱 로스 비율을 줄이기 위해 스톱 로스 전략을 개선

더 나은 스톱 로스 알고리즘은 위험 통제를 유지하면서 불필요한 스톱을 줄일 수 있습니다.

기회 4: 거래 빈도를 줄이기 위해 필터를 추가합니다.

필터를 강화하면 거래 빈도를 줄이고 비용을 낮추고 거래 수익을 향상시킬 수 있습니다.

기회 5: 조건부 주문 또는 수익 취득을 탐구하십시오.

시장 조건에 따라 조건부 주문이나 수익 취득 전략은 위험을 통제하면서 수익을 극대화 할 수 있습니다.

결론

이 전략은 트렌드, 리스크 제어, 비용 및 기타 측면을 균형 잡는다. 핵심 장점은 트렌드 및 리스크 제어에 대한 스토카스틱 플러스 볼륨과 스톱 로스입니다. 다음 단계는 안정성, 적응 매개 변수, 스톱 로스 최적화 등을 강화하여 더 많은 시장 체제에서 안정적인 수익을 창출하는 것입니다.


/*backtest
start: 2023-10-02 00:00:00
end: 2023-11-01 00:00:00
period: 1h
basePeriod: 15m
exchanges: [{"eid":"Futures_Binance","currency":"BTC_USDT"}]
*/

//@version=3
// SW SVE - Stochastic+Vol+EMAs [Sergio Waldoke]
// Script created by Sergio Waldoke (BETA VERSION v0.5, fine tuning PENDING)
// Stochastic process is the main source of signals, reinforced on buying by Volume. Also by Golden Cross.
// Selling is determined by K and D entering overselling zone or EMA's Death Cross signal, the first occurring,
// and some other signals combined.
// Buy Long when you see a long buy arrow.
// Sell when you see a close arrow.
// This is a version to be tuned and improved, but already showing excelent results after tune some parameters
// according to the kind of market.
// Strategy ready for doing backtests.

// SVE SYSTEM DESIGN:
// Buy Signal Trigger:
// - Both Stoch <= 20 crossing up and both growing and green candle and Vol/sma vol >= 1.40 Avg Vol
//   or
// - Both Stoch growing up and Vol/sma vol >= 1.40 Avg Vol and green candle and
//   both prior Stoch crossing up
//   or
//   [OPTIONAL]: (Bad for BTC 2018, excelent for 2017)
// - Crossingover(fast_ema, slow_ema) and growing(fast_ema) and growing(slow_ema) and green candle

// Exit position:
// - Both Stoch <= 20 and Both Stoch were > 20 during position
//   or
// - CrossingUnder(Fast EMA, Medium EMA)
//   or   [OPTIONAL] (Better for BTC 2018, Worse for BNB 1H)
// - CrossingUnder(k, d) and (k and d starting over over_buying) and (k and d descending) and k crossing down over_buying line

//calc_on_every_tick=true,
//calc_on_order_fills=true,   (affects historical calculation, triggers in middle of the bar, may be better for automatic orders)
strategy("SW SVE - Stochastic+Vol+EMAs [Sergio Waldoke]", shorttitle="SW SVE", overlay=true, max_bars_back=5000,
         default_qty_type=strategy.percent_of_equity, default_qty_value=100, currency="USD",
         commission_type=strategy.commission.percent, commission_value=0.25)

//Strategy Parameters
FromDay   = input(defval = 1, title = "From Day", minval = 1, maxval = 31)
FromMonth = input(defval = 1, title = "From Month", minval = 1, maxval = 12)
FromYear  = input(defval = 2018, title = "From Year", minval = 2009, maxval = 2200)
ToDay     = input(defval = 31, title = "To Day", minval = 1, maxval = 31)
ToMonth   = input(defval = 12, title = "To Month", minval = 1, maxval = 12)
ToYear    = input(defval = 2030, title = "To Year", minval = 2009, maxval = 2200)

//Indicator Parameters
//Original defaults for 4HS: 14, 3, 80, 20,   14, 23, 40,   20, 40,   3:
stoch_k = input(title="Stoch K",  defval=14, minval=1)
stoch_d = input(title="Stoch D",  defval=3, minval=1)
over_buying  = input(title="Stoch Overbuying Zone",  defval=80, minval=0, maxval=100)
over_selling = input(title="Stoch Overselling Zone",  defval=20, minval=0, maxval=100)

fast_ema_periods = input(title="Fast EMA (Death Cross)",  defval=14, minval=1, maxval=600)
slow_ema_periods = input(title="Slow EMA (Death Cross)",  defval=23, minval=1, maxval=600)
trend_ema_periods = input(title="Slowest EMA (Trend Test)",  defval=40, minval=1, maxval=600)

volume_periods = input(title="Volume Periods",  defval=20, minval=1, maxval=600)
volume_factor = input(title="Min Volume/Media Increase (%)",  defval=80, minval=-100) / 100 + 1

threshold_sl_perc = input(title="[Sell Trigger] Stop Loss Threshold %", defval=6.0, type=float, minval=0, maxval=100)

//before_buy = input(title="# Growing Before Buy",  defval=2, minval=1)
//before_sell = input(title="# Decreasing Before Sell",  defval=1, minval=1)
//stepsignal = input(title="Show White Steps", type=bool, defval=true)
//steps_base = input(title="White Steps Base",  defval=242, minval=0)

//Signals
fast_ema = ema(close, fast_ema_periods)
slow_ema = ema(close, slow_ema_periods)
trend_ema = ema(close, trend_ema_periods)
k = stoch(close, high, low, stoch_k)
d = sma(k, stoch_d)
vol_ma = sma(volume, volume_periods)

//REVIEW CONSTANT 1.75:
in_middle_zone(a) => a > over_selling * 1.75 and a < over_buying
growing(a) => a > a[1] 

was_in_middle_zone = k == d
was_in_middle_zone := was_in_middle_zone[1] or in_middle_zone(k) and in_middle_zone(d)

//Buy Signal Trigger:
//- Both Stoch <= 20 crossing up and both growing and 
//  green candle and Vol/sma vol >= 1.40 Avg Vol
buy = k <= over_selling and d <= over_selling and crossover(k, d) and growing(k) and growing(d) and
      close > open and volume/vol_ma >= volume_factor

//or
//- Both Stoch growing up and Vol/sma vol >= 1.40 Avg Vol and green candle and
//  both prior Stoch crossing up
buy := buy or (growing(k) and growing(d) and volume/vol_ma >= volume_factor and close > open and
              crossover(k[1], d[1]) )
//Worse:
//              (crossover(k[1], d[1]) or (crossover(k, d) and k[1] <= over_selling and d[1] <= over_selling) ) )

//or
//  [OPTIONAL]: (Bad for BTC 2018, excelent for 2017)
//- Crossingover(fast_ema, slow_ema) and growing(fast_ema) and growing(slow_ema) and green candle
buy := buy or (crossover(fast_ema, slow_ema) and growing(fast_ema) and growing(slow_ema) and close > open)


//Debug:
//d1 = close > open  ? 400 : 0
//plot(d1+5200, color=white, linewidth = 3, style = stepline)

//Exit position:
//- Both Stoch <= 20 and Both Stoch were > 20 during position
sell = k <= over_selling and d <= over_selling and was_in_middle_zone

//  or
//- CrossingUnder(Fast EMA, Medium EMA)
sell := sell or crossunder(fast_ema, slow_ema)

//  or  [OPTIONAL] (Better for BTC 2018, Worse for BNB 1H)
//- CrossingUnder(k, d) and (k and d starting over over_buying) and (k and d descending) and k crossing down over_buying line
sell := sell or (crossunder(k, d) and k[1] >= over_buying and d[1] >= over_buying and
                 not growing(k) and not growing(d) and k <= over_buying)

color = buy ? green : red

bought_price = close
bought_price := nz(bought_price[1])

already_bought = false
already_bought := nz(already_bought[1], false)

//Date Ranges
buy  := buy and  not already_bought


//d1 = buy ? 400 : 0
//plot(d1+6500, color=white, linewidth = 3, style = stepline)

was_in_middle_zone := (not buy and was_in_middle_zone) or (in_middle_zone(k) and in_middle_zone(d))

already_bought   := already_bought[1] or buy
bought_price := buy ? close * (1 - threshold_sl_perc/100) : bought_price[1]
trigger_SL = close < bought_price[0]
sell := sell or trigger_SL

sell := sell and  
                 already_bought and not buy and (was_in_middle_zone or trigger_SL)

//plot((sell?400:0)+5200, title="Buy-Sell", color=yellow, linewidth = 3, style = stepline)
                 
already_bought   := already_bought[0] and not sell
bought_price := sell ? 0 : bought_price[0]

//plot((was_in_middle_zone?400:0)+5200, title="Buy-Sell", color=yellow, linewidth = 3, style = stepline)

was_in_middle_zone := not sell and was_in_middle_zone

//Plot signals
plot(fast_ema, title="Fast EMA", color=red, linewidth = 4)
plot(slow_ema, title="Slow EMA", color=blue, linewidth = 4)
plot(trend_ema, title="Trend EMA", color=yellow, linewidth = 4)

//Stop Loss
plot(bought_price, color=gray, linewidth=2, style=cross, join=true, title="Stop Loss")

//Y = stepsignal ? lowest(40) : na
//Y = steps_base
//plot(mysignal+Y, title="Steps", color=white, linewidth = 3, style = stepline)
//Unit steps - for debugging
//plot(mysteps+Y, title="Steps2", color=yellow, linewidth = 3, style = stepline)

//Bought or not - for debugging
//plot((already_bought?400:0)+5200, title="Buy-Sell", color=yellow, linewidth = 3, style = stepline)
//plot((sell?400:0)+5200, title="Buy-Sell", color=yellow, linewidth = 3, style = stepline)

plotshape(buy, title="Buy arrows", style=shape.arrowup, location=location.belowbar, color=color, text="Buy", textcolor=color, size=size.huge, transp=30)
plotshape(sell, title="Sell arrows", style=shape.arrowdown, location=location.abovebar, color=color, text="Sell", textcolor=color, size=size.huge, transp=30)

//if n>2000
strategy.entry("buy", strategy.long, when=buy)
strategy.close_all(when=sell)

//plot(strategy.equity, title="Equity", color=white, linewidth = 4, style = line)

//AlertS trigger
//msg = "[SW Magic Signals EMA] BUY/SELL Signal has been triggered." + "(" + tostring(fastema) + ", " + tostring(slowema) + ") on " + tickerid + ", " + period + "."
msg = "SW SVE BUY/SELL Signal has been triggered. (#, #) on EXCH:PAIR, period: #."

alertcondition(buy or sell, title="SW SVE (BUY/SELL SIGNAL)", message=msg)
alertcondition(buy, title="SW SVE (BUY SIGNAL)", message=msg)
alertcondition(sell, title="SW SVE (SELL SIGNAL)", message=msg)


더 많은