
이 전략은 카로베인 평균 회귀 지표와 가격 동력을 기반으로 한다. 가격 동력 보조 지표를 사용하여 추세를 판단하고, 카로베인 평균 회귀 지표와 결합하여 구체적인 입장을 취한다. 이 전략은 중장선 거래에 적용된다.
이 전략은 먼저 다른 주기적 가격의 변화율을 계산하여 가격 동력 지표를 얻는다. 가격 동력 지표 상의 동적 하락선을 통과할 때 다중 헤드 신호를 생성하고, 하위 헤드 신호를 생성한다.
카로베인 평균 회귀 지표는 가격의 평균 회귀 성질에 따라 계산되며, 가격의 변동 가속도와 경로를 반영합니다. 이 지표는 내재된 양성 파동 특성을 가지고 있으며, 가격 움직임의 방향과 시간 노트를 판단하는 데 도움이됩니다.
가격 동력 지표가 신호를 발산할 때, 카로베인 평균 회귀 지표가 대응하는 방향 영역에 있다면, 입문 신호가 발생한다.
이 전략은 가격 운동과 평균 회귀의 두 가지 요소를 고려하여 강력한 추세를 판단하는 능력을 갖는다.
카로베인 평균값 회귀 지표는 가격 전환 지점을 정확하게 파악하여 입시 시점의 정확성을 향상시킵니다.
파라미터를 통해 자유 제어 보유 주기를 조정할 수 있으며, 다른 시간 주기에 적용된다.
동적 하락 변수를 실시간으로 조정하여 시장 변화에 적응할 수 있다.
이 전략은 트렌드 추적 전략으로, 흔들리는 트렌드에서 쉽게 잡힐 수 있다.
카로베인 (Karobein) 평균값 회귀 지표는 다소 뒤쳐져 있으며, 가격 전환점을 놓칠 수 있다.
포지션 주기 변수 설정에 주의를 기울여야 하며, 너무 긴 포지션 보유 기간은 손실 확장을 초래할 수 있다.
동적 하락 값을 적절히 조정하여 너무 크게 설정하지 않는 것이 좋습니다. 그렇지 않으면 출전 시간을 놓치게됩니다.
위험과 대응하는 방법:
동향을 판단하는 지표를 통해 진동이 임박한 것을 미리 판단할 수 있고, 적시에 평지상태를 멈출 수 있다.
적절한 주기적 카로베인 평균값 회귀 지표를 선택하여 너무 뒤쳐지지 않도록 한다.
다른 보유 시간 변수를 테스트하고, 자신에게 적합한 보유 시간을 선택하십시오.
진입점을 놓치지 않기 위해 동적 절댓값 범위를 조정할 수 없습니다.
다양한 가격동력 계산주기를 테스트할 수 있으며, 최적화 파라미터를 사용할 수 있다.
변동률 지표가 추가되어 진동을 판단할 수 있으며, 스톱 손실을 설정할 수 있다.
카로베인 평균값 회귀 지표 파라미터를 최적화하여 더 민감하게 만들 수 있다.
거래량 지표와 같은 추가 필터링 조건을 추가하여 신호 품질을 향상시킬 수 있습니다.
기계 학습 알고리즘 동적 최적화 매개 변수를 적용할 수 있다.
이 전략은 가격 동적 요소와 평균 회귀 요소를 종합적으로 고려하고, 강한 추세 판단과 신호 생성 능력을 갖는다. 다양한 시장 환경에 적응하기 위해 매개 변수를 조정할 수 있다. 다음 단계는 진입 시점, 중단 측면에서 추가적으로 최적화하여 전략을 더 안정적이고 강력하게 할 수 있다. 이 전략은 추가 연구 및 적용에 가치가 있다.
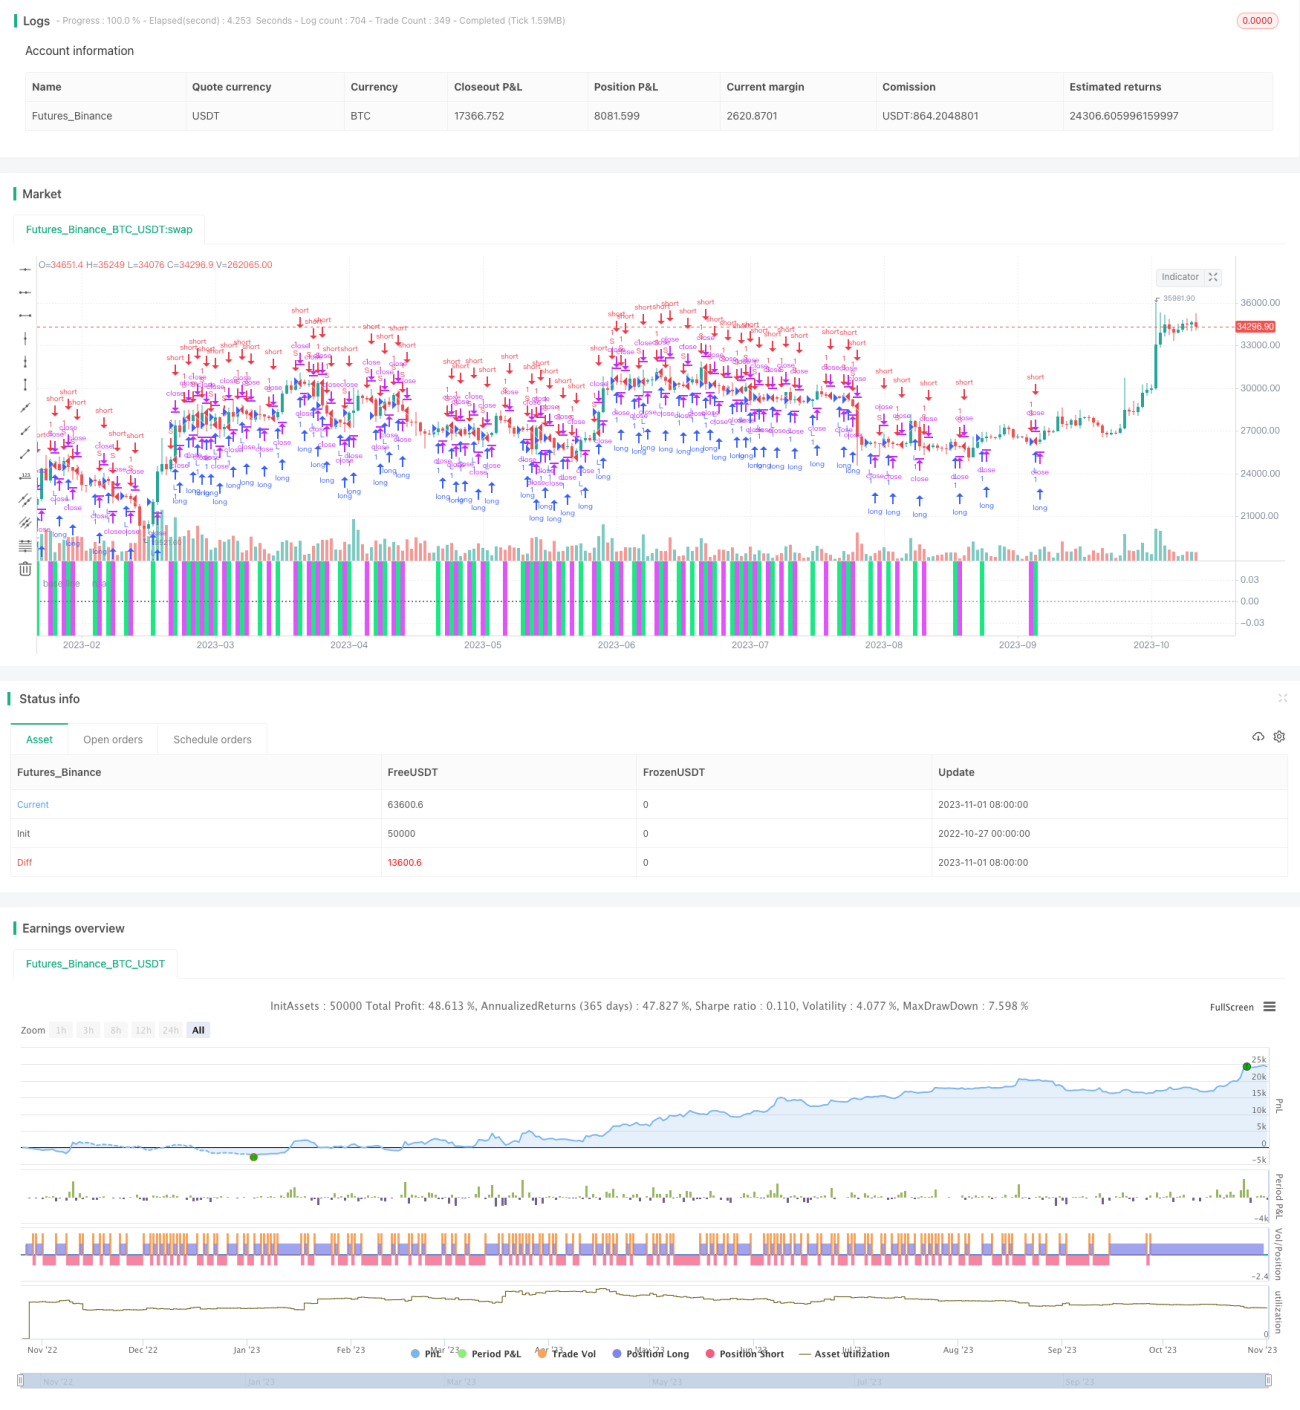
/*backtest
start: 2022-10-27 00:00:00
end: 2023-11-02 00:00:00
period: 1d
basePeriod: 1h
exchanges: [{"eid":"Futures_Binance","currency":"BTC_USDT"}]
*/
//@version=4
// author: capissimo
strategy("Normalized Vector Strategy, ver.3 (sc)", precision=2, overlay=false)
// This is a scaled Normalized Vector Strategy with a Karobein Oscillator
// original: Drkhodakarami (https://www.tradingview.com/script/Fxv2xFWe-Normalized-Vector-Strategy-By-Drkhodakarami-Opensource/)
// Repainting: in general there two types of repainting:
// * when the last candle is constantly being redrawn
// * when the indicator draws a different configuration after it has been deactivated/reactivated, i.e. refreshed
// The former is a natural behaviour, which presents a constant source of frustration,
// when a signal directly depends on the current market situation and can be overcome
// with various indirect techniques like divergence.
// The latter suggests a flaw in the indicator design.
// Unfortunately, the Normalized Vector Strategy is repainting in the latter sense, although being
// really promising. Would be nice if our community suggests a solution to this problem ))
// This strat consistently performs with high accuracy, showing up to 96% scores
// Here are some of the best parameters:
// TF Lookback Performance (ca.)
// 1m 13 92%
// 3m 34 92%
// 5m 85 92%
// 15m 210 90%
// 30m 360 89%
// 1H 1440,720 94%, 87%
// The Karobein Oscillator has an intrinsic sinusoidal behaviour that helps in determining direction and timing.
// It does not repaint.
// original: alexgrover (https://www.tradingview.com/script/JiNi0f62-Karobein-Oscillator/)
scaleMinimax(X, p, min, max) =>
hi = highest(X, p), lo = lowest(X, p)
(max - min) * (X - lo)/(hi - lo) + min
price = input(close, "Price Data")
tf = input(34, "Timeframe", minval=1, maxval=1440)
thresh = input(14., "Threshold", minval=.1, step=.1)
div = input(1000000,"Divisor", options=[1,10,100,1000,10000,100000,1000000,10000000,100000000])
showVol = input(false, "Volume")
useold = input(true, "Use Old System")
lime = color.new(color.lime, 10), fuchsia = color.new(color.fuchsia, 10),
black = color.new(color.black, 100), gray = color.new(color.gray, 50)
vol = useold ? security(syminfo.tickerid, tostring(tf), volume, barmerge.gaps_off, barmerge.lookahead_on)
: security(syminfo.tickerid, tostring(tf), volume)
obv = cum(change(price) > 0 ? vol : change(price) < 0 ? -vol : 0*vol)
prix = showVol ? obv : price
getdiff(prc, tf) =>
prev = useold ? security(syminfo.tickerid, tostring(tf), prc[1], barmerge.gaps_off, barmerge.lookahead_on) :
security(syminfo.tickerid, tostring(tf), prc[1])
curr = useold ? security(syminfo.tickerid, tostring(tf), prc, barmerge.gaps_off, barmerge.lookahead_on) :
security(syminfo.tickerid, tostring(tf), prc)
(curr/prev) - 1
p = getdiff(prix, tf)
up = thresh/div, dn = -thresh/div
longCondition = crossover(p, up)
shortCondition = crossunder(p, dn)
bg = longCondition ? lime : shortCondition ? fuchsia : black
cl = p > up ? color.green : p < dn ? color.red : color.silver
bgcolor(bg, editable=false)
plot(scaleMinimax(up, 2500, -1, 1), color=lime, editable=false, transp=0)
hline(0, linestyle=hline.style_dotted, title="base line", color=gray, editable=false)
plot(scaleMinimax(dn, 2500, -1, 1), color=fuchsia, editable=false, transp=0)
plot(scaleMinimax(p, 2500, -1, 1), color=cl, style=plot.style_histogram, transp=70, editable=false)
plot(scaleMinimax(p, 2500, -1, 1), color=cl, style=plot.style_linebr, title="prediction", transp=0, editable=false)
strategy.entry("L", true, 1, when=longCondition)
strategy.entry("S", false, 1, when=shortCondition)
alertcondition(longCondition, title='Long', message='Long Signal!')
alertcondition(shortCondition, title='Short', message='Short Signal!')
//*** Karobein Oscillator
per = input(8, "Karobein Osc Lookback")
prix2 = ema(price, per)
a = ema(prix2 < prix2[1] ? prix2/prix2[1] : 0, per)
b = ema(prix2 > prix2[1] ? prix2/prix2[1] : 0, per)
c = (prix2/prix2[1])/(prix2/prix2[1] + b)
d = 2*((prix2/prix2[1])/(prix2/prix2[1] + c*a)) - 1
plot(scaleMinimax(d, 2500, -1, 1), color=color.orange, transp=0)