
동적 평행선 트렌드 크로스 전략은 MACD (Moving Average Convergence Spread Indicator) 를 기반으로 한 거래 시스템이다. 이 전략은 단기 및 장기 이동 평균의 차이에 따라 시장의 흐름을 판단하여 구매 또는 판매 결정을 내린다. 주요 아이디어는 단기 및 장기 트렌드 사이의 관계를 모니터링하여 시장의 잠재적인 변화를 예측하는 것이다.
이 전략은 두 개의 다른 주기의 지수 이동 평균 ((EMA): 빠른 EMA ((8일) 와 느린 EMA ((16일) 을 사용한다. MACD 값은 이 두 개의 EMA의 차원에서 구성된다. 또한, 전략은 MACD의 간단한 이동 평균 (SMP) 인 신호 라인을 도입한다. MACD 라인을 통과하면, 다중 트렌드를 나타냅니다.
코드 수준에서, 전략은 먼저 빠른 EMA와 느린 EMA를 계산하고 MACD 값을 얻습니다. 그 다음, MACD의 SMA를 계산합니다. 신호 라인으로. MACD와 신호 라인의 위치를 비교하여 전략은 현재 포지션 상태를 결정합니다.
동적 평행선 트렌드 크로스 전략의 주요 장점은 간결함과 시장 추세 변화에 대한 민감성입니다. 다양한 주기의 EMA를 사용하여 전략은 단기 및 장기 추세 사이의 편차를 효과적으로 포착하여 시장 변화에 신속하게 대응 할 수 있습니다. 또한 신호 선의 추가는 전략의 정확성을 더욱 높여 투자자가 트렌드 전환을 더 빨리 식별 할 수 있습니다.
동적 평행선 트렌드 크로스 전략은 대부분의 경우 좋은 성적을 거두고 있지만, 몇 가지 위험이 있습니다. 가장 주요한 위험은 시장의 변동성이 크거나 추세가 보이지 않을 때 이 전략이 잘못된 신호를 일으킬 수 있다는 것입니다. 또한, 전략의 역사적 데이터에 대한 의존도 또한 지연 반응을 일으킬 수 있습니다. 이러한 위험을 줄이기 위해 투자자는 의사 결정을 돕기 위해 다른 기술 지표 또는 시장 분석과 결합 할 수 있습니다.
이 전략의 최적화 방향은 주로 EMA 주기의 길이를 조정하고, 다른 기술 지표를 도입하고, 시장의 변동성을 고려하는 것입니다. 조정 주기의 길이는 전략을 다른 시장 조건에 더 잘 적응시킬 수 있습니다. RSI, 브린 밴드와 같은 다른 지표를 도입하면 더 포괄적인 시장 관점을 제공할 수 있습니다.
동적 평행선 트렌드 크로스 전략은 MACD를 중심으로 한 양적 거래 전략이다. 그것은 단기 및 장기 트렌드의 관계를 분석하여 시장 움직임을 파악한다. 이 전략은 간결하고 효과적이지만 제한과 잠재적인 위험을 주의해야합니다. 지속적으로 최적화하고 다른 분석 도구와 결합하여 투자자는 이 전략을 더 잘 활용하여 효과적인 시장 조작을 할 수 있습니다.
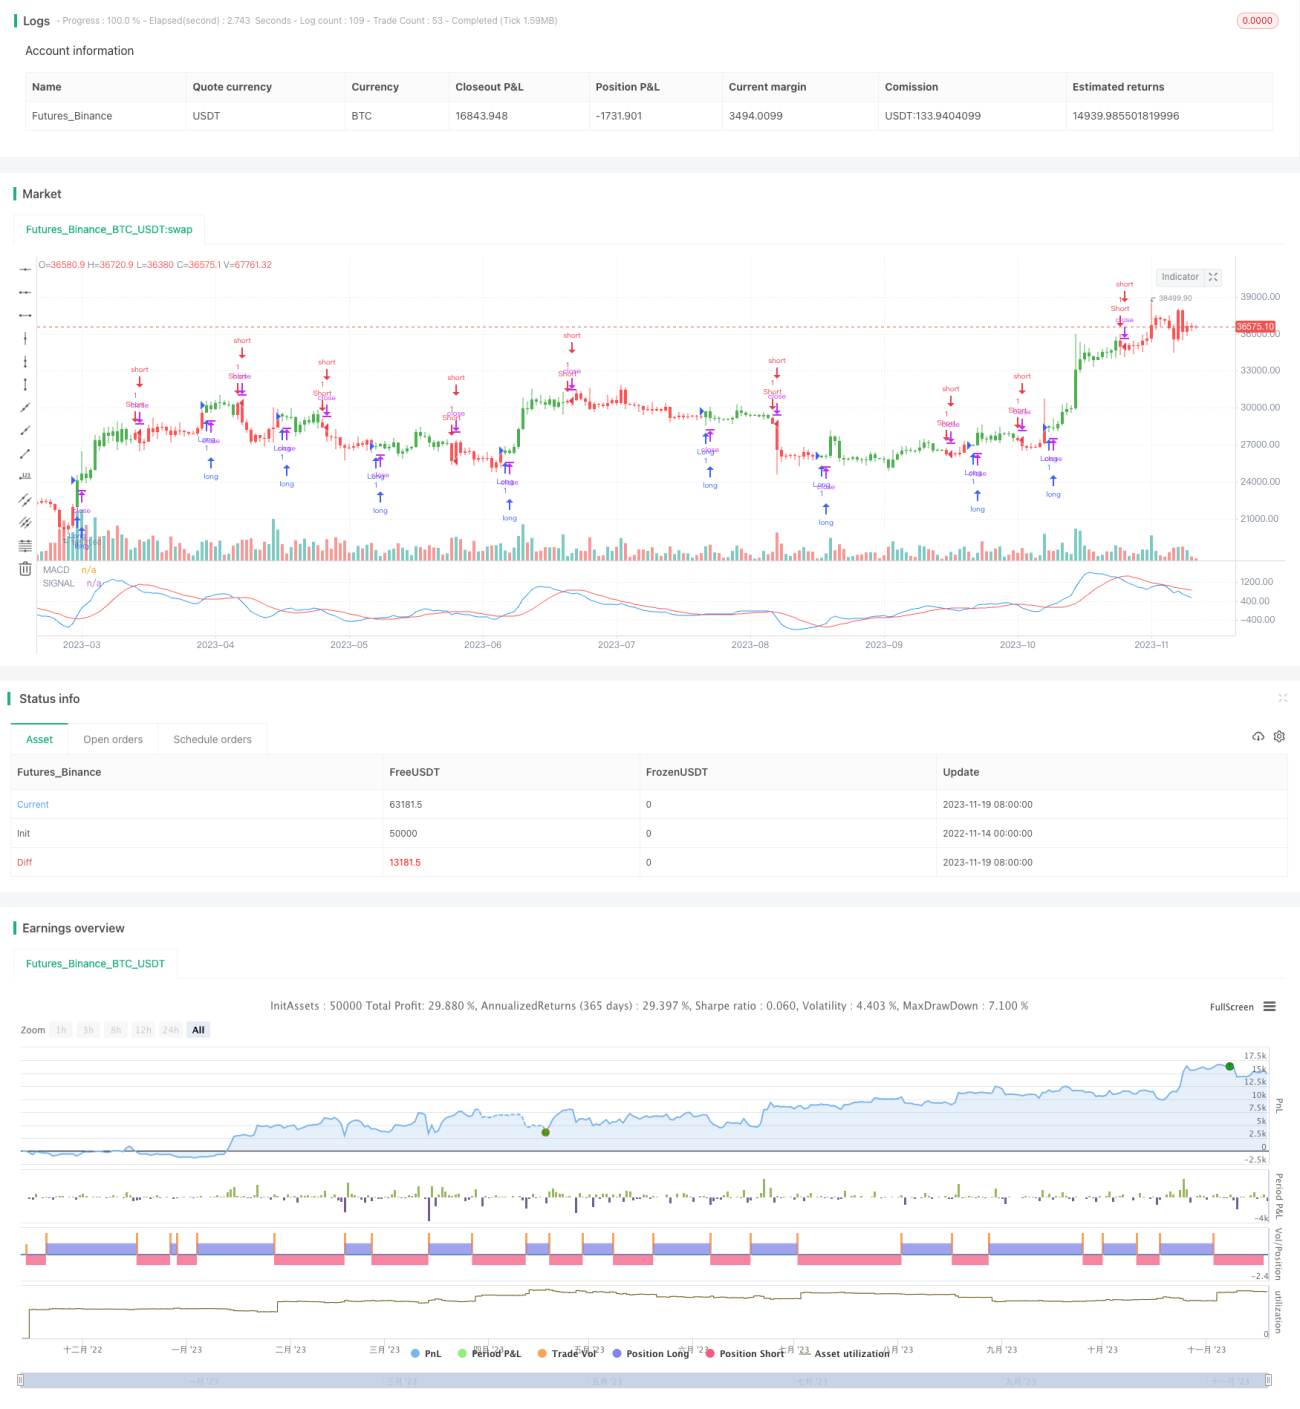
/*backtest
start: 2022-11-14 00:00:00
end: 2023-11-20 00:00:00
period: 1d
basePeriod: 1h
exchanges: [{"eid":"Futures_Binance","currency":"BTC_USDT"}]
*/
//@version=2
////////////////////////////////////////////////////////////
// Copyright by HPotter v1.0 06/09/2017
// MACD – Moving Average Convergence Divergence. The MACD is calculated
// by subtracting a 26-day moving average of a security's price from a
// 12-day moving average of its price. The result is an indicator that
// oscillates above and below zero. When the MACD is above zero, it means
// the 12-day moving average is higher than the 26-day moving average.
// This is bullish as it shows that current expectations (i.e., the 12-day
// moving average) are more bullish than previous expectations (i.e., the
// 26-day average). This implies a bullish, or upward, shift in the supply/demand
// lines. When the MACD falls below zero, it means that the 12-day moving average
// is less than the 26-day moving average, implying a bearish shift in the
// supply/demand lines.
// A 9-day moving average of the MACD (not of the security's price) is usually
// plotted on top of the MACD indicator. This line is referred to as the "signal"
// line. The signal line anticipates the convergence of the two moving averages
// (i.e., the movement of the MACD toward the zero line).
// Let's consider the rational behind this technique. The MACD is the difference
// between two moving averages of price. When the shorter-term moving average rises
// above the longer-term moving average (i.e., the MACD rises above zero), it means
// that investor expectations are becoming more bullish (i.e., there has been an
// upward shift in the supply/demand lines). By plotting a 9-day moving average of
// the MACD, we can see the changing of expectations (i.e., the shifting of the
// supply/demand lines) as they occur.
// You can change long to short in the Input Settings
// WARNING:
// - For purpose educate only
// - This script to change bars colors.
////////////////////////////////////////////////////////////
strategy(title="MACD Crossover", shorttitle="MACD Crossover")
fastLength = input(8, minval=1)
slowLength = input(16,minval=1)
signalLength=input(11,minval=1)
reverse = input(false, title="Trade reverse")
// hline(0, color=purple, linestyle=dashed)
fastMA = ema(close, fastLength)
slowMA = ema(close, slowLength)
macd = fastMA - slowMA
signal = sma(macd, signalLength)
pos = iff(signal < macd , 1,
iff(signal > macd, -1, nz(pos[1], 0)))
possig = iff(reverse and pos == 1, -1,
iff(reverse and pos == -1, 1, pos))
if (possig == 1)
strategy.entry("Long", strategy.long)
if (possig == -1)
strategy.entry("Short", strategy.short)
barcolor(possig == -1 ? red: possig == 1 ? green : blue )
plot(signal, color=red, title="SIGNAL")
plot(macd, color=blue, title="MACD")