추세 추종 이동 평균 RSI 전략

개요
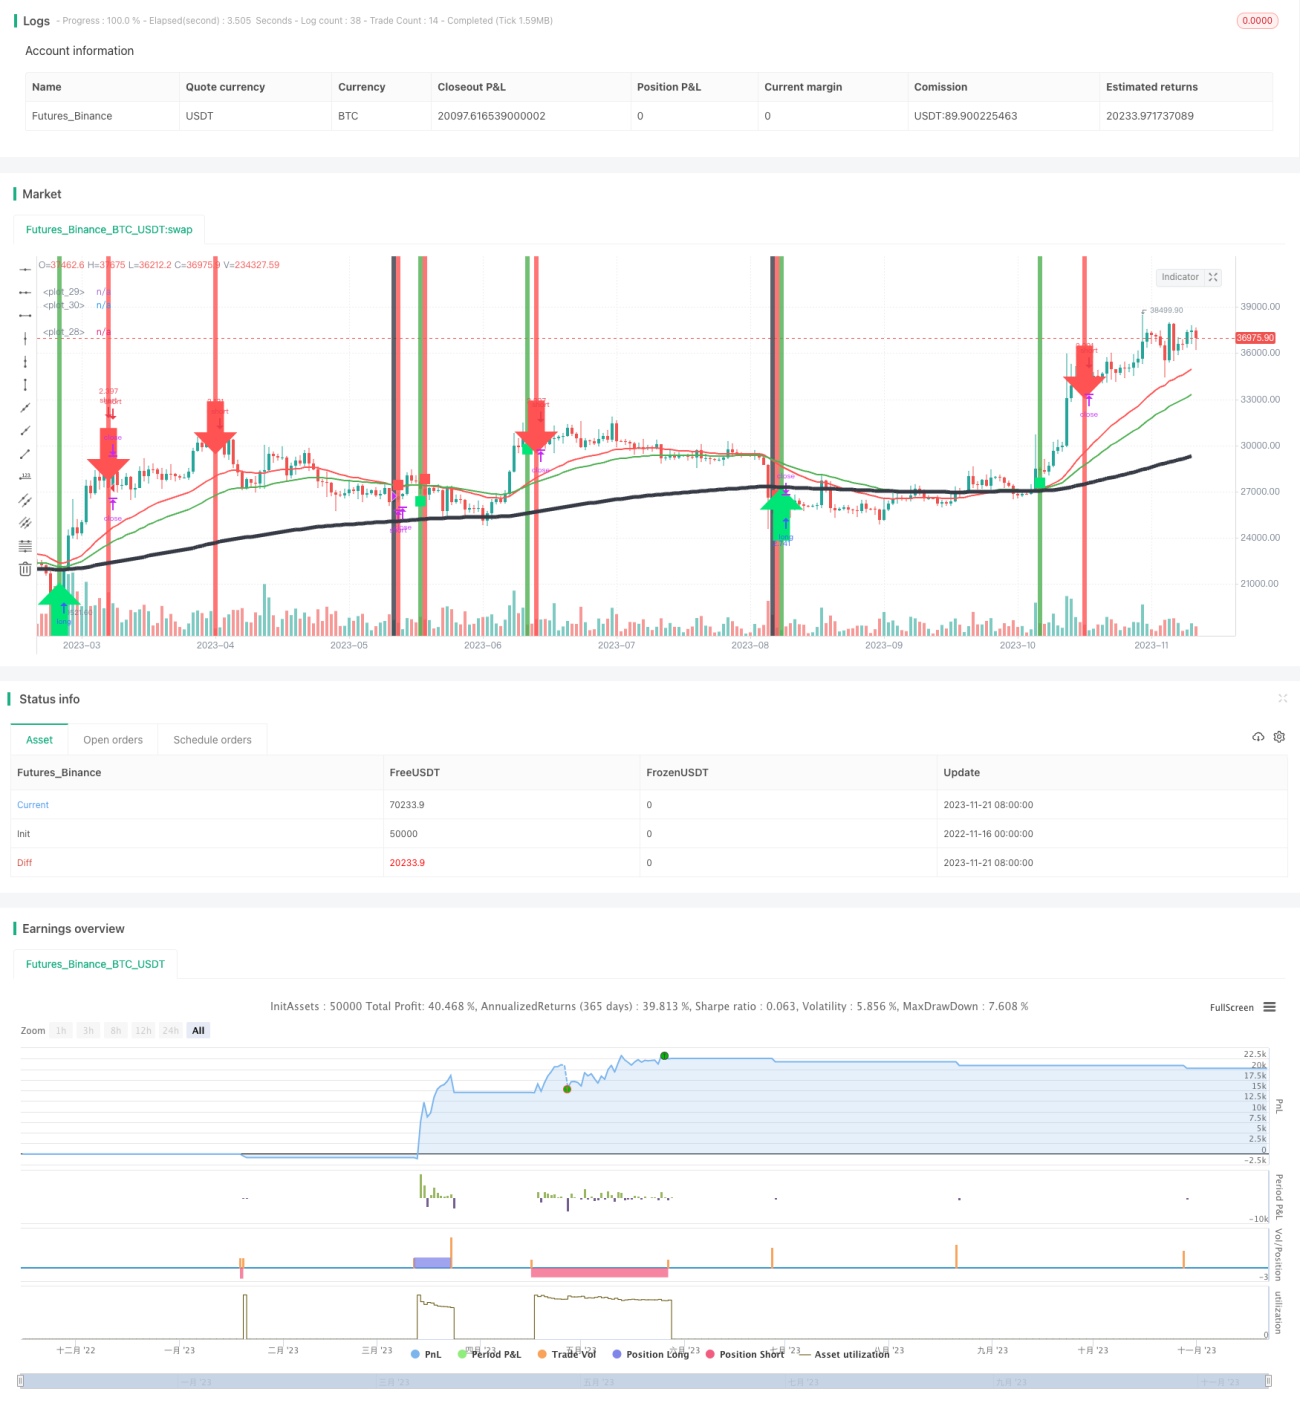
트렌드를 추적하는 이동 평균 RSI 전략은 동향 분석과 오버 바이 오버 시드 지표를 동시에 사용하는 주식 자동 거래 전략이다. 이 전략은 간단한 이동 평균을 사용하여 시장의 경향 방향을 판단하고, 상대적으로 강한 지수 ((RSI) 지표와 결합하여 거래 신호를 발산하여 트렌드를 판단하고 추적한다.
전략 원칙
이 전략은 크게 세 부분으로 구성됩니다.
-
트렌드 판단: 장기 트렌드의 200일 간단한 이동 평균을 계산하고, 단기 트렌드의 30일 및 50일 간단한 이동 평균을 계산한다. 단기 이동 평균 상에서 장기 이동 평균을 가로질러 낙관 신호로, 아래로 가로질러 낙하 신호로 시장의 장기 단기 트렌드를 판단한다.
-
오버 바이 오버 셀 판단: 14일 RSI를 계산하여, RSI가 80보다 높으면 오버 바이 지역이고, 20보다 낮으면 오버 셀 지역입니다. RSI가 오버 바이 지역에서 떨어지거나 오버 셀 지역에서 상승하면 거래 신호를 냅니다.
-
진입과 진출: 오버 바이 오버 세 신호를 판단할 때, 트렌드 판단의 신호 방향과 일치하면 진입이 더/무료된다. 단기 및 장기 이동 평균이 금색으로 교차할 때, 판단 트렌드가 역전되어, 이 시점에는 평지 포지션 출장한다.
이 전략으로 주식 가격이 반전될 때 적시에 입문할 수 있으며, 추세 판단과 결합하여 일부 소음 거래를 필터링하고, 회수 통제에 비교적 우수하다.
우위 분석
이 전략에는 다음과 같은 장점이 있습니다.
- 트렌드 판단과 오버 바이 오버 셀 지표와 결합하여, 노이즈를 필터링하고, 역전점을 식별한다.
- 또한, 장기, 단기 두 시간 동안의 경향 방향을 고려하여 판단하는 것이 더 정확합니다.
- 이동 평균을 스톱 로스로 사용하면 시장의 변동 정도에 따라 스톱 로스를 설정할 수 있다.
- 진입 조건이 엄격하여 가짜 침입을 효과적으로 방지할 수 있습니다.
위험과 해결책
이 전략에는 몇 가지 위험도 있습니다.
- 장기적인 변동이 발생하면 무효 거래가 많이 열립니다. 해결책은 더 많은 필터링 조건을 추가하여 무의미한 거래를 피하는 것입니다.
- 일정 시간 지연의 위험이 있다. 해결 방법은 이동 평균의 주기 변수를 적절히 줄이는 것이다.
- RSI 지표가 신호를 보내는 효과는 주식과 시장에 영향을 받는다. K선 형태와 같은 더 많은 요소를 결합하여 효과를 판단하는 방법입니다.
최적화 방향
이 전략은 다음과 같은 부분에서 최적화될 수 있습니다.
- 교차량, K선 형태 등과 같은 더 많은 필러파 조건을 추가하여 신호의 효과를 더욱 향상시킨다.
- 이동 평균과 RSI의 변수 주기를 최적화하여 다른 주식의 특성에 더 적합하게 만듭니다.
- 동적 이동 평균을 설정하여 시장의 변동성과 위험 선호도에 따라 변수를 자동으로 조정합니다.
- 기계학습과 같은 더 진보된 기술로 시장의 추세를 판단하고, 판단의 정확도를 높일 수 있다.
요약하다
트렌드를 추적하는 이동 평균 RSI 전략은 전반적으로 매우 실용적인 전략적 사고방식이며, 트렌드 분석과 오버 바이 오버 세 지표와 결합하여 시장 소음을 어느 정도 필터링하여 거래 신호를 더 정확하고 효과적으로 만듭니다. 지속적인 최적화 수단과 매개 변수를 통해 이 전략은 안정적으로 수익성있는 장기 거래 시스템으로 될 수 있습니다.
- 1