개요
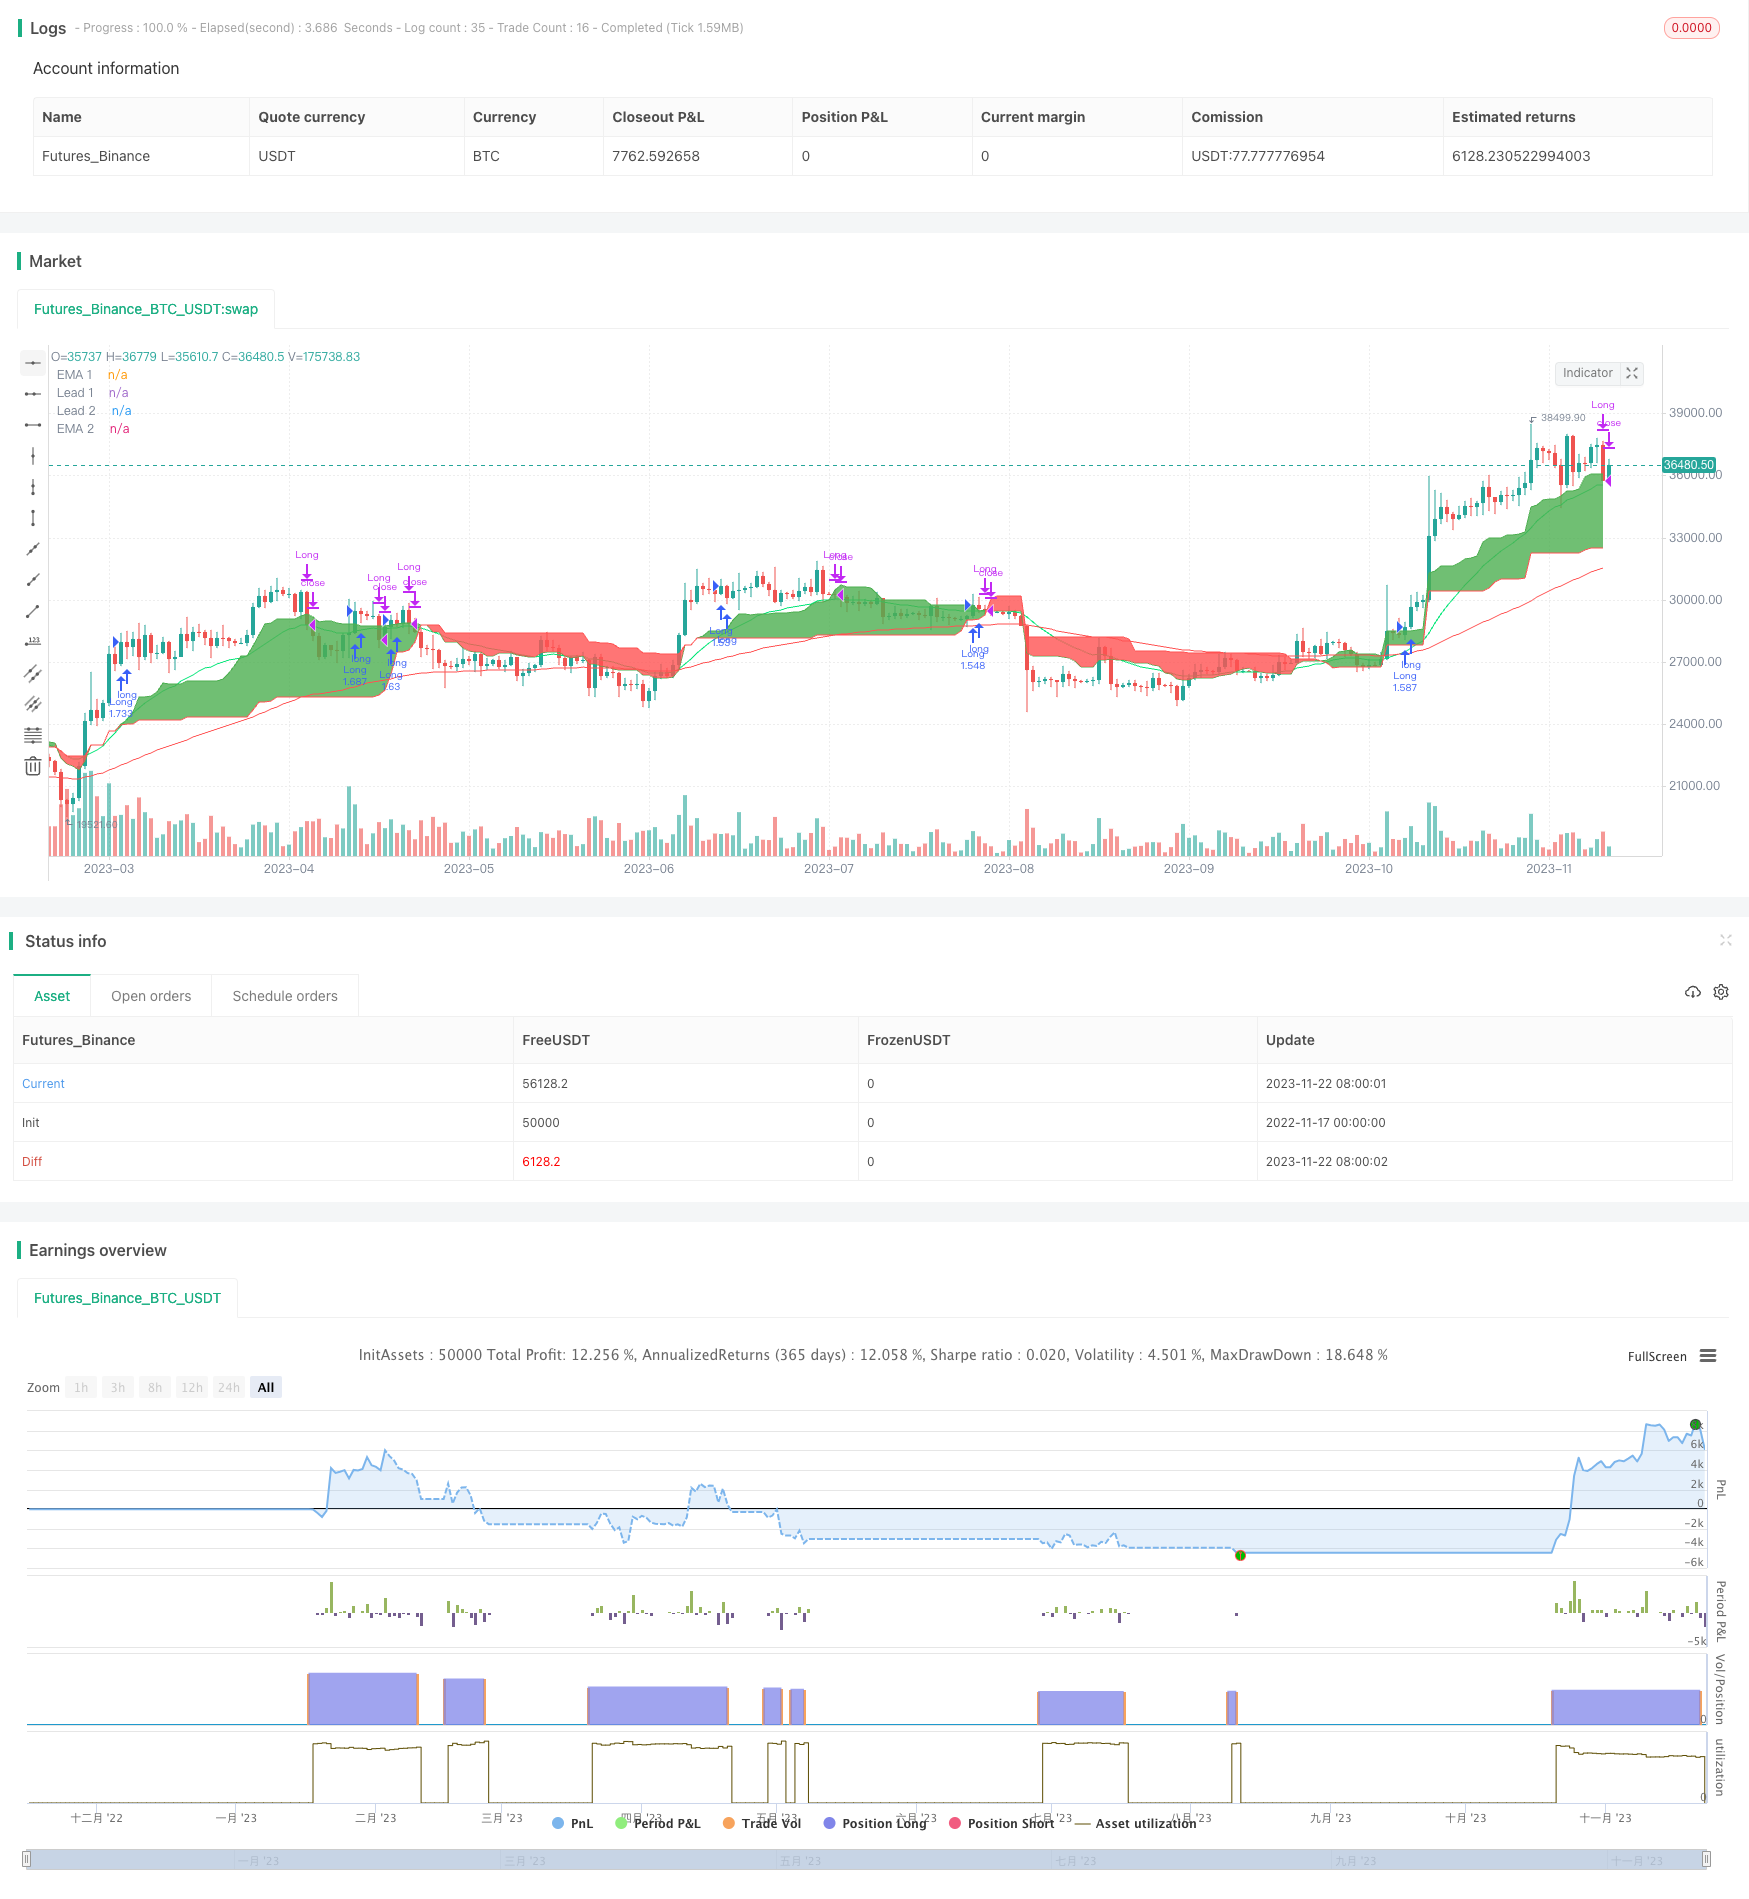
이치모쿠 클라우드 그래프 수량화 전략입니다. 이치모쿠 지표로 트렌드 방향을 판단하고, K 선형, 이동 평균 및 스토카스틱 RSI 지표 필터 신호와 함께 트렌드가 올라갈 때 더 나은 입구 지점을 선택합니다.
전략 원칙
이 전략의 주요 판단 기준은 다음과 같습니다.
- 이치모쿠 선도 1에서 선도 2를 통과하여 트렌드 전환을 나타냅니다.
- K 선이 마감 가격에서 선도 선 1을 통과하여 트렌드를 추적하는 조건에 부합합니다.
- K선 (陽線) 은 위쪽으로 향하고 있습니다.
- 이동 평균을 활성화할 때, 빠른 선에서 느린 선을 통과하도록 요구합니다.
- 스토카스틱 RSI를 활성화할 때, K 라인에서 D 라인을 통과하도록 요구합니다.
위의 조건이 동시에 충족되면, 전략은 더 많은 위치를 열고; 가격이 선도선 1을 넘어지면, 전략은 상위 위치를 종료한다.
이 전략은 주로 이치모쿠 클라우드 그래프를 사용하여 주 트렌드 방향을 판단하고, 보조 지표 필터링 신호와 결합하여 트렌드가 상승하면 더 좋은 입구를 선택한다.
전략적 이점
- 이치모쿠 클라우드 지도를 통해 주요 트렌드를 판단하고, 재검토 결과 매우 높은 정확도를 나타냈다.
- 다양한 보조 지표 필터링으로 입점 포인트를 결합하여 수익률을 크게 높일 수 있습니다.
- 다중 전략으로만, 다중 거래로 판단되는 통화에 적용됩니다.
- 매개 변수 최적화 공간이 넓고, 지표 매개 변수를 더 최적화 할 수 있습니다.
전략적 위험
- 이치모쿠 클라우드 그래프 판단 실패의 확률이 존재하며, 트렌드 방향을 잘못 판단할 수 있습니다.
- 급격한 변동으로 인해 손실이 커질 수 있는 스톱로스 (Stop Loss) 가 뚫릴 수 있습니다.
- 다중 동향을 위한 디자인, 동향이 변하는 징후를 숨기는 데 적합하지 않은 동전
- 잘못 설정된 매개 변수는 너무 적극적으로 진입하거나 너무 보수적으로 작용할 수 있습니다.
대책:
- 더 많은 지표와 판단 트렌드를 결합하여 판단의 정확도를 높여줍니다.
- 합리적인 스톱포인트를 설정하고 단편적 손실을 엄격하게 통제합니다.
- 다양한 통화 상황에 따라 적용할 수 있는 전략
- 신중한 테스트와 최적화 매개 변수, 전략의 안정성
전략 최적화 방향
- 보조 지표 파라미터 설정을 최적화하여 전략 안정성을 더욱 향상시킵니다.
- 트레이킹 스톱, 지수 이동 평균 스톱과 같은 손실을 막는 장치를 추가합니다.
- 위치 관리, 예를 들어 고정 위치, 위치 평균
- 특정 통화에 대한 변수 조정 최적화
요약하다
이 이치모쿠 (Ichimoku) 클라우드 그래프 수량화 전략은 트렌드 방향을 판단하여 높은 승률과 위험을 제어할 수 있는 단 하나의 전략이다. 전략의 장점은 분명하며, 다중 거래에서 효과가 두드러진다. 다음 단계는 지표 최적화, 손해 중지 장치, 포지션 관리 등의 측면에서 개선될 수 있어 전략이 더 완벽하고 안정된다.
전략 소스 코드
/*backtest
start: 2022-11-17 00:00:00
end: 2023-11-23 00:00:00
period: 1d
basePeriod: 1h
exchanges: [{"eid":"Futures_Binance","currency":"BTC_USDT"}]
*/

//@version=4

strategy(title="Ichimoku only Long Strategy", shorttitle="Ichimoku only Long", overlay = true, pyramiding = 0, calc_on_order_fills = false, commission_type =  strategy.commission.percent, commission_value = 0, default_qty_type = strategy.percent_of_equity, default_qty_value = 100, initial_capital=10000, currency=currency.USD)

// Time Range
FromMonth=input(defval=1,title="FromMonth",minval=1,maxval=12)
FromDay=input(defval=1,title="FromDay",minval=1,maxval=31)
FromYear=input(defval=2017,title="FromYear",minval=2017)
ToMonth=input(defval=1,title="ToMonth",minval=1,maxval=12)
ToDay=input(defval=1,title="ToDay",minval=1,maxval=31)
ToYear=input(defval=9999,title="ToYear",minval=2017)
start=timestamp(FromYear,FromMonth,FromDay,00,00)
finish=timestamp(ToYear,ToMonth,ToDay,23,59)
window()=>true
// See if this bar's time happened on/after start date
afterStartDate = time >= start and time<=finish?true:false

//Enable RSI
enableema = input(true, title="Enable EMA?")
enablestochrsi = input(false, title="Enable Stochastik RSI?")

//EMA
emasrc = close,
len1 = input(24, minval=1, title="EMA 1")
len2 = input(90, minval=1, title="EMA 2")

ema1 = ema(emasrc, len1)
ema2 = ema(emasrc, len2)

col1 = color.lime
col2 = color.red

//EMA Plots
plot(ema1, title="EMA 1", linewidth=1, color=col1)
plot(ema2, title="EMA 2", linewidth=1, color=col2)

//STOCH RSI
smoothK = input(3, minval=1, title="RSI K Line")
smoothD = input(3, minval=1, title="RSI D Line")
lengthRSI = input(14, minval=1, title="RSI Length")
lengthStoch = input(14, minval=1, title="Stochastik Length")
src = input(close, title="RSI Source")

rsi1 = rsi(src, lengthRSI)
k = sma(stoch(rsi1, rsi1, rsi1, lengthStoch), smoothK)
d = sma(k, smoothD)

//Ichimoku
conversionPeriods = input(9, minval=1, title="Ichi Conversion Line Length")
basePeriods = input(26, minval=1, title="Ichi Base Line Length")
laggingSpan2Periods = input(52, minval=1, title="Ichi Lagging Span 2 Length")
displacement = input(1, minval=0, title="Ichi Displacement")
donchian(len) => avg(lowest(len), highest(len))
conversionLine = donchian(conversionPeriods)
baseLine = donchian(basePeriods)
leadLine1 = avg(conversionLine, baseLine)
leadLine2 = donchian(laggingSpan2Periods)
p1 = plot(leadLine1, offset = displacement - 1, color=color.green,
	 title="Lead 1")
p2 = plot(leadLine2, offset = displacement - 1, color=color.red,
	 title="Lead 2")
fill(p1, p2, color = leadLine1 > leadLine2 ? color.green : color.red)


//Long Condition
crossup = k[0] > d[0] and k[1] <= d[1]
ichigreenabovered = leadLine1 > leadLine2
ichimokulong = close > leadLine1
greencandle =  close > open
redcandle = close < open
emacond = ema1 > ema2
longcondition = ichigreenabovered and ichimokulong and greencandle

//Exit Condition
ichimokuexit = close < leadLine1

exitcondition = ichimokuexit and redcandle

//Entrys

if (enablestochrsi == false) and (enableema == false) and (longcondition) and (afterStartDate) and (strategy.opentrades < 1)
    strategy.entry("Long", strategy.long)

if (enablestochrsi == true) and (enableema == false) and (longcondition) and (crossup) and (afterStartDate) and (strategy.opentrades < 1)
    strategy.entry("Long", strategy.long)

if (enableema == true) and (enablestochrsi == false) and (longcondition) and (emacond) and (afterStartDate) and (strategy.opentrades < 1)
    strategy.entry("Long", strategy.long)

if (enableema == true) and (enablestochrsi == true) and (longcondition) and (emacond) and (crossup) and (afterStartDate) and (strategy.opentrades < 1)
    strategy.entry("Long", strategy.long)


//Exits
if (afterStartDate)
    strategy.close(id = "Long", when = exitcondition)