개요
이 전략은 여러 시간 프레임의 양과 가격 지표 거래 전략이다. 이 전략은 상대적으로 강한 지수 ((RSI), 평균 실제 파도 ((ATR), 간단한 이동 평균 ((SMA) 과 사용자 정의 된 양 조건을 사용하여 잠재적인 거래 신호를 식별합니다. 특정 과매매, 양과 가격 지표의 교차, 가격 돌파 등의 조건을 충족하면 이 전략은 거래 상위를 설정합니다. 동시에, 각 리스크/이익 비율에 대한 중지 손실 및 중지 경계를 설정합니다.
전략 원칙
이 전략은 다음과 같은 주요 요인에 기반합니다.
- RSI가 초과선보다 낮고 최근 10개의 K선 내에서 연속적으로 초과 상태일 때 초과 신호로 간주됩니다.
- 다수의 양 조건이 정의되어 있으며, 양 조건이 동시에 충족되어야 양 지표가 여러 신호를 발신한다고 간주됩니다.
- 마감 가격이 13주기 SMA를 아래에서 위로 돌파했을 때, 가격의 돌파 신호로 간주됩니다.
- ATR 소주기는 대주기보다 낮고 또한 부추기 신호입니다.
- 위와 같은 여러 지표 신호를 종합하여 다중 의사결정을 결정합니다.
구체적으로, 이 전략은 RSI 지표에 길이와 오버소드 라인 파라미터를 설정하고, 이 파라미터를 기준으로 RSI 값을 계산한다. RSI 지표가 오버소드 라인보다 연속적으로 K 라인이 낮을 때 오버소드 신호가 발생한다.
또한, 이 전략은 3개의 거래량 저하값을 정의하고, 다른 시간 주기의 데이터에 따라, 여러 개의 양 조건들을 설정한다. 예를 들어, 90주기의 양값은 49주기 양값의 1.5배가 크다. 이 양 조건들이 동시에 충족될 때, 양값 지표의 다중 신호를 발산한다.
가격 측면에서, 이 전략은 13주기 SMA 지표를 계산하고, 가격이 SMA를 상향으로 돌파한 이후의 K선 수를 통계한다. 가격이 아래에서 상향으로 SMA를 돌파하고, 돌파 후의 K선 수가 5개 미만일 때, 가격의 돌파 신호로 간주한다.
ATR 주기 파라미터의 측면에서, 이 전략은 소주기 5과 대주기 14의 ATR을 지정한다. 소주기 ATR이 대주기 ATR보다 낮으면, 시장의 변동이 가속화 축소되는 것을 나타내며, 촉진된 더 많은 신호로 사용된다.
최종적으로, 이 전략은 상술한 여러 구매 조건을 종합적으로 고려합니다. 과매매, 수량 가격 지표, 가격 돌파구 및 ATR 지표가 포함됩니다. 이러한 조건이 동시에 충족되면 최종적으로 다중 신호를 생성하고 다중 위치를 설정합니다.
전략적 이점
이 전략에는 다음과 같은 장점이 있습니다.
다중 시간 프레임 수량 지표 판단, 정확도를 높인다. 전략은 단일 주기 수량 데이터를 고려하는 것뿐만 아니라 여러 개의 다른 주기 수량 조건의 교차 상황을 평가하여 수량 능력을 더 정확하게 판단 할 수 있습니다.
과매매 + 수량 + 가격 삼중 판단 메커니즘, 구매 신호의 신뢰성을 보장한다. 과매매는 가장 기본적인 구매 시점 선택을 제공하며, 추가적으로 수량과 가격의 지표가 교차되어 구매 시점에 추가 확인이 추가되고 신뢰성이 높다.
단위 거래의 위험을 엄격하게 제어하는 스톱 스톱 메커니즘을 설정하십시오. 스톱 스톱 및 스톱 파라미터는 개인 위험 선호도에 따라 조정할 수 있으며, 수익을 극대화하면서 각 단위의 위험을 합리적으로 제어합니다.
다중 지표 통합 판단은 탄력성을 증가시킨다. 일부 지표가 고장 나 오류가 발생하더라도 다른 지표 판단에 의존하여 일정 수준의 지속적인 운영 능력을 보장할 수 있다.
위험과 대책
이 전략에는 몇 가지 위험도 있습니다.
매개 변수 설정 위험. 각종 지표의 매개 변수 설정은 판단 결과에 직접적인 영향을 미치며, 불합리한 매개 변수는 거래 신호의 편차를 유발할 수 있다. 매개 변수의 합리적인 값을 신중하게 확인해야 한다.
수익 공간은 제한된다. 여러 지표들을 융합하여 통합적인 판단을 하는 전략으로서, 신호 생성 주파수는 상대적으로 더 보수적이며, 단위 시간 내에 거래되는 횟수가 적으며, 수익 공간은 일정 한계가 있다.
지표 분산 위험. 일부 지표가 다중 신호를 발신하고 다른 지표가 공백 신호를 발신할 때, 전략은 최적의 결정을 결정할 수 없습니다. 이것은 지표 사이에 가능한 분산 상황을 사전에 식별하고 해결해야합니다.
전략 최적화 방향
이 전략은 다음의 몇 가지 측면에서 더 개선될 수 있습니다.
기계 학습 모델 보조 판단을 추가한다. 양값 및 변동 특성 모델을 훈련할 수 있으며, 수동으로 설정된 파라미터를 보조하고, 파라미터를 역동적으로 구현한다.
정지 전략의 성숙도를 높여줍니다. 예를 들어, 부동 정지, 분기 정지, 추적 정지 등을 설정할 수 있습니다.
도입된 거래소 데이터를 평가한다. K선 수량 데이터 이외에, 심도 거래소 데이터를 결합하여 포지션 분포를 판단할 수 있으며, 추가적인 참조 신호를 제공할 수 있다.
다른 지표의 통합을 테스트한다. 이 전략은 주로 RSI, ATR 및 SMA와 같은 지표를 통합하기 위해 사용한다. 또한 브린 라인, KDJ와 같은 다른 지표 포트폴리오를 도입하여 거래 신호 소스를 풍부하고 최적화 할 수 있습니다.
요약하다
이 전략은 RSI, ATR, SMA 및 사용자 정의 가격 조건 판단을 사용하여 잠재적인 다시간 기회를 식별합니다. 동시에 여러 시간 프레임의 가격 지표 판단, 삼중 신호 확인 메커니즘 및 손실 중지 제어 위험 등의 장점이 있습니다. 물론 파라미터配置 위험, 수익 공간 제한 등의 문제를 주의해야합니다.
/*backtest
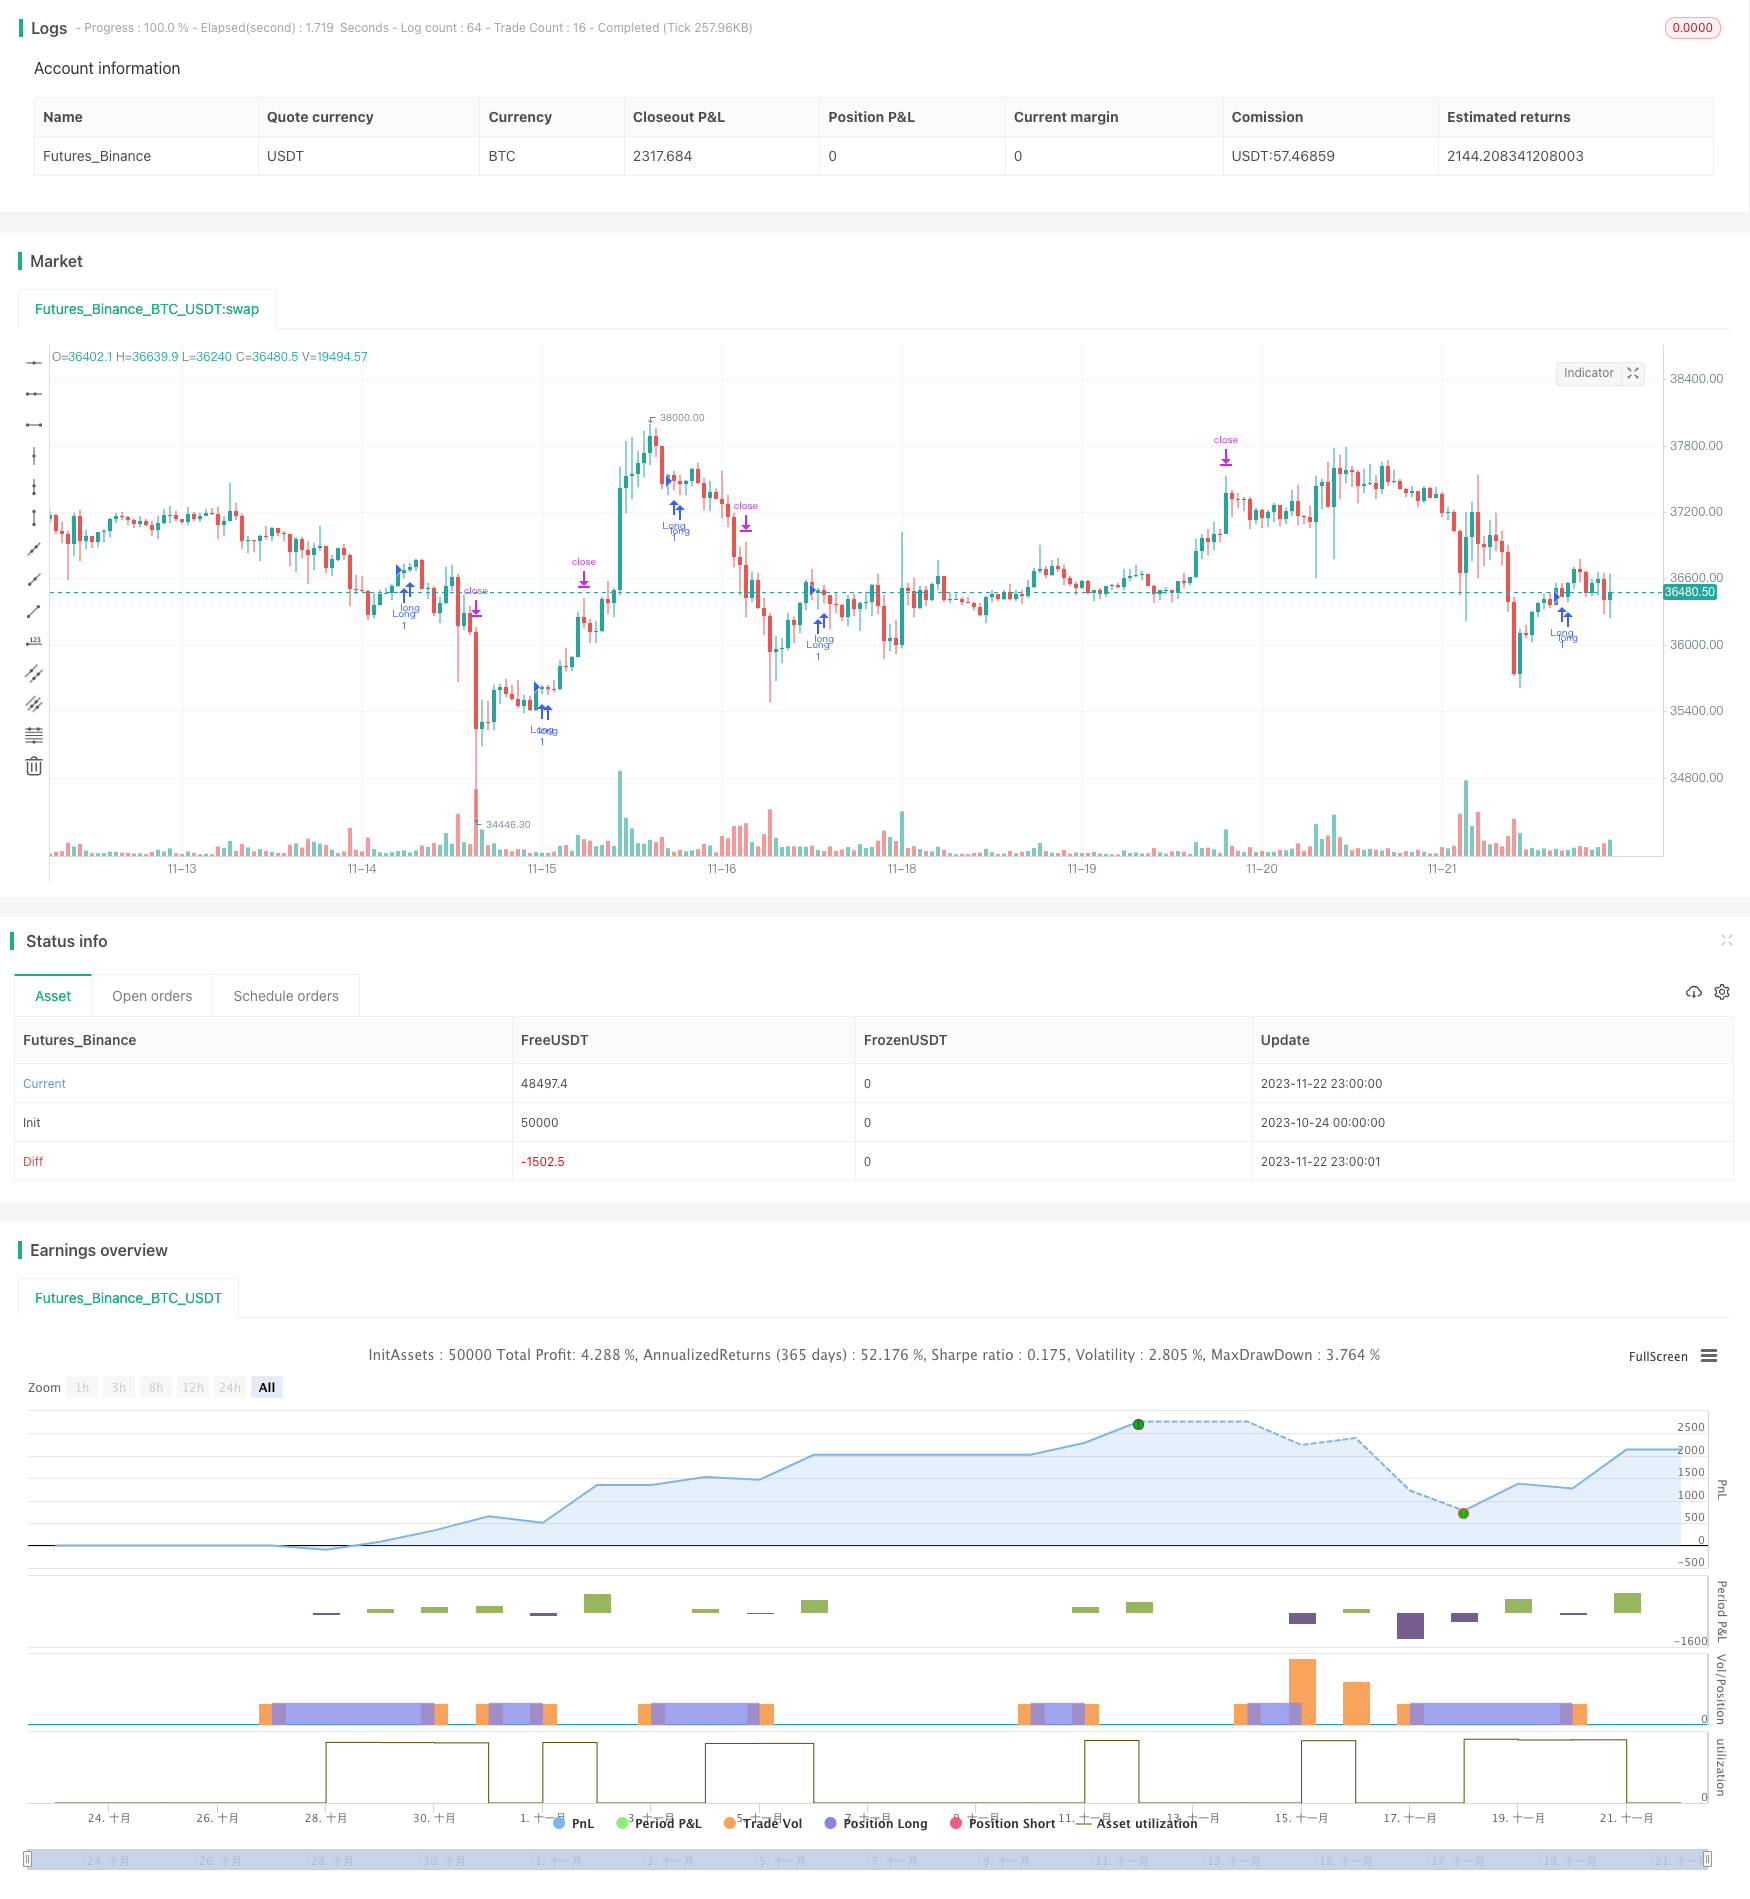
start: 2023-10-24 00:00:00
end: 2023-11-23 00:00:00
period: 1h
basePeriod: 15m
exchanges: [{"eid":"Futures_Binance","currency":"BTC_USDT"}]
*/
// © Kimply_Tr
//@version=5
// Strategy settings and parameters
strategy(title='Volume ValueWhen Velocity', overlay=true)
// Define the stop-loss and take-profit percentages for the long strategy
long_stoploss_value = input.float(defval=3, title='Stop-Loss (SL) %', minval=0, group='▶ Stop Loss/Take Profit => Long-Strategy', inline='2')
long_stoploss_percentage = close * (long_stoploss_value / 100) / syminfo.mintick // Calculate long stop-loss percentage
long_takeprofit_value = input.float(defval=2, title='Take-Profit (TP) %', minval=0, group='▶ Stop Loss/Take Profit => Long-Strategy', inline='2')
long_takeprofit_percentage = close * (long_takeprofit_value / 100) / syminfo.mintick // Calculate long take-profit percentage
// Define parameters related to ValueWhen occurrences
occurrence_ValueWhen_1 = input.int(title='occurrence_ValueWhen_1', defval=1, maxval=100, step=1, group="▶ ValueWhen",tooltip ="Its value must be smaller than (occurrence_ValueWhen_2)")
occurrence_ValueWhen_2 = input.int(title='occurrence_ValueWhen_2', defval=5, maxval=100, step=1, group="▶ ValueWhen" ,tooltip="Its value must be greater than (occurrence_ValueWhen_1)")
distance_value=input.int(title='distance_value_occurrence', defval=170, maxval=5000, step=1, group="▶ ValueWhen" ,tooltip="It indicates the minimum distance between the occurrences of 1 and 2, i.e. the difference between the occurrences of 1 and 2 is greater than (distance_value_occurrence)")
// Define RSI-related parameters
rsi_over_sold = input.int(defval=60, minval=1, title='Oversold Level', group='▶ RSI',inline ='2') // Input for oversold level in RSI
rsi_length = input.int(defval=40, minval=1, title='RSI Length', group='▶ RSI',inline ='2') // Input for RSI length
rsi = ta.rsi(close, rsi_length) // Calculate RSI
// Define volume thresholds
volume_threshold1 = input.float(title='volume_threshold_1', defval=0.5, maxval=10, step=0.1, group="▶ Volume")
volume_threshold2 = input.float(title='volume_threshold_2', defval=0.4, maxval=10, step=0.1, group="▶ Volume")
volume_threshold3 = input.float(title='volume_threshold_3', defval=0.62, maxval=10, step=0.1, group="▶ Volume")
// ATR (Average True Range)
// Define ATR parameters
atr_small = input.int(title='ATR_Small', defval=5, maxval=500, step=1, group="▶ Atr",inline ='2')
atr_big = input.int(title='ATR_Big ', defval=14, maxval=500, step=1, group="▶ Atr",inline ='2')
atr_value3 = ta.atr(15) // Calculate ATR value 3
////////////////////////////////////////////////////////////////////////////////////////////////////////////////////////
// Date Range
// Define the date range for back-testing
start_date = input.int(title='Start Day', defval=1, minval=1, maxval=31, group='▶ Time-Period for Back-Testing', inline='1') // Input for start day
end_date = input.int(title='until Day', defval=1, minval=1, maxval=31, group='▶ Time-Period for Back-Testing', inline='1') // Input for end day
start_month = input.int(title='Start Month', defval=7, minval=1, maxval=12, group='▶ Time-Period for Back-Testing', inline='2') // Input for start month
end_month = input.int(title='until Month', defval=1, minval=1, maxval=12, group='▶ Time-Period for Back-Testing', inline='2') // Input for end month
start_year = input.int(title='Start Year', defval=2022, minval=1800, maxval=3000, group='▶ Time-Period for Back-Testing', inline='3') // Input for start year
end_year = input.int(title='until Year', defval=2077, minval=1800, maxval=3000, group='▶ Time-Period for Back-Testing', inline='3') // Input for end year
in_date_range = time >= timestamp(syminfo.timezone, start_year, start_month, start_date, 0, 0) and time < timestamp(syminfo.timezone, end_year, end_month, end_date, 0, 0) // Check if the current time is within the specified date range
////////////////////////////////////////////////////////////////////////////////////////////////////////////////////////
was_over_sold = ta.barssince(rsi <= rsi_over_sold) <= 10 // Check if RSI was oversold in the last 10 bars
////////////////////////////////////////////////////////////////////////////////////////////////////////////////////////
getVolume(symbol, bar) =>
request.security(syminfo.tickerid, "D", volume)[bar] // Function to get volume data for a specific symbol and bar
getVolume2(symbol, bar) =>
request.security(syminfo.tickerid, "39", volume)[bar] // Function to get volume data for a specific symbol and bar 2
////////////////////////////////////////////////////////////////////////////////////////////////////////////////////////
firstCandleColor1 = request.security(syminfo.tickerid, "D", close[2] > open[1] ? 1 : 0)
firstCandleColor2 = request.security(syminfo.tickerid, "1", close[2] > open[0] ? 1 : 0)
firstCandleColor3 = request.security(syminfo.tickerid, "W", close[1] > open[1] ? 1 : 0)
firstCandleColor= ((firstCandleColor1+firstCandleColor2)) > firstCandleColor3 ? 1 : 0
////////////////////////////////////////////////////////////////////////////////////////////////////////////////////////
sma = ta.sma(close, 13) // Calculate the simple moving average (SMA) of the close price over 13 periods
numCandles = ta.barssince(close > sma) // Count the number of candles since the close price crossed above the SMA
atr1=request.security(syminfo.tickerid, "30", ta.atr(atr_small)<ta.atr(atr_big)) // Get the ATR value for the specific security and timeframe (30 minutes) and check if ATR_small is less than ATR_big
prevClose = ta.valuewhen(close > sma, close, occurrence_ValueWhen_1) // Get the close price when it first crosses above the SMA based on occurrence_ValueWhen_1
prevCloseBarsAgo = ta.valuewhen(close > sma, close, occurrence_ValueWhen_2) // Get the close price when it first crosses above the SMA based on occurrence_ValueWhen_2
prevCloseChange = (prevCloseBarsAgo - prevClose ) // Calculate the change in the close price between the occurrences of crossing above the SMA
atrval=(atr_value3>140) or (atr_value3 < 123) // Check if atr_value3 is either greater than 140 or less than 123
Condition = getVolume(syminfo.tickerid, 90) > volume_threshold1 * getVolume(syminfo.tickerid, 49) and getVolume(syminfo.tickerid, 110) > volume_threshold3 * getVolume(syminfo.tickerid, 49) and getVolume2(syminfo.tickerid, 30) > volume_threshold2 * getVolume2(syminfo.tickerid, 55) and getVolume2(syminfo.tickerid, 7) > volume_threshold2 * getVolume2(syminfo.tickerid, 3) // Check multiple volume conditions
buy_signal=Condition and atrval and firstCandleColor==0 and was_over_sold and prevCloseChange> distance_value and atr1 and numCandles<5 // Determine if the buy signal is generated based on various conditions
////////////////////////////////////////////////////////////////////////////////////////////////////////////////////////
// Long Strategy
// Enter long position if the buy signal conditions are met and within the specified date range
if buy_signal and in_date_range
strategy.entry('Long', strategy.long, alert_message='Open Long Position') // Enter long position
strategy.exit('Long SL/TP', from_entry='Long', loss=long_stoploss_percentage, profit=long_takeprofit_percentage, alert_message='Your SL/TP-Limit for the Long-Strategy has been activated.') // Exit long position with stop-loss and take-profit