
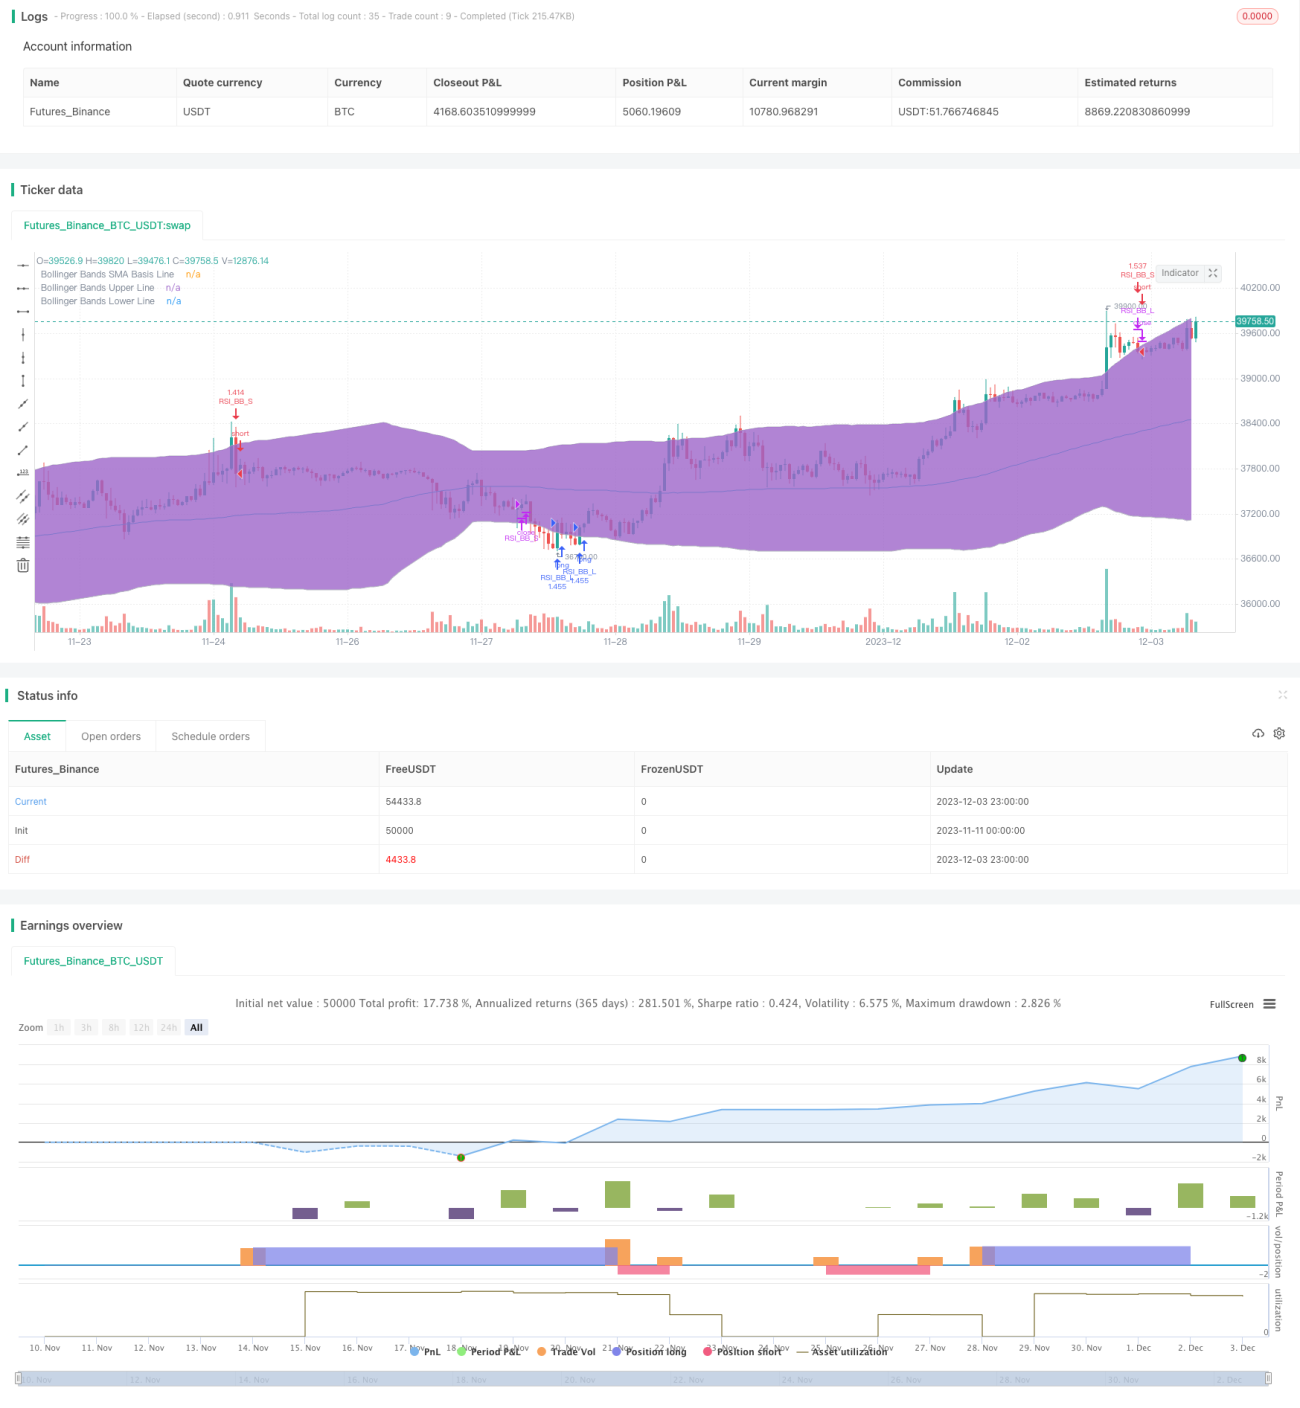
이 전략의 핵심 아이디어는 상대적으로 약한 지표 ((RSI) 와 부린이 가지고 있는 이 두 가지 기술 지표를 결합하여 이중 거래 신호를 필터링하여 가짜 신호의 간섭을 최대한 줄이고 신호 품질을 향상시키는 것입니다.
RSI 지표가 과매매 또는 과매매 신호를 표시하고 가격이 부린을 돌파하거나 회귀하면 거래 기회가 형성됩니다. 그것은 두 가지 다른 지표의 장점을 통합하여 시장의 변동의 통계적 특성을 고려하고 시장 참가자의 다중 공백 상태에 관심을 기울여 전체적인 판단 기반을 형성합니다.
RSI 부분에서, 우리는 두 개의 다른 주기 RSI 지표에 동시에 주목합니다. 짧은 주기 RSI는 오버 바이 오버 소드 신호를 포착하고 긴 주기 RSI는 트렌드 반전을 확인합니다. 짧은 주기 RSI가 오버 바이 오버 소드를 표시하고 긴 주기 RSI가 반전을 표시하면 거래 기회가 형성됩니다.
부린 띠 부분에서, 우리는 가격이 상향 하향 궤도를 돌파했는지에 관심이 있습니다. 부린 띠를 돌파하는 것은 판매 지점이며, 하향 하향을 돌파하는 것은 구매 지점입니다. 또한 우리는 부린 띠를 재조정하는 가격에 관심이 있습니다.
RSI 신호와 브린 밴드 신호가 동시에 나타났을 때, 우리는 거래 기회가 형성되어 거래 지시를 발령한다고 생각합니다.
매개 변수 최적화, 적절한 포지션 축소, 인적 개입 등의 방법으로 위험을 피할 수 있고 제어할 수 있다.
RSI와 브린 벨트 이중 전략은 두 지표의 장점을 최대한 활용하여 높은 품질의 신호를 생성합니다. 변수 최적화 및 위험 관리가 이루어지면 안정적인 투자 수익을 얻을 수 있습니다. 더 많은 신호와 모델을 결합하는 것도 미래의 가능한 방향입니다.
/*backtest
start: 2023-11-11 00:00:00
end: 2023-12-04 00:00:00
period: 1h
basePeriod: 15m
exchanges: [{"eid":"Futures_Binance","currency":"BTC_USDT"}]
*/
//@version=4
strategy("Ezieh Str.v2", shorttitle="Ezieh Str.v2", overlay=true, pyramiding=10, currency=currency.USD, slippage=3, commission_type=strategy.commission.cash_per_order, commission_value=0.04, initial_capital=1000)
UseDateFilter = input(title="Enable Date Filter" ,type=input.bool ,defval=false ,group="Date & Time" ,tooltip="Turns on/off date filter")
StartDate = input(title="Start Date Filter" ,type=input.time ,defval=timestamp("1 Jan 2000 00:00 +0000") ,group="Date & Time" ,tooltip="Date & time to start excluding trades")
EndDate = input(title="End Date Filter" ,type=input.time ,defval=timestamp("1 Jan 2100 00:00 +0000") ,group="Date & Time" ,tooltip="Date & time to stop excluding trades")
UseTimeFilter = input(title="Enable Time Session Filter" ,type=input.bool ,defval=false ,group="Date & Time" ,tooltip="Turns on/off time session filter")
TradingSession = input(title="Trading Session" ,type=input.session ,defval="1000-2200:1234567" ,group="Date & Time" ,tooltip="No trades will be taken outside of this range")
In(t) => na(time(timeframe.period, t)) == false
TimeFilter = (UseTimeFilter and not In(TradingSession)) or not UseTimeFilter
DateFilter = time >= StartDate and time <= EndDate
DateTime = (UseDateFilter ? not DateFilter : true) and (UseTimeFilter ? In(TradingSession) : true)
///////////// RSI
L_RSI_Length = input(7 , title="L_Length")
L_RSI_OverSold = input(45 , title="L_OverSold")
S_RSI_Length = input(14 , title="S_Length")
S_RSI_OverBought = input(65 , title="S_OverBought")
price = close
Lvrsi = rsi(price, L_RSI_Length)
Svrsi = rsi(price, S_RSI_Length)
///////////// Bollinger Bands
BBlength = input(title="Bollinger Period Length", type=input.integer, defval=100, minval=2)
BBmult = 2.1 // input(2.0, minval=0.001, maxval=50,title="Bollinger Bands Standard Deviation")
BBbasis = sma(price, BBlength)
BBdev = BBmult * stdev(price, BBlength)
BBupper = BBbasis + BBdev
BBlower = BBbasis - BBdev
source = close
plot(BBbasis, color=color.aqua,title="Bollinger Bands SMA Basis Line")
p1 = plot(BBupper, color=color.silver,title="Bollinger Bands Upper Line")
p2 = plot(BBlower, color=color.silver,title="Bollinger Bands Lower Line")
fill(p1, p2)
///////////// Colors
switch1=input(true, title="Enable Bar Color?")
switch2=input(true, title="Enable Background Color?")
///////////// Condition
LongCondition = crossover(Lvrsi, L_RSI_OverSold) and crossover(close ,BBlower)
ShortCondition = crossunder(Svrsi, S_RSI_OverBought) and crossunder(close,BBupper)
Longexcon = crossunder(low, BBupper)
Shortexcon = crossover(low, BBlower)
qt = round(strategy.equity/price, 3)
///////////// RSI + Bollinger Bands Strategy
if (not na(Lvrsi))
if LongCondition and DateTime
strategy.entry("RSI_BB_L", strategy.long, qty=qt, comment="Long")
else
strategy.cancel(id="RSI_BB_L")
if Longexcon
strategy.close("RSI_BB_L", qty_percent = 100, comment = "L_exit")
if ShortCondition and DateTime
strategy.entry("RSI_BB_S", strategy.short, qty=qt, comment="Short")
else
strategy.cancel(id="RSI_BB_S")
if Shortexcon
strategy.close("RSI_BB_S", qty_percent = 100, comment = "S_exit")
//plot(strategy.equity, title="equity", color=red, linewidth=2, style=areabr)