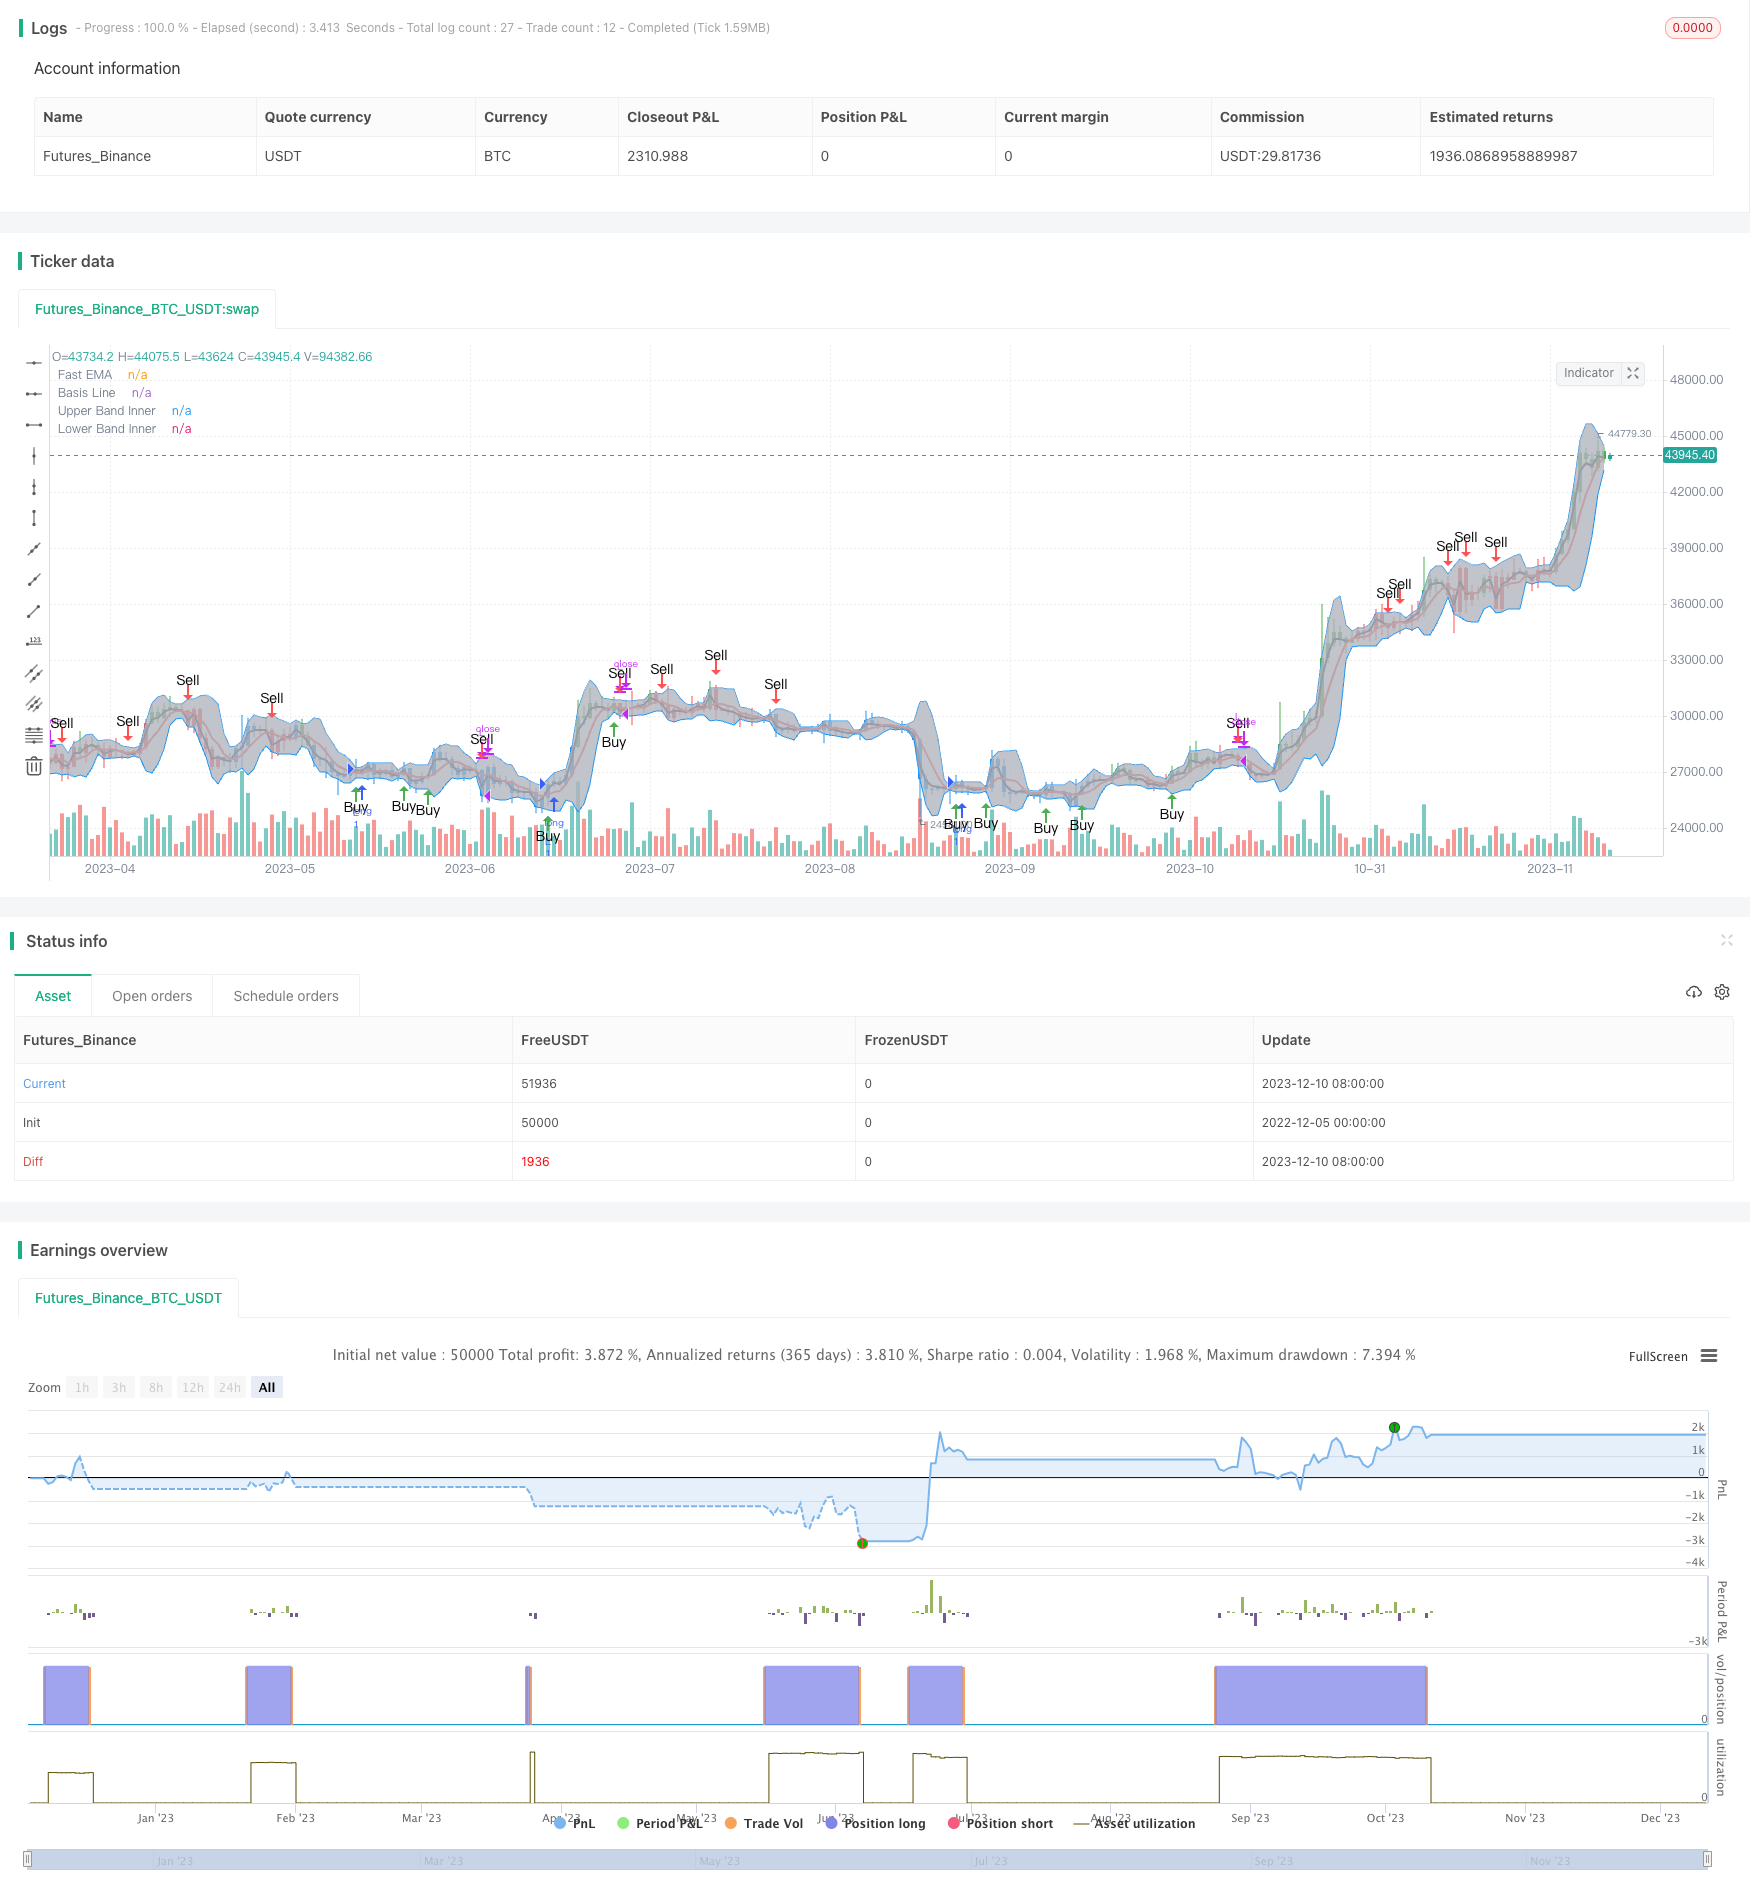
개요
이 전략은 쌍파역 지표와 강도 지표를 결합하여 돌파 거래 모드를 구현한다. 빠른 EMA가 돌파역 통로를 뚫을 때, AO 지표의 다공영 방향 신호와 결합하여 구매 및 판매 신호를 생성한다.
전략 원칙
- 브린 띠의 중간, 상단 및 하단 레일을 사용하여 가격 판정 채널.
- 빠른 EMA가 중간 궤도를 통과하면 통로 돌파로 판단된다.
- 강도 지수 AO 지표는 다중 헤드 및 빈 헤드의 방향을 판단한다.
- 빠른 EMA가 상향으로 중간 궤도를 돌파하고 AO가 양호할 때 구매 신호를 생성한다.
- 빠른 EMA가 하향으로 중간 궤도를 돌파하고 AO가 마이너스되면 팔기 신호를 낸다.
우위 분석
- 이중파역 지표는 가격 통로를 판단하여 잘못된 신호를 피한다.
- AO 지표는 트렌드 방향을 판단하여 거래 신호를 더 정확하게 만듭니다.
- 채널을 뚫고 거래하는 방식과 결합하면 트렌드 초기에 더 많은 수익을 얻을 수 있습니다.
위험 분석
- 부린 밴드 파라미터가 잘못되면 통로가 너무 넓거나 너무 좁아질 수 있다.
- AO 지표 파라미터 설정은 판단의 정확성에 영향을 미칩니다.
- 돌파 신호는 가짜 돌파일 수 있으며, 충분한 돌파력이 있는지 확인해야 한다.
해결 방법
- 부린띠와 AO 지표의 파라미터를 최적화하여 최적의 조합을 찾습니다.
- 파격의 강도 조건을 높여서 가짜 파격을 피하십시오.
- 거래 신호의 신뢰성을 보장하기 위해 다른 지표들과 함께 사용한다.
최적화 방향
- 부린 띠의 파라미터를 최적화하여 가장 적합한 통로 범위를 찾습니다.
- AO 지표의 장기 단기 평균선 변수를 최적화하여 판단 정확도를 높인다.
- 볼륨이나 다른 지표 필터를 추가하여 돌파의 신뢰성을 보장합니다.
- 파격 강도 파라미터를 최적화하고, 가짜 파격률을 감소시킨다.
요약하다
이 전략은 종합적으로 가격 통로, 트렌드 방향 및 돌파 모드를 고려하여 안정적이고 효율적인 거래 전략입니다. 변수 최적화 및 포트폴리오 지표 필터링을 통해 전략의 안정성과 수익률을 더욱 강화 할 수 있습니다. 돌파 거래 모드는 트렌드의 초기 기회를 포착 할 수 있습니다.
전략 소스 코드
/*backtest
start: 2022-12-05 00:00:00
end: 2023-12-11 00:00:00
period: 1d
basePeriod: 1h
exchanges: [{"eid":"Futures_Binance","currency":"BTC_USDT"}]
*/

//@version=3

strategy(shorttitle="BB+AO STRAT", title="BB+AO STRAT", overlay=true)


// === BACKTEST RANGE ===
FromMonth = input(defval = 6, title = "From Month", minval = 1)
FromDay   = input(defval = 1, title = "From Day", minval = 1)
FromYear  = input(defval = 2018, title = "From Year", minval = 2014)
ToMonth   = input(defval = 1, title = "To Month", minval = 1)
ToDay     = input(defval = 1, title = "To Day", minval = 1)
ToYear    = input(defval = 9999, title = "To Year", minval = 2014)

// Bollinger Bands Inputs
bb_use_ema = input(false, title="Use EMA for Bollinger Band")
bb_length = input(5, minval=1, title="Bollinger Length")
bb_source = input(close, title="Bollinger Source")
bb_mult = input(2.0, title="Base Multiplier", minval=0.5, maxval=10)
// EMA inputs
fast_ma_len = input(2, title="Fast EMA length", minval=2)
// Awesome Inputs
nLengthSlow = input(34, minval=1, title="Awesome Length Slow")
nLengthFast = input(5, minval=1, title="Awesome Length Fast")


// Breakout Indicator Inputs
bb_basis = bb_use_ema ? ema(bb_source, bb_length) : sma(bb_source, bb_length)
fast_ma  = ema(bb_source, fast_ma_len)

// Deviation

dev = stdev(bb_source, bb_length)
bb_dev_inner = bb_mult * dev

// Upper bands
inner_high = bb_basis + bb_dev_inner
// Lower Bands
inner_low = bb_basis - bb_dev_inner

// Calculate Awesome Oscillator
xSMA1_hl2 = sma(hl2, nLengthFast)
xSMA2_hl2 = sma(hl2, nLengthSlow)
xSMA1_SMA2 = xSMA1_hl2 - xSMA2_hl2
// Calculate direction of AO
AO = xSMA1_SMA2>=0? xSMA1_SMA2 > xSMA1_SMA2[1] ? 1 : 2 : xSMA1_SMA2 > xSMA1_SMA2[1] ? -1 : -2


// === PLOTTING ===

// plot BB basis
plot(bb_basis, title="Basis Line", color=red, transp=10, linewidth=2)
// plot BB upper and lower bands
ubi = plot(inner_high, title="Upper Band Inner", color=blue, transp=10, linewidth=1)
lbi = plot(inner_low, title="Lower Band Inner", color=blue, transp=10, linewidth=1)
// center BB channel fill
fill(ubi, lbi, title="Center Channel Fill", color=silver, transp=90)

// plot fast ma
plot(fast_ma, title="Fast EMA", color=black, transp=10, linewidth=2)

// Calc breakouts
break_down =   crossunder(fast_ma, bb_basis) and close < bb_basis and abs(AO)==2
break_up   =  crossover(fast_ma, bb_basis) and close > bb_basis and abs(AO)==1

// Show Break Alerts
plotshape(break_down, title="Breakout Down", style=shape.arrowdown, location=location.abovebar, size=size.auto, text="Sell", color=red, transp=0)
plotshape(break_up, title="Breakout Up", style=shape.arrowup, location=location.belowbar, size=size.auto, text="Buy", color=green, transp=0)
// === ALERTS ===


strategy.entry("L", strategy.long, when=(break_up and (time > timestamp(FromYear, FromMonth, FromDay, 00, 00)) and (time < timestamp(ToYear, ToMonth, ToDay, 23, 59))))


strategy.close("L", when=(break_down and (time < timestamp(ToYear, ToMonth, ToDay, 23, 59))))

// === /PLOTTING ===
barcolor(AO == 2 ? red: AO == 1 ? green : blue )


// eof