개요
이 전략은 단일 지수 평평한 이동 평균 ((SESMA) 과 부속된 손실을 막는 돈치 계단을 둘러싼 메커니즘을 결합하여 매우 안정적이고 효율적인 트렌드 추적 전략을 형성합니다. 가격 추세 방향을 식별하는 데 사용되는 주선인 SESMA는 추적 손실 메커니즘은 전략 위험을 효과적으로 줄이면서 전략 이익을 보호합니다.
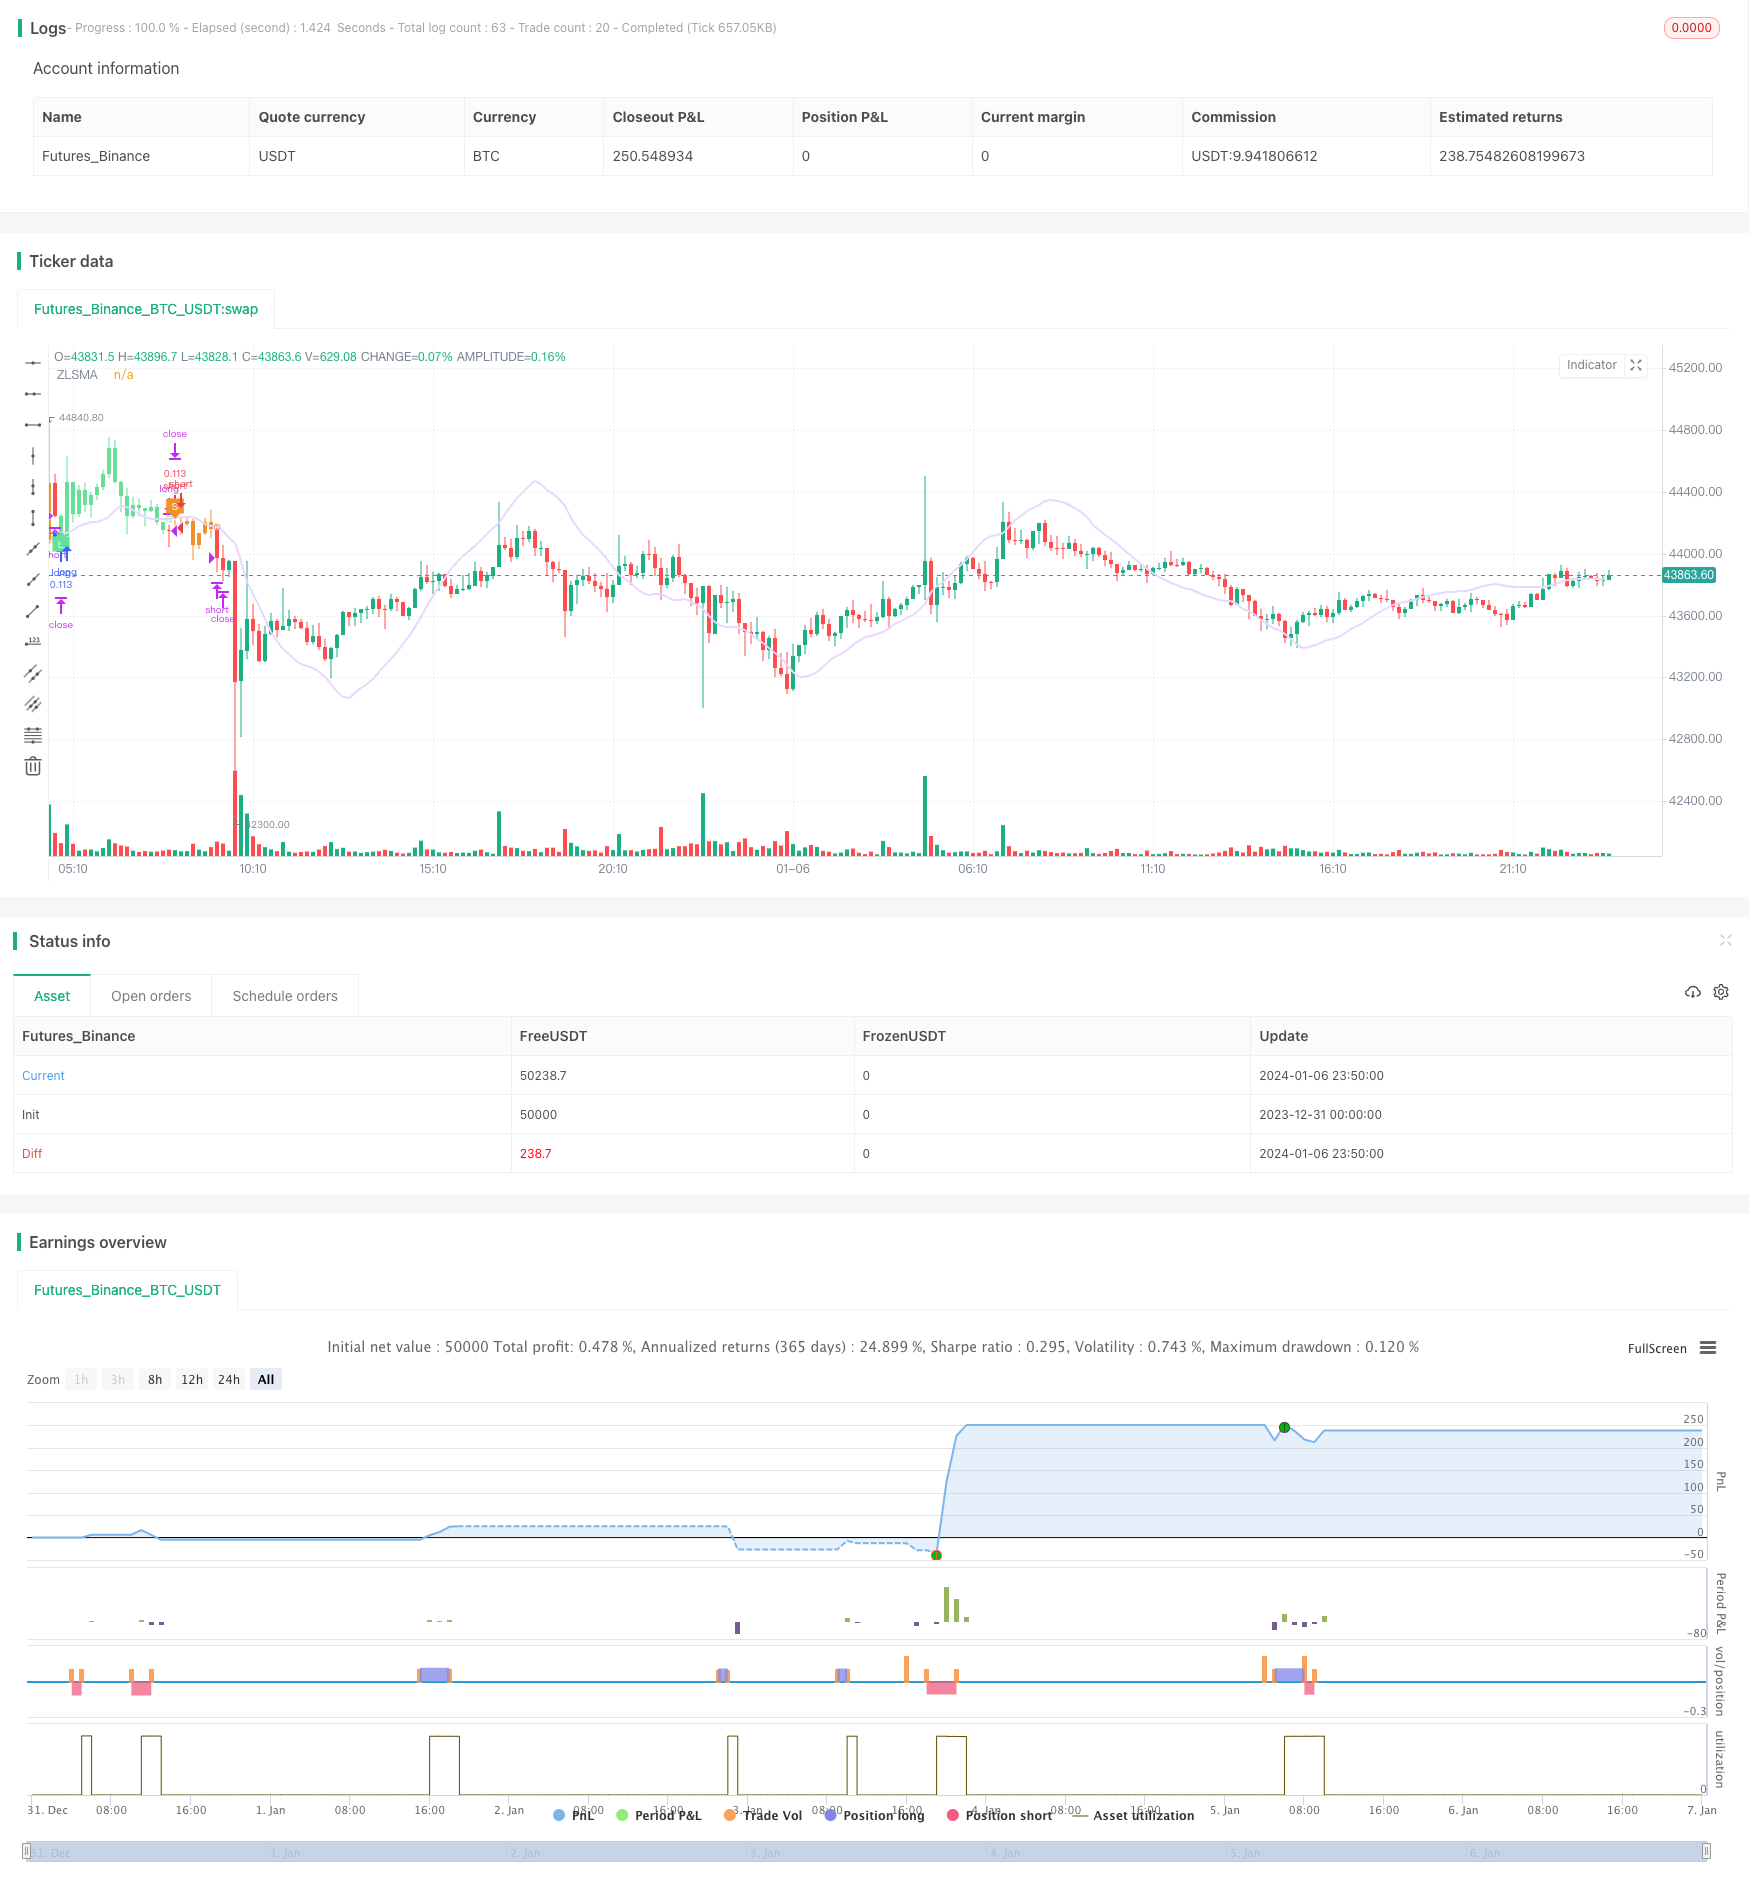
전략 원칙
이 전략은 두 가지 핵심 지표로 구성됩니다.
단일 지수 평행 이동 평균 ((SESMA): SESMA는 EMA의 생각을 모티브로 삼고, 동시에 파라미터를 개선하여 곡선을 더 부드럽게 만들고, 지연을 줄였다. SESMA의 방향과 가격 관계를 통해 가격 경향을 판단한다.
후속 중지 메커니즘: 최고 가격, 최저 가격 및 ATR 지표와 결합하여 실시간으로 다단계 및 공백의 중지 라인을 계산합니다. 이것은 시장의 변동성과 추세에 따라 중지 손실을 조정할 수 있는 동적으로 조정되는 중지 메커니즘입니다.
이 전략의 입장은 가격이 SESA를 뚫는 것에 기초하며, 출장 신호는 스톱 손실 라인에서 촉발됩니다. 표시를 표시하는지 여부를 설정할 수 있습니다.
전략적 이점
- SESMA 계산 방법의 개선으로, 효율적으로 지연을 줄일 수 있고, 흐름 캡처 능력을 향상시킬 수 있다.
- 후속 중지 메커니즘은 실시간 변동에 따라 중지 폭을 조정할 수 있으며, 중지 손실이 너무 느슨하거나 너무 가깝게되는 것을 방지합니다.
- 부속 시각 보조 판단 Entry 및 Exit 시간의 표시.
- 사용자 정의 가능한 파라미터, 다양한 품종과 파라미터 최적화에 적합하다.
위험과 최적화 방향
- 트렌드 반전 시에는 스톱로스가 발동되어 조기 퇴출이 발생할 수 있습니다. 스톱로스의 폭은 적절히 완화 될 수 있습니다.
- SESMA 파라미터는 최적의 길이를 찾기 위해 최적화됩니다.
- ATR 파라미터는 또한 다른 주기 길이를 테스트할 수 있다.
- 테스트가 표기된 효과를 보여준다는 것
요약하다
이 전략은 트렌드 판단과 위험 제어 지표를 통합하여 보다 견고한 트렌드 추적 전략을 형성한다. 간단한 이동 평균 전략에 비해 이 전략은 트렌드를 보다 유연하게 포착할 수 있으며, 동시에 회전을 줄일 수 있다. 매개 변수를 통해 최적화하면 전략이 다른 시장에서 더 나은 효과를 얻을 수 있다.
전략 소스 코드
/*backtest
start: 2023-12-31 00:00:00
end: 2024-01-07 00:00:00
period: 10m
basePeriod: 1m
exchanges: [{"eid":"Futures_Binance","currency":"BTC_USDT"}]
*/


//@version=5
// This source code is subject to the terms of the Mozilla Public License 2.0 at https://mozilla.org/MPL/2.0/
// © simwai
strategy('Chandelier Exit ZLSMA Strategy', shorttitle='CE_ZLSMA', overlay = true, initial_capital = 1000, default_qty_value = 10, default_qty_type = strategy.percent_of_equity, calc_on_every_tick = false, process_orders_on_close = true, commission_value = 0.075)

// -- Colors --
color maximumYellowRed = color.rgb(255, 203, 98) // yellow
color rajah = color.rgb(242, 166, 84) // orange
color magicMint = color.rgb(171, 237, 198)
color languidLavender = color.rgb(232, 215, 255)
color maximumBluePurple = color.rgb(181, 161, 226)
color skyBlue = color.rgb(144, 226, 244)
color lightGray = color.rgb(214, 214, 214)
color quickSilver = color.rgb(163, 163, 163)
color mediumAquamarine = color.rgb(104, 223, 153)
color carrotOrange = color.rgb(239, 146, 46)

// -- Inputs --
length = input(title='ATR Period', defval=1)
mult = input.float(title='ATR Multiplier', step=0.1, defval=2)
showLabels = input(title='Show Buy/Sell Labels ?', tooltip='Created by Chandelier Exit (CE)', defval=false)
isSignalLabelEnabled = input(title='Show Signal Labels ?', defval=true)
useClose = input(title='Use Close Price for Extrema ?', defval=true)
zcolorchange = input(title='Enable Rising/Decreasing Highlightning', defval=false)
zlsmaLength = input(title='ZLSMA Length', defval=50)
offset = input(title='Offset', defval=0)

// -- CE - Credits to @everget --
float haClose = float(1) / 4 * (open[1] + high[1] + low[1] + close[1])
atr = mult * ta.atr(length)[1]

longStop = (useClose ? ta.highest(haClose, length) : ta.highest(haClose, length)) - atr
longStopPrev = nz(longStop[1], longStop)
longStop := haClose > longStopPrev ? math.max(longStop, longStopPrev) : longStop

shortStop = (useClose ? ta.lowest(haClose, length) : ta.lowest(haClose, length)) + atr
shortStopPrev = nz(shortStop[1], shortStop)
shortStop := haClose < shortStopPrev ? math.min(shortStop, shortStopPrev) : shortStop

var int dir = 1
dir := haClose > shortStopPrev ? 1 : haClose < longStopPrev ? -1 : dir

buySignal = dir == 1 and dir[1] == -1
plotshape(buySignal and showLabels ? longStop : na, title='Buy Label', text='Buy', location=location.absolute, style=shape.labelup, size=size.tiny, color=mediumAquamarine, textcolor=color.white)
sellSignal = dir == -1 and dir[1] == 1
plotshape(sellSignal and showLabels ? shortStop : na, title='Sell Label', text='Sell', location=location.absolute, style=shape.labeldown, size=size.tiny, color=carrotOrange, textcolor=color.white)

changeCond = dir != dir[1]

// -- ZLSMA - Credits to @netweaver2011 --
lsma = ta.linreg(haClose, zlsmaLength, offset)
lsma2 = ta.linreg(lsma, zlsmaLength, offset)
eq = lsma - lsma2
zlsma = lsma + eq

zColor = zcolorchange ? zlsma > zlsma[1] ? magicMint : rajah : languidLavender
plot(zlsma, title='ZLSMA', linewidth=2, color=zColor)

// -- Signals --
var string isTradeOpen = ''
var string signalCache = ''

bool enterLong = buySignal and ta.crossover(haClose, zlsma)
bool exitLong = ta.crossunder(haClose, zlsma)
bool enterShort = sellSignal and ta.crossunder(haClose, zlsma)
bool exitShort = ta.crossover(haClose, zlsma)

if (signalCache == 'long entry')
    signalCache := ''
    enterLong := true
else if (signalCache == 'short entry')
    signalCache := ''
    enterShort := true

if (isTradeOpen == '')
    if (exitShort and (not enterLong))
        exitShort := false
    if (exitLong and (not enterShort))
        exitLong := false
    if (enterLong and exitShort)
        isTradeOpen := 'long'
        exitShort := false
    else if (enterShort and exitLong)
        isTradeOpen := 'short'
        exitLong := false
    else if (enterLong)
        isTradeOpen := 'long'
    else if (enterShort)
        isTradeOpen := 'short'
else if (isTradeOpen == 'long')
    if (exitShort)
        exitShort := false
    if (enterLong)
        enterLong := false
    if (enterShort and exitLong)
        enterShort := false
        signalCache := 'short entry'
    if (exitLong)
        isTradeOpen := ''
else if (isTradeOpen == 'short')
    if (exitLong)
        exitLong := false
    if (enterShort)
        enterShort := false
    if (enterLong and exitShort)
        enterLong := false
        signalCache := 'long entry'
    if (exitShort)
        isTradeOpen := ''

plotshape((isSignalLabelEnabled and enterLong) ? zlsma : na, title='LONG', text='L', style=shape.labelup, color=mediumAquamarine, textcolor=color.white, size=size.tiny, location=location.absolute)
plotshape((isSignalLabelEnabled and enterShort) ? zlsma : na, title='SHORT', text='S', style=shape.labeldown, color=carrotOrange, textcolor=color.white, size=size.tiny, location=location.absolute)
plotshape((isSignalLabelEnabled and exitLong) ? zlsma : na, title='LONG EXIT', style=shape.circle, color=magicMint, size=size.tiny, location=location.absolute)
plotshape((isSignalLabelEnabled and exitShort) ? zlsma : na, title='SHORT EXIT', style=shape.circle, color=rajah, size=size.tiny, location=location.absolute)

barcolor(color=isTradeOpen == 'long' ? mediumAquamarine : isTradeOpen == 'short' ? carrotOrange : na)

// -- Long Exits --
if (exitLong and strategy.position_size > 0)
    strategy.close('long', comment='EXIT_LONG')

// -- Short Exits --
if (exitShort and strategy.position_size < 0)
    strategy.close('short', comment='EXIT_SHORT')

// -- Long Entries --
if (enterLong)
    strategy.entry('long', strategy.long, comment='ENTER_LONG')

// -- Short Entries --
if (enterShort)
    strategy.entry('short', strategy.short, comment='ENTER_SHORT')