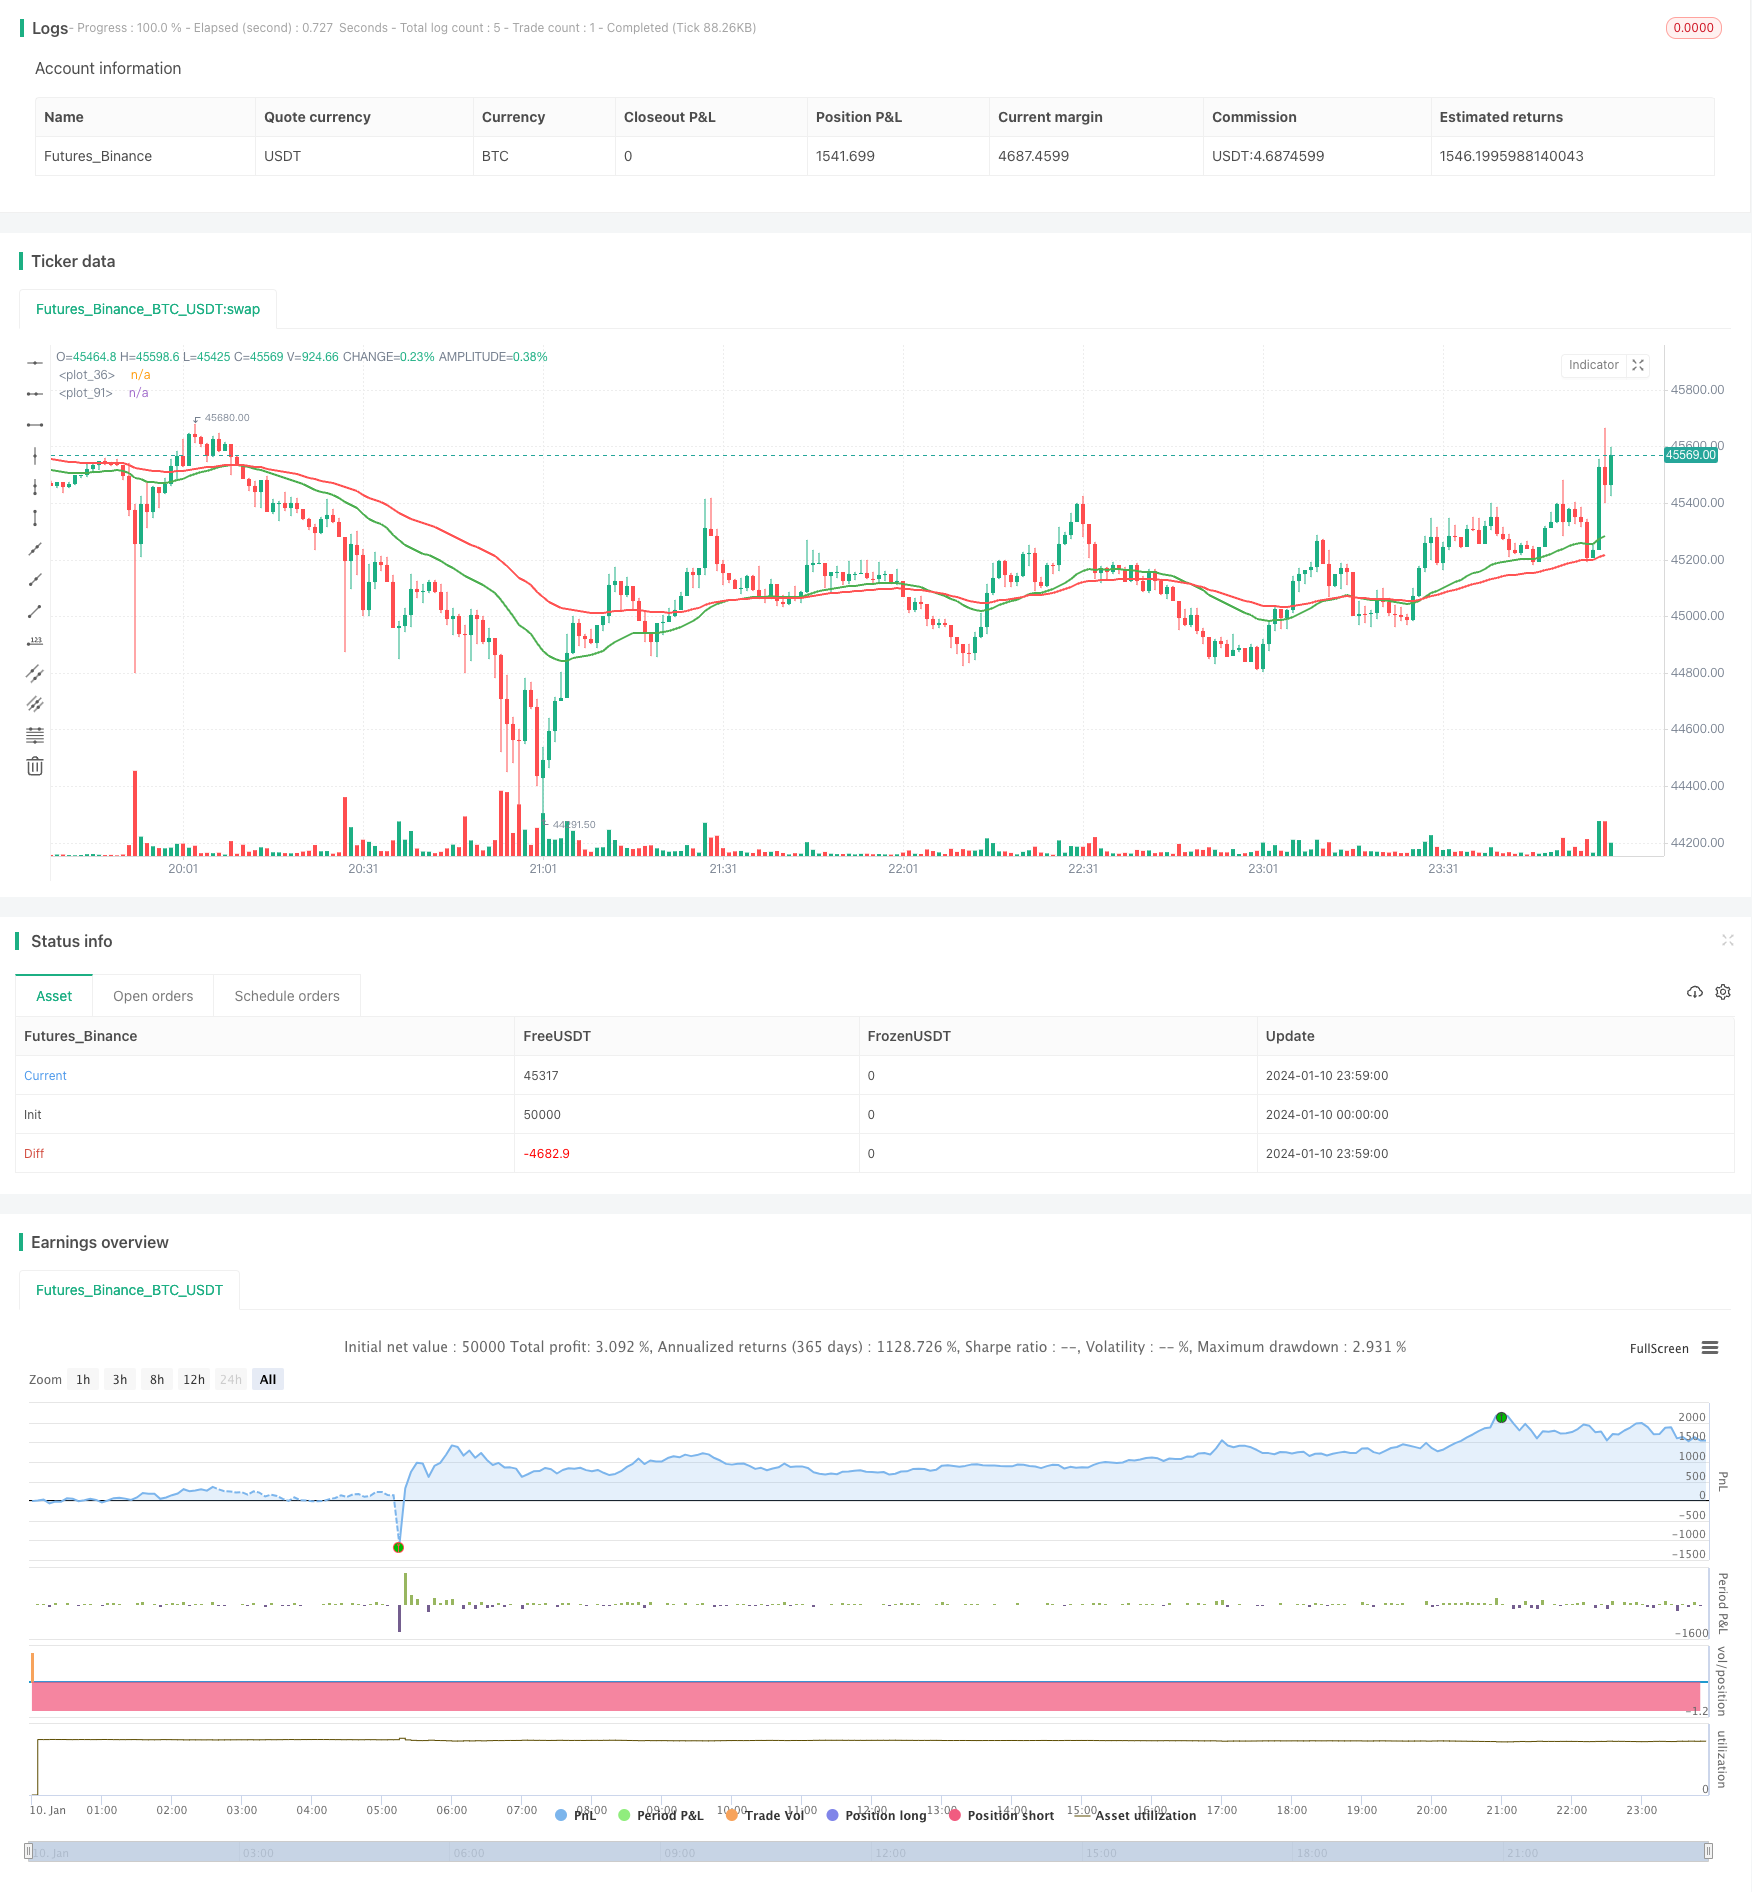
개요
이중 평행선 교차 전략은 전형적인 트렌드 추적 전략이다. 그것은 두 개의 다른 기간의 EMA 평균을 이용하고, 짧은 기간의 평균선 위에 긴 기간의 평균선을 통과할 때 더 많이 하고, 짧은 기간의 평균선 아래에 긴 기간의 평균선을 통과할 때 공백을 만들고, 가격 트렌드의 전환점을 포착한다.
전략 원칙
이 전략의 핵심 지표는 30주기 및 60주기 각각의 두 개의 EMA 평균선이다. 코드에서 사용자 정의 함수를 통해 두 개의 EMA 평균선을 계산한다:
emaLen1 = emaFuncOne(close, lenMA1)
emaLen2 = emaFuncTwo(close, lenMA2)
이 전략의 거래 신호는 두 개의 EMA 평행선의 교차로부터 나옵니다.
currentState = if emaLen2 > emaLen1
    0
else
    1

previousState = if emaLastLen2 > emaLastLen1
    0
else
    1

convergence = if currentState != previousState
    1
else
    0
단기 EMA 위에 장기 EMA를 착용할 때, currentState는 previousState와 동일하지 않으며, 교차 신호가 나타난다. 이 때 더 많이 한다. 단기 EMA 아래에서 장기 EMA를 통과할 때, currentState는 previousState와 동일하지 않으며, 교차 신호가 발생한다. 이 때 공백한다.
우위 분석
이 전략은 다음과 같은 장점을 가지고 있습니다.
- 전략적 아이디어는 간단하고 직관적이며, 이해하기 쉽고 실행이 가능합니다.
- EMA의 평평한 특성을 활용하여 시장 소음을 효과적으로 필터링합니다.
- 트렌드를 자동으로 추적하여 매매를 놓치지 않습니다.
위험 분석
이 전략에는 몇 가지 위험도 있습니다.
- 쌍방향 교차 신호가 지연되어 전환을 적시에 잡지 못할 수 있습니다.
- 지진이 발생했을 때 여러번의 잘못된 신호가 나타날 수 있습니다.
- 잘못 설정된 매개 변수는 너무 민감하거나 너무 지연될 수 있습니다.
EMA 주기를 조정하거나 필터링 조건을 추가하여 최적화 할 수 있습니다.
최적화 방향
이 전략은 다음과 같은 부분에서 최적화될 수 있습니다.
- 다양한 길이의 EMA 주기의 조합을 테스트합니다.
- 거래량이나 변동률을 증가시키는 조건이 가짜 신호를 필터링한다
- MACD와 같은 다른 지표와 함께 확인된 추세
- 자금 관리를 최적화하고, 손실을 막기
요약하다
쌍평선 교차 전략은 전체적으로 간단하고 실용적인 트렌드 추적 전략이다. 그것은 straight-forward, 구현하기 쉬운, 자동으로 트렌드를 추적할 수 있다. 그러나 또한 약간의 지연, 가짜 신호의 위험이 있다. 매개 변수를 최적화하고 필터 조건을 추가함으로써 더 개선될 수 있으며, 이를 양적 거래의 기본 전략 중 하나로 만들 수 있다.
/*backtest
start: 2024-01-10 00:00:00
end: 2024-01-11 00:00:00
period: 1m
basePeriod: 1m
exchanges: [{"eid":"Futures_Binance","currency":"BTC_USDT"}]
*/

//@version=2
strategy("ParkerMAStrat", overlay=true)

lenMA1=input(title="Length 1", defval=30)
lenMA2=input(title="Length 2",  defval=60)

x = 0

checkLines(current, last) =>

    if current > last
        x = 1
    else
        x = 0
    x


//plot ema based on len1
emaFuncOne(src, time_period) =>

    alpha = 2 / (time_period + 1)
    // we have defined the alpha function above
    ema = 0.0
    // this is the initial declaration of ema, since we dont know the first ema we will declare it to 0.0 [as a decimal]
    ema := alpha * src + (1 - alpha) * nz(ema[1])
    // this returns the computed ema at the current time
    // notice the use of : (colon) symbol before =, it symbolises, that we are changing the value of ema,
    // since the ema was previously declared to 0
    // this is called mutable variale declaration in pine script
    ema
    // return ema from the function

emaLen1 = emaFuncOne(close, lenMA1)


plot(emaLen1, color=green, transp=0, linewidth=2)
// now we plot the _10_period_ema

//plot ema based on len2
emaFuncTwo(src, time_period) =>

    alpha = 2 / (time_period + 1)
    // we have defined the alpha function above
    ema = 0.0
    // this is the initial declaration of ema, since we dont know the first ema we will declare it to 0.0 [as a decimal]
    ema := alpha * src + (1 - alpha) * nz(ema[1])
    // this returns the computed ema at the current time
    // notice the use of : (colon) symbol before =, it symbolises, that we are changing the value of ema,
    // since the ema was previously declared to 0
    // this is called mutable variale declaration in pine script
    ema
    // return ema from the function

//plot ema based on len2
emaFuncOneLast(src, time_period) =>

    alpha = 2 / (time_period + 1)
    // we have defined the alpha function above
    ema = 0.0
    // this is the initial declaration of ema, since we dont know the first ema we will declare it to 0.0 [as a decimal]
    ema := alpha * src + (1 - alpha) * nz(ema[0])
    // this returns the computed ema at the current time
    // notice the use of : (colon) symbol before =, it symbolises, that we are changing the value of ema,
    // since the ema was previously declared to 0
    // this is called mutable variale declaration in pine script
    ema
    // return ema from the function

//plot ema based on len2
emaFuncTwoLast(src, time_period) =>

    alpha = 2 / (time_period + 1)
    // we have defined the alpha function above
    ema = 0.0
    // this is the initial declaration of ema, since we dont know the first ema we will declare it to 0.0 [as a decimal]
    ema := alpha * src + (1 - alpha) * nz(ema[0])
    // this returns the computed ema at the current time
    // notice the use of : (colon) symbol before =, it symbolises, that we are changing the value of ema,
    // since the ema was previously declared to 0
    // this is called mutable variale declaration in pine script
    ema
    // return ema from the function


emaLastLen1 = emaFuncOneLast(close, lenMA1)
emaLastLen2 = emaFuncTwoLast(close, lenMA2)
emaLen2 = emaFuncTwo(close, lenMA2)


plot(emaLen2, color=red, transp=30, linewidth=2)
// now we plot the _10_period_ema

//now we compare the two and when green crosses red we buy/sell (line1 vs line2)

previousState = if emaLastLen2 > emaLastLen1
    0
else
    1

currentState = if emaLen2 > emaLen1
    0
else
    1

convergence = if currentState != previousState
    1
else
    0


lineCheck = if convergence == 1
    checkLines(currentState, previousState)

if lineCheck == 1
    strategy.entry("Long", strategy.long)
else
    strategy.entry("Short", strategy.short)