개요
이 전략은 CCI 지표의 중심점을 사용하여 동적인 지원 및 저항 지점을 계산하고, 트렌드 판단과 결합하여 구매 및 판매 신호를 찾습니다. 이 전략은 CCI의 반전 특성과 트렌드 추적 능력을 결합하여 중기 트렌드에 대한 반전을 포착하여 수익을 창출합니다.
전략 원칙
CCI 지표는 시장이 너무 약하거나 너무 강하다는 것을 표시할 수 있으며, 80과 80의 두 가지 한계 값은 시장이 과매매 상태에 진입했는지 판단하는 데 사용할 수 있습니다. 이 전략은 CCI의 이 특성을 활용하여 왼쪽과 왼쪽의 각 50 K 선의 허브를 계산하여 상부 허브와 하부 허브를 얻습니다. 그리고 허브의 기초에 감축 충격을 줄이는 지역의 역동성을 구축하는 저항 선과 지지선을 추가합니다.
종결 가격이 개시 가격보다 높고 상위 지지선보다 낮을 때 구매 신호를 생성하고 종결 가격이 개시 가격보다 낮고 하위 저항선보다 높을 때 판매 신호를 생성한다. 비주류 트렌드 방향을 필터링하기 위해 거래 신호를 필터링하기 위해 전략은 EMA와 기울기 지표와 결합하여 현재 주류 트렌드 방향을 판단한다. 트렌드가 다목으로 판단될 때만 구매를 하고, 트렌드가 공허로 판단될 때만 판매를 한다.
스톱로즈와 스톱은 ATR 지표의 동적 계산에 기초하여 이 전략의 위험 통제도 합리적으로 만든다.
우위 분석
- CCI 지표의 반전 특성을 활용하여 반전 지점 근처에서 거래하는 것을 선택하여 수익을 올릴 확률을 높인다.
- 동향을 판단하고, 역동적인 동작을 피하고, 손실을 줄여라.
- 다이내믹 스피드 스 (Dynamic Stop Loss Stopper) 설정은 위험을 보다 합리적으로 통제할 수 있도록 합니다.
- CCI 주기, 완충 구역 크기 등과 같은 사용자 정의 가능한 파라미터는 더 많은 시장 환경에 적합합니다.
위험 분석
- CCI 지표는 가짜 신호를 발생하기 쉽다. 트렌드 필터링을 결합해야 한다.
- 이 회전은 반드시 성공할 수 없으며, 손실의 위험이 있다.
- 잘못된 매개 변수 설정으로 인해 거래가 너무 빈번하거나 거래 기회를 놓치게 될 수 있습니다.
변수를 최적화하고, 스톱 로즈 범위를 조정하는 방법과 같은 방법으로 위험을 줄일 수 있습니다. 또한, 이 전략은 다른 지표의 보조 도구로도 사용할 수 있으며, 거래 신호에 전적으로 의존하지 않아도됩니다.
최적화 방향
- 버퍼 영역의 크기를 최적화하여 다양한 변동률 시장에 적합합니다.
- 더 정확한 동적 정지 손실을 위해 ATR 주기 변수를 최적화하십시오.
- 다른 CCI 변수 설정을 시도해 보세요.
- 다른 유형의 트렌드 판단 지표의 효과를 테스트하십시오.
요약하다
이 전략은 CCI 지표의 다공간 필터링 능력과 추세 판단의 필터링 확인을 통합하여 실제 가치가 있습니다. 동적 상쇄도 실제 응용에서 전략을 위험 제어 할 수 있습니다. 매개 변수를 최적화하고 개선하여 더 나은 효과를 얻을 수 있습니다.
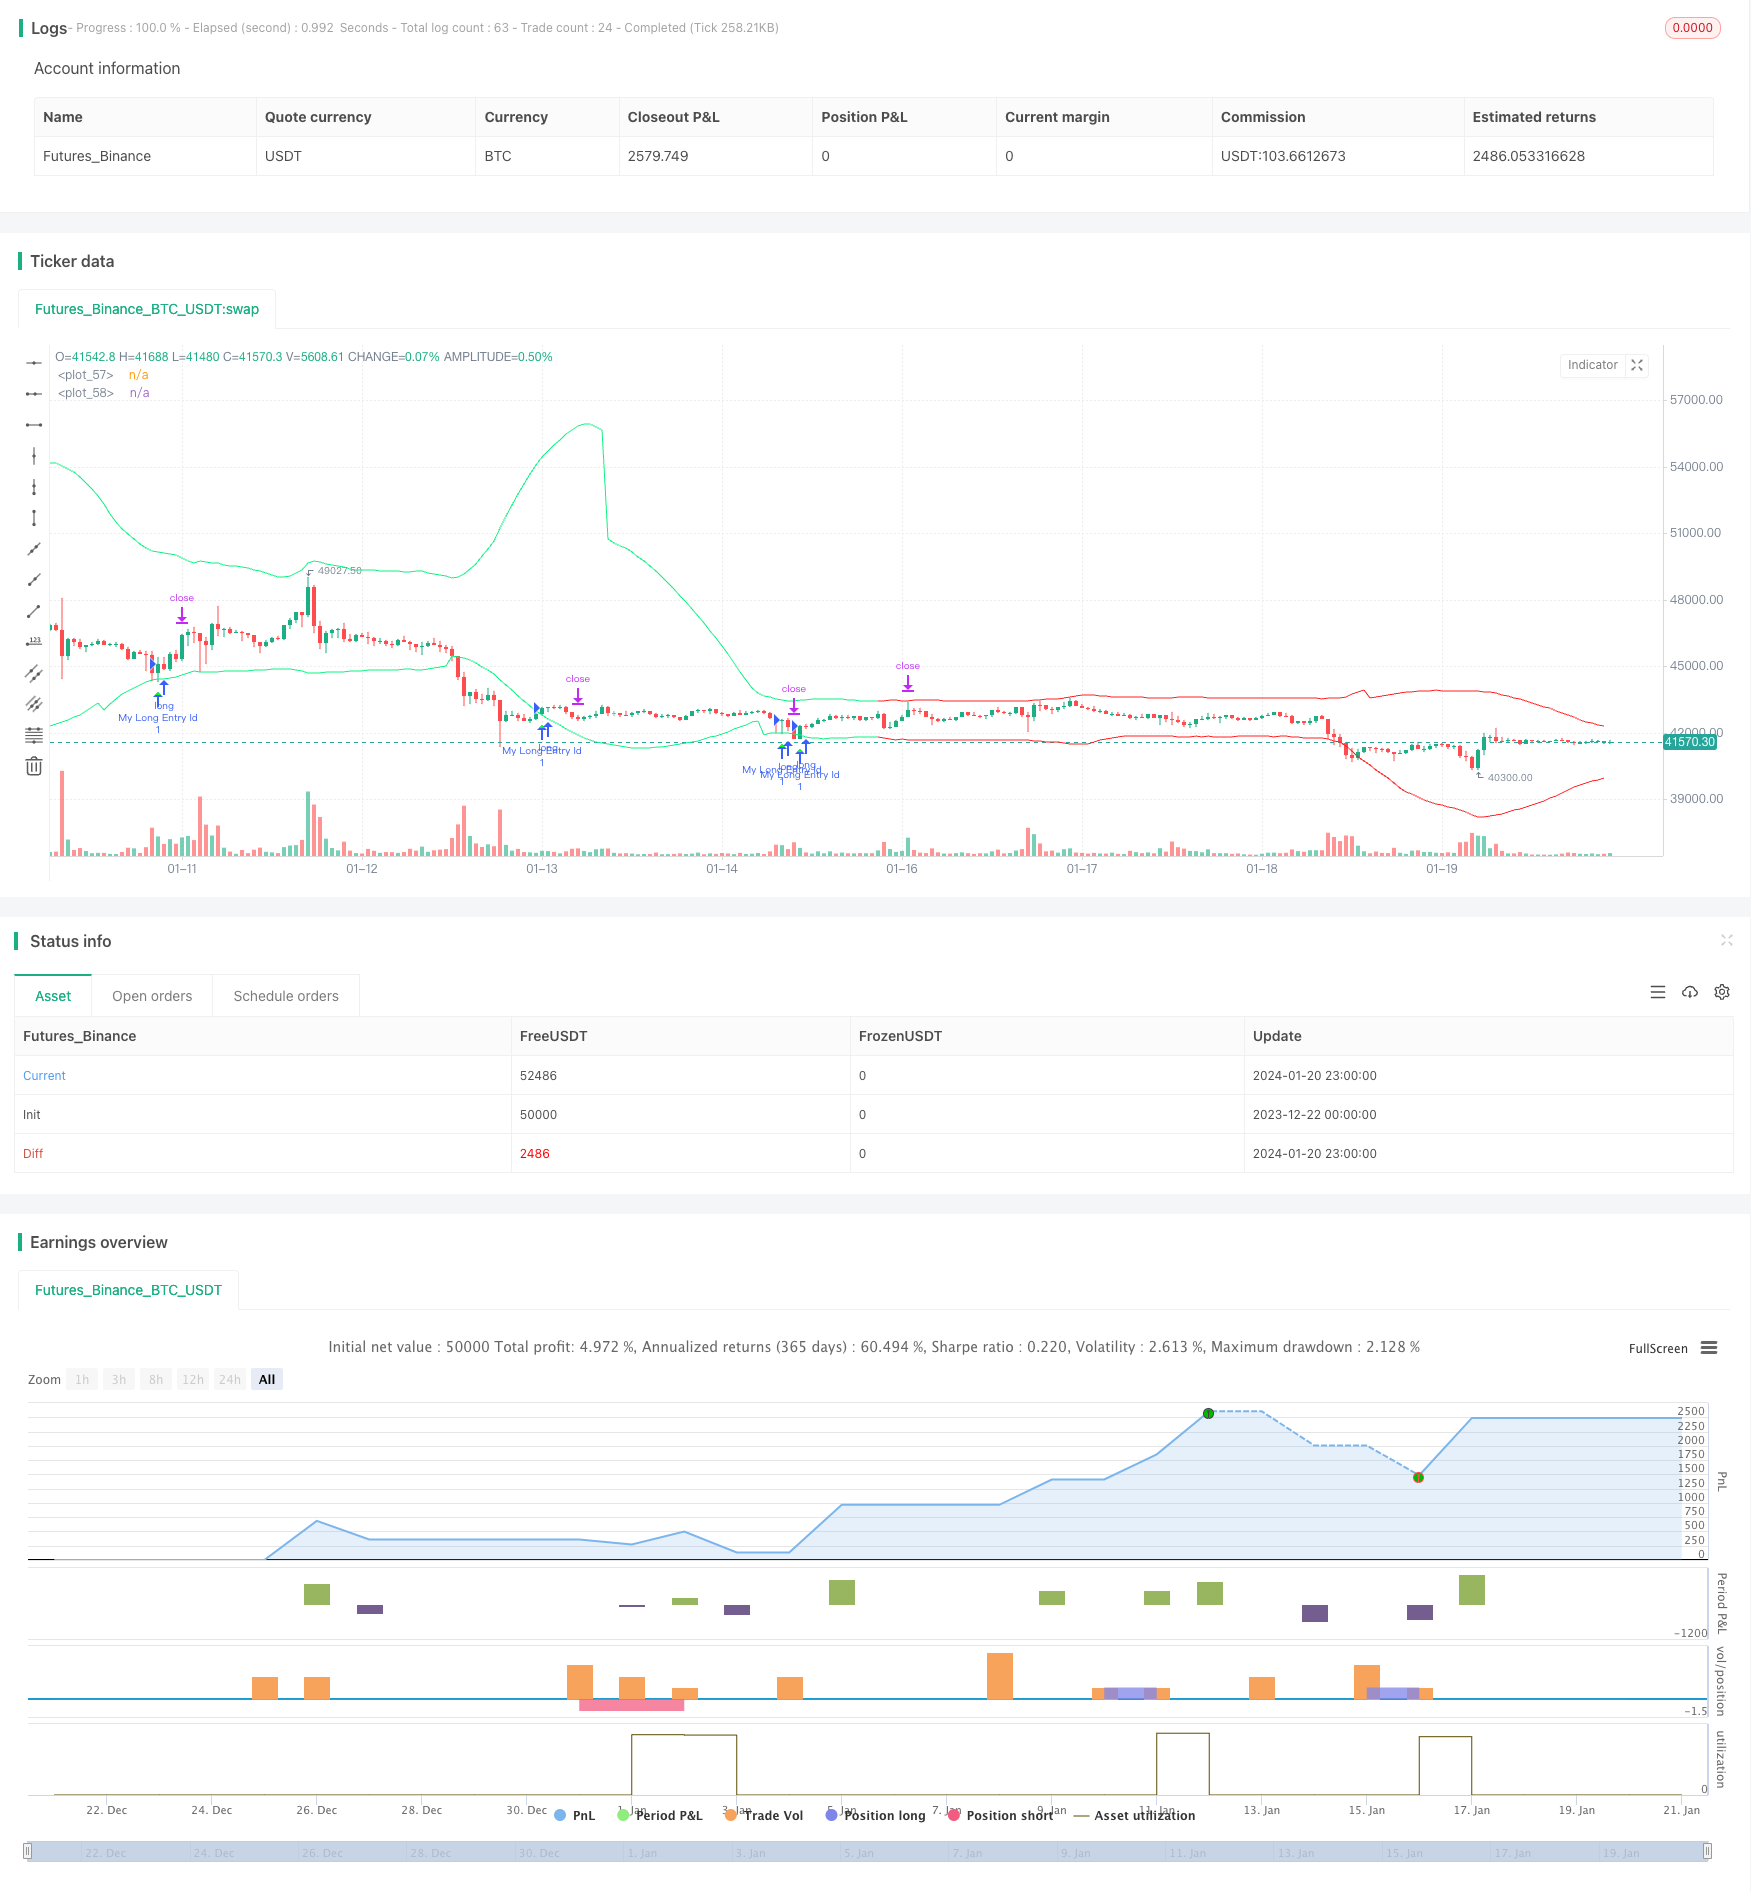
/*backtest
start: 2023-12-22 00:00:00
end: 2024-01-21 00:00:00
period: 1h
basePeriod: 15m
exchanges: [{"eid":"Futures_Binance","currency":"BTC_USDT"}]
*/

// This Pine Script™ code is subject to the terms of the Mozilla Public License 2.0 at https://mozilla.org/MPL/2.0/
// © AliSignals


//@version=5
strategy("CCI based support and resistance strategy", overlay=true  )


cci_length = input.int(50, "cci length")
right_pivot = input.int(50, "right pivot")
left_pivot = input.int(50, "left pivot")
buffer = input.float(10.0, "buffer")
trend_matter = input.bool(true, "trend matter?")
showmid = input.bool ( false , "show mid?")
trend_type = input.string("cross","trend type" ,options = ["cross","slope"])
slowma_l = input.int(100, "slow ma length")
fastma_l = input.int(50, "fast ma length")
slope_l = input.int(5,  "slope's length for trend detection")
ksl = input.float(1.1)
ktp = input.float(2.2)
restf = input.timeframe(title="Time Frame of Last Period for Calculating max" , defval="D")


// Calculating Upper and Lower CCI
cci = ta.cci(hlc3,cci_length)

uppercci = 0.0
lowercci = 0.0

uppercci := fixnan(ta.pivothigh(cci, left_pivot, right_pivot)) - buffer
lowercci := fixnan(ta.pivotlow (cci, left_pivot, right_pivot)) + buffer
midccci  = math.avg(uppercci,lowercci)


// Support and Resistance based on CCI
res = uppercci*(0.015*ta.dev(hlc3,cci_length))+ ta.sma(hlc3,cci_length)
sup = lowercci*(0.015*ta.dev(hlc3,cci_length))+ ta.sma(hlc3,cci_length)
mid =  midccci*(0.015*ta.dev(hlc3,cci_length))+ ta.sma(hlc3,cci_length)


// Calculating trend
t_cross  = 0
t_cross := ta.ema(close,fastma_l) > ta.ema(close,slowma_l) ? 1 : ta.ema(close,fastma_l) < ta.ema(close,slowma_l) ? -1 : t_cross[1]

t_slope  = 0
t_slope := ta.ema(close,slowma_l) > ta.ema(close,slowma_l)[slope_l] ? 1 : ta.ema(close,slowma_l) < ta.ema(close,slowma_l)[slope_l]  ? -1 : t_slope[1]

t  = 0
t := trend_type == "cross" ? t_cross : trend_type == "slope" ? t_slope : na

colort =  trend_matter == false ? color.rgb(201, 251, 0) : t == 1 ? color.rgb(14, 243, 132) :  t == -1 ? color.rgb(255, 34, 34) : na
bull_t = trend_matter == false or t ==  1
bear_t = trend_matter == false or t == -1

plot(res, color = colort)
plot(sup, color = colort)
plot(showmid == true ? mid : na)


// Long and Short enter condition
buy  = bull_t == 1 and ta.lowest (2) < sup and close > open and close > sup
sell = bear_t == 1 and ta.highest(2) > res and close < open and close < res

plotshape( buy , color=color.rgb(6, 255, 23) , location = location.belowbar, style = shape.triangleup  , size = size.normal)
plotshape( sell, color=color.rgb(234, 4, 4) ,  location = location.abovebar, style = shape.triangledown, size = size.normal)


atr = ta.atr(100)


CLOSE=request.security(syminfo.tickerid, restf, close)
max = 0.0
max := CLOSE == CLOSE[1] ? math.max(max[1], atr) : atr
act_atr = 0.0
act_atr := CLOSE == CLOSE[1] ? act_atr[1] : max[1]

atr1 =  math.max(act_atr, atr)

dis_sl = atr1 * ksl
dis_tp = atr1 * ktp


var float longsl  = open[1] - dis_sl
var float shortsl = open[1] + dis_sl
var float longtp =   open[1] + dis_tp
var float shorttp =  open[1] - dis_tp


longCondition = buy
if (longCondition)
    strategy.entry("My Long Entry Id", strategy.long)

shortCondition = sell
if (shortCondition)
    strategy.entry("My Short Entry Id", strategy.short)


longsl  := strategy.position_size > 0  ? longsl[1]  : close - dis_sl
shortsl := strategy.position_size < 0 ? shortsl[1] : close + dis_sl
longtp  := strategy.position_size > 0  ? longtp[1]  : close + dis_tp
shorttp := strategy.position_size < 0 ? shorttp[1] : close - dis_tp


if strategy.position_size > 0
    strategy.exit(id="My Long close Id", from_entry ="My Long Entry Id" , stop=longsl, limit=longtp)
if strategy.position_size < 0
    strategy.exit(id="My Short close Id", from_entry ="My Short Entry Id" , stop=shortsl, limit=shorttp)