피트 웨이브 거래 시스템 전략 개요
피트 웨이브 트레이딩 시스템 전략은 가격의 빠르고 느린 이동 평균을 사용하여 거래 신호를 구성하고 추가 필터와 중지 메커니즘과 결합하여 더욱 최적화한다. 이 전략은 중간 단선 트렌드를 포착하여 가격 평균을 교차하여 구매 및 판매 신호를 생성한다. 코드에는 가짜 돌파구를 방지하기 위해 돌파구 확인 필터, K선 실물 필터, ATR 필터, 회귀 필터 등의 메커니즘이 포함되어 있습니다.
피트 웨이브 거래 시스템 전략 원리
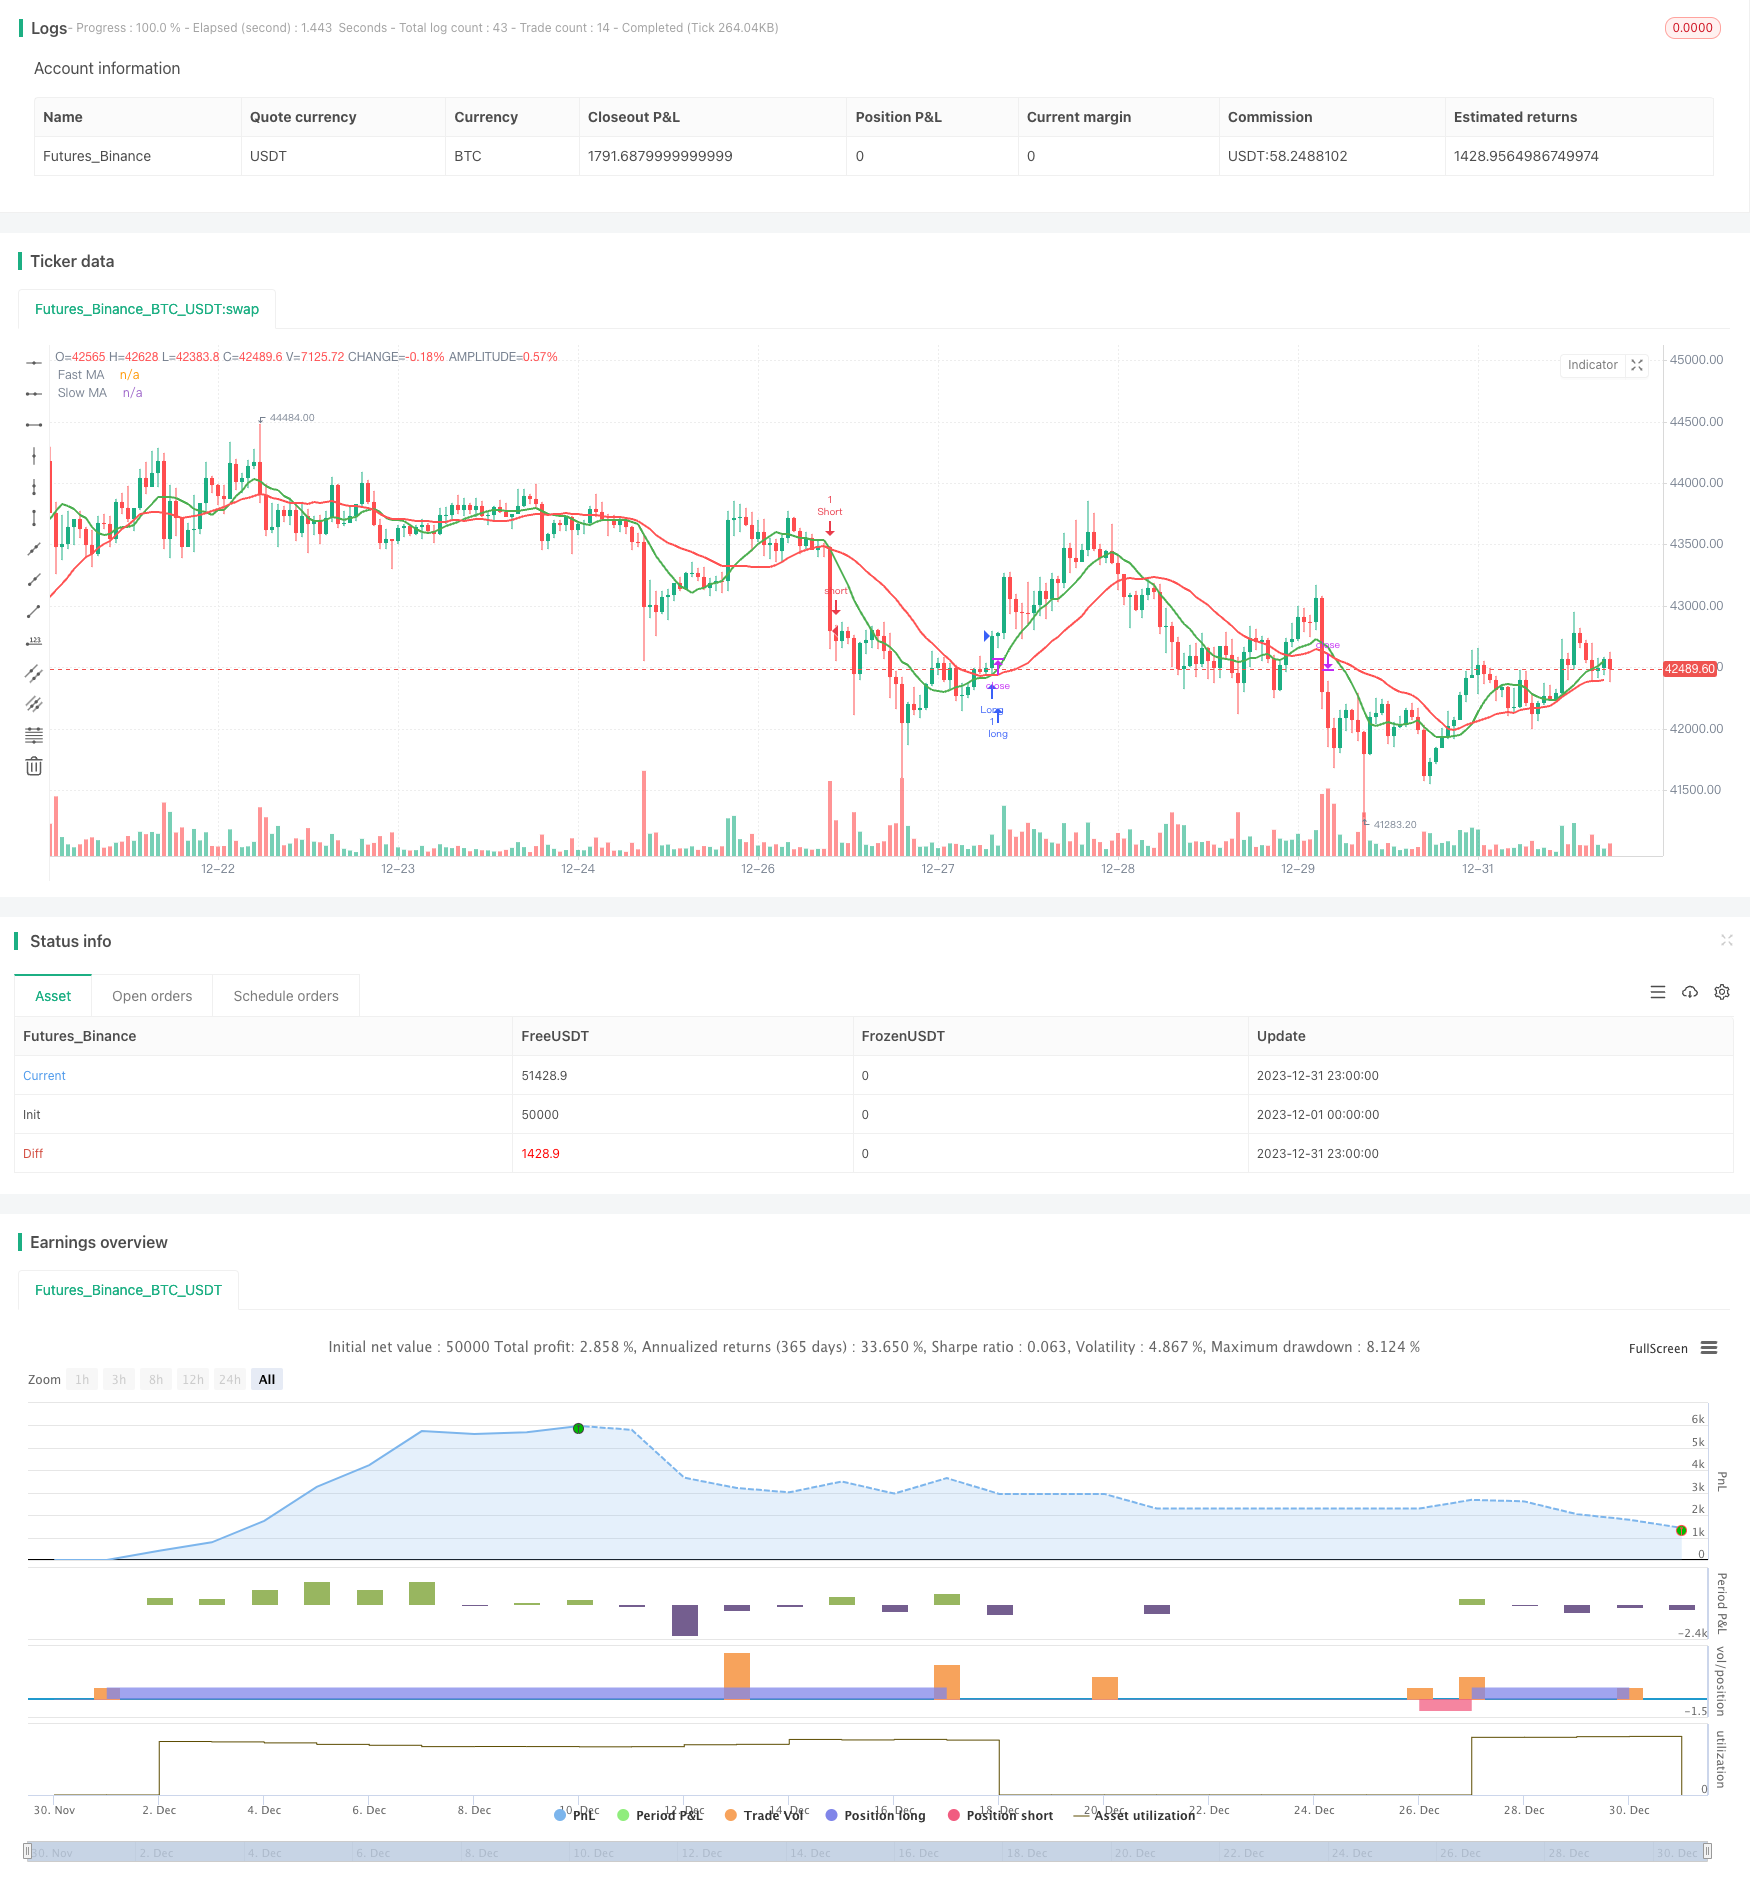
이 전략은 빠른 이동 평균 ((길이 9) 와 느린 이동 평균 ((길이 22) 를 사용하여 금 포크 ((빠른 라인에 느린 라인을 통과) 와 죽은 포크 ((빠른 라인 아래에 느린 라인을 통과) 의 거래 신호를 구성한다. 빠른 라인이 아래에서 느린 라인을 통과하면 구매 신호가 발생하고 빠른 라인이 위에서 아래로 느린 라인을 통과하면 판매 신호가 발생한다.
가격 변동으로 인한 가짜 돌파구를 방지하기 위해 코드에 추가적인 필터링 메커니즘이 추가되었습니다. 여기에는 K선 엔티티 필터가 포함되어 있으며, K선 엔티티의 비율이 0.5%보다 큰 변동이 신호를 생성하기 위해 필요합니다. 회귀 필터, 빠른 라인 및 가격 라인이 교차 할 때 가격이 어느 정도의 회귀가 있는지 판단하여 흐름을 확인합니다. ATR 값 필터, ATR이 0.5보다 큰 변동이 신호를 생성하기에 충분하다는 것을 증명하기 위해 필요합니다.
신호가 생성된 후, 브레이크 확인 필터를 켜면, 현재 종료 가격이 이전 N 루트 K 라인의 최고 가격이나 최저 가격을 뚫었는지 여부를 판단하여 브레이크를 확인합니다. 마지막으로, 이 전략은 슬라이드 포인트 스톱 손실 메커니즘을 통해 수익을 잠금하고, 지분 평균 가격의 일정 비율에 따라 스톱 손실 위치를 이동합니다.
피터 웨이브 거래 시스템 전략 우위 분석
이 전략은 이동 평균 거래와 트렌드 추적의 장점을 통합하여 중단계 가격 트렌드의 방향을 효과적으로 식별할 수 있습니다. 단일 평평선 교차 시스템과 비교하여 부가 필터와 결합하면 가짜 신호의 가능성을 크게 줄일 수 있습니다. 구체적인 장점은 다음과 같습니다.
동선과 동선과 동선을 횡단하여 동향 추적을 통해 동력 동력 동력 동력 동력 동력 동력 동력 동력 동력 동력 동력 동력 동력 동력 동력 동력 동력 동력 동력 동력 동력 동력 동력 동력 동력 동력 동력 동력 동력 동력 동력 동력 동력 동력 동력 동력 동력 동력 동력 동력 동력 동력 동력 동력 동력 동력 동력 동력 동력 동력 동력 동력 동력 동력 동력 동력 동력 동력 동력 동력 동력 동력 동력 동력 동력 동력 동력 동력 동력 동력 동력 동력 동력 동력 동력 동력 동력 동력 동력 동력 동력 동력 동력 동력 동력 동력 동력 동력
회귀 필터와 돌파 확인 메커니즘은 가짜 돌파를 방지할 수 있다.
ATR값, K선 엔티티 필터는 실제 변동을 식별하는 데 도움이됩니다.
슬라이드 포인트 스톱 로스 메커니즘은 단편적 손실을 효과적으로 제어할 수 있다.
피트 웨이브 거래 시스템 전략 위험 분석
이 전략의 주요 위험은 다음과 같습니다.
실행의 갑작스러운 사건으로 인해 스톱 피해가 니다. 스톱 피해 거리는 적절히 완화할 수 있습니다.
지분 보유 기간이 너무 길고 조기 종료되지 않아 평균주기를 단축할 수 있다.
평온기, 거래 신호 축소. 필터링 기준을 적절히 낮출 수 있다.
매개 변수 최적화가 적절하지 않아 거래가 너무 자주 또는 적게 이루어집니다. 매개 변수를 반복적으로 테스트해야합니다.
피터 웨이브 거래 시스템 전략 최적화 방향
이 전략은 다음과 같은 방향으로 최적화될 수 있습니다.
다른 거래 품종에 따라 각각 테스트 파라미터, 최적화 이동 평균 주기 등의 파라미터.
트렌드 방향에 대해 판단하기 위해 더 많은 지표들, 예를 들어, 브린 밴드, RSI 등과 같은 지표들을 추가해보세요.
스포드 메커니즘의 파라미터를 테스트하여 최적의 스포드 비율을 찾습니다.
기계학습과 같은 방법을 사용해 자동으로 구매/판매 신호를 생성하는 것을 시도해보세요.
신호 필터링 논리를 최적화하여 가짜 신호의 가능성을 낮춘다.
다른 시기를 고려하여 더 많은 거래 기회를 발견할 수 있습니다.
피트 웨이브 거래 시스템 전략 요약
피트 웨이브 거래 시스템 전략은 이동 평균 교차, 트렌드 추적, 필터 등을 통합하여 안정적이고 신뢰할 수 있는 중단 거래 전략을 구성한다. 단일 기술 지표에 비해 이 전략은 가격 변동으로 인한 노이즈 거래를 현저하게 줄일 수 있다. 추가된 필터 메커니즘은 가짜 돌파의 위험을 피할 수 있다. 매개 변수 테스트와 규칙 최적화를 통해 이 전략은 일일 단선 거래의 강력한 도구가 될 수 있다.
/*backtest
start: 2023-12-01 00:00:00
end: 2023-12-31 23:59:59
period: 1h
basePeriod: 15m
exchanges: [{"eid":"Futures_Binance","currency":"BTC_USDT"}]
*/

//@version=5
strategy("9:22 5 MIN 15 MIN BANKNIFTY", overlay=true)

fastLength = input(9, title="Fast MA Length")
slowLength = input(22, title="Slow MA Length")
atrLength = input(14, title="ATR Length")
atrFilter = input(0.5, title="ATR Filter")
trailingStop = input(1.5, title="Trailing Stop Percentage")
pullbackThreshold = input(0.5, title="Pullback Threshold")
minCandleBody = input(0.5, title="Minimum Candle Body Percentage")
breakoutConfirmation = input(true, title="Use Breakout Confirmation")

price = close
mafast = ta.sma(price, fastLength)
maslow = ta.sma(price, slowLength)

atrValue = ta.atr(atrLength)

long_entry = ta.crossover(mafast, maslow) and atrValue > atrFilter
short_entry = ta.crossunder(mafast, maslow) and atrValue > atrFilter

// Pullback Filter
pullbackLong = ta.crossover(price, mafast) and ta.change(price) <= -pullbackThreshold
pullbackShort = ta.crossunder(price, mafast) and ta.change(price) >= pullbackThreshold

// Include pullback condition only if a valid entry signal is present
long_entry := long_entry and (pullbackLong or not ta.crossover(price, mafast))
short_entry := short_entry and (pullbackShort or not ta.crossunder(price, mafast))

// Filter based on candle body size
validLongEntry = long_entry and ta.change(price) > 0 and ta.change(price) >= minCandleBody
validShortEntry = short_entry and ta.change(price) < 0 and ta.change(price) <= -minCandleBody

// Breakout confirmation filter
breakoutLong = breakoutConfirmation ? (close > ta.highest(high, fastLength)[1]) : true
breakoutShort = breakoutConfirmation ? (close < ta.lowest(low, fastLength)[1]) : true

long_entry := validLongEntry and breakoutLong
short_entry := validShortEntry and breakoutShort

if (long_entry)
    strategy.entry("Long", strategy.long)
    strategy.close("Short")
    alert("Long trade iniated")

if (short_entry)
    strategy.entry("Short", strategy.short)
    strategy.close("Long")
    alert("Short trade initated")

// Trailing Stop-Loss
long_stop = strategy.position_avg_price * (1 - trailingStop / 100)
short_stop = strategy.position_avg_price * (1 + trailingStop / 100)
strategy.exit("Exit Long", "Long", stop = long_stop)
strategy.exit("Exit Short", "Short", stop = short_stop)

plot(mafast, color=color.green, linewidth=2, title="Fast MA")
plot(maslow, color=color.red, linewidth=2, title="Slow MA")