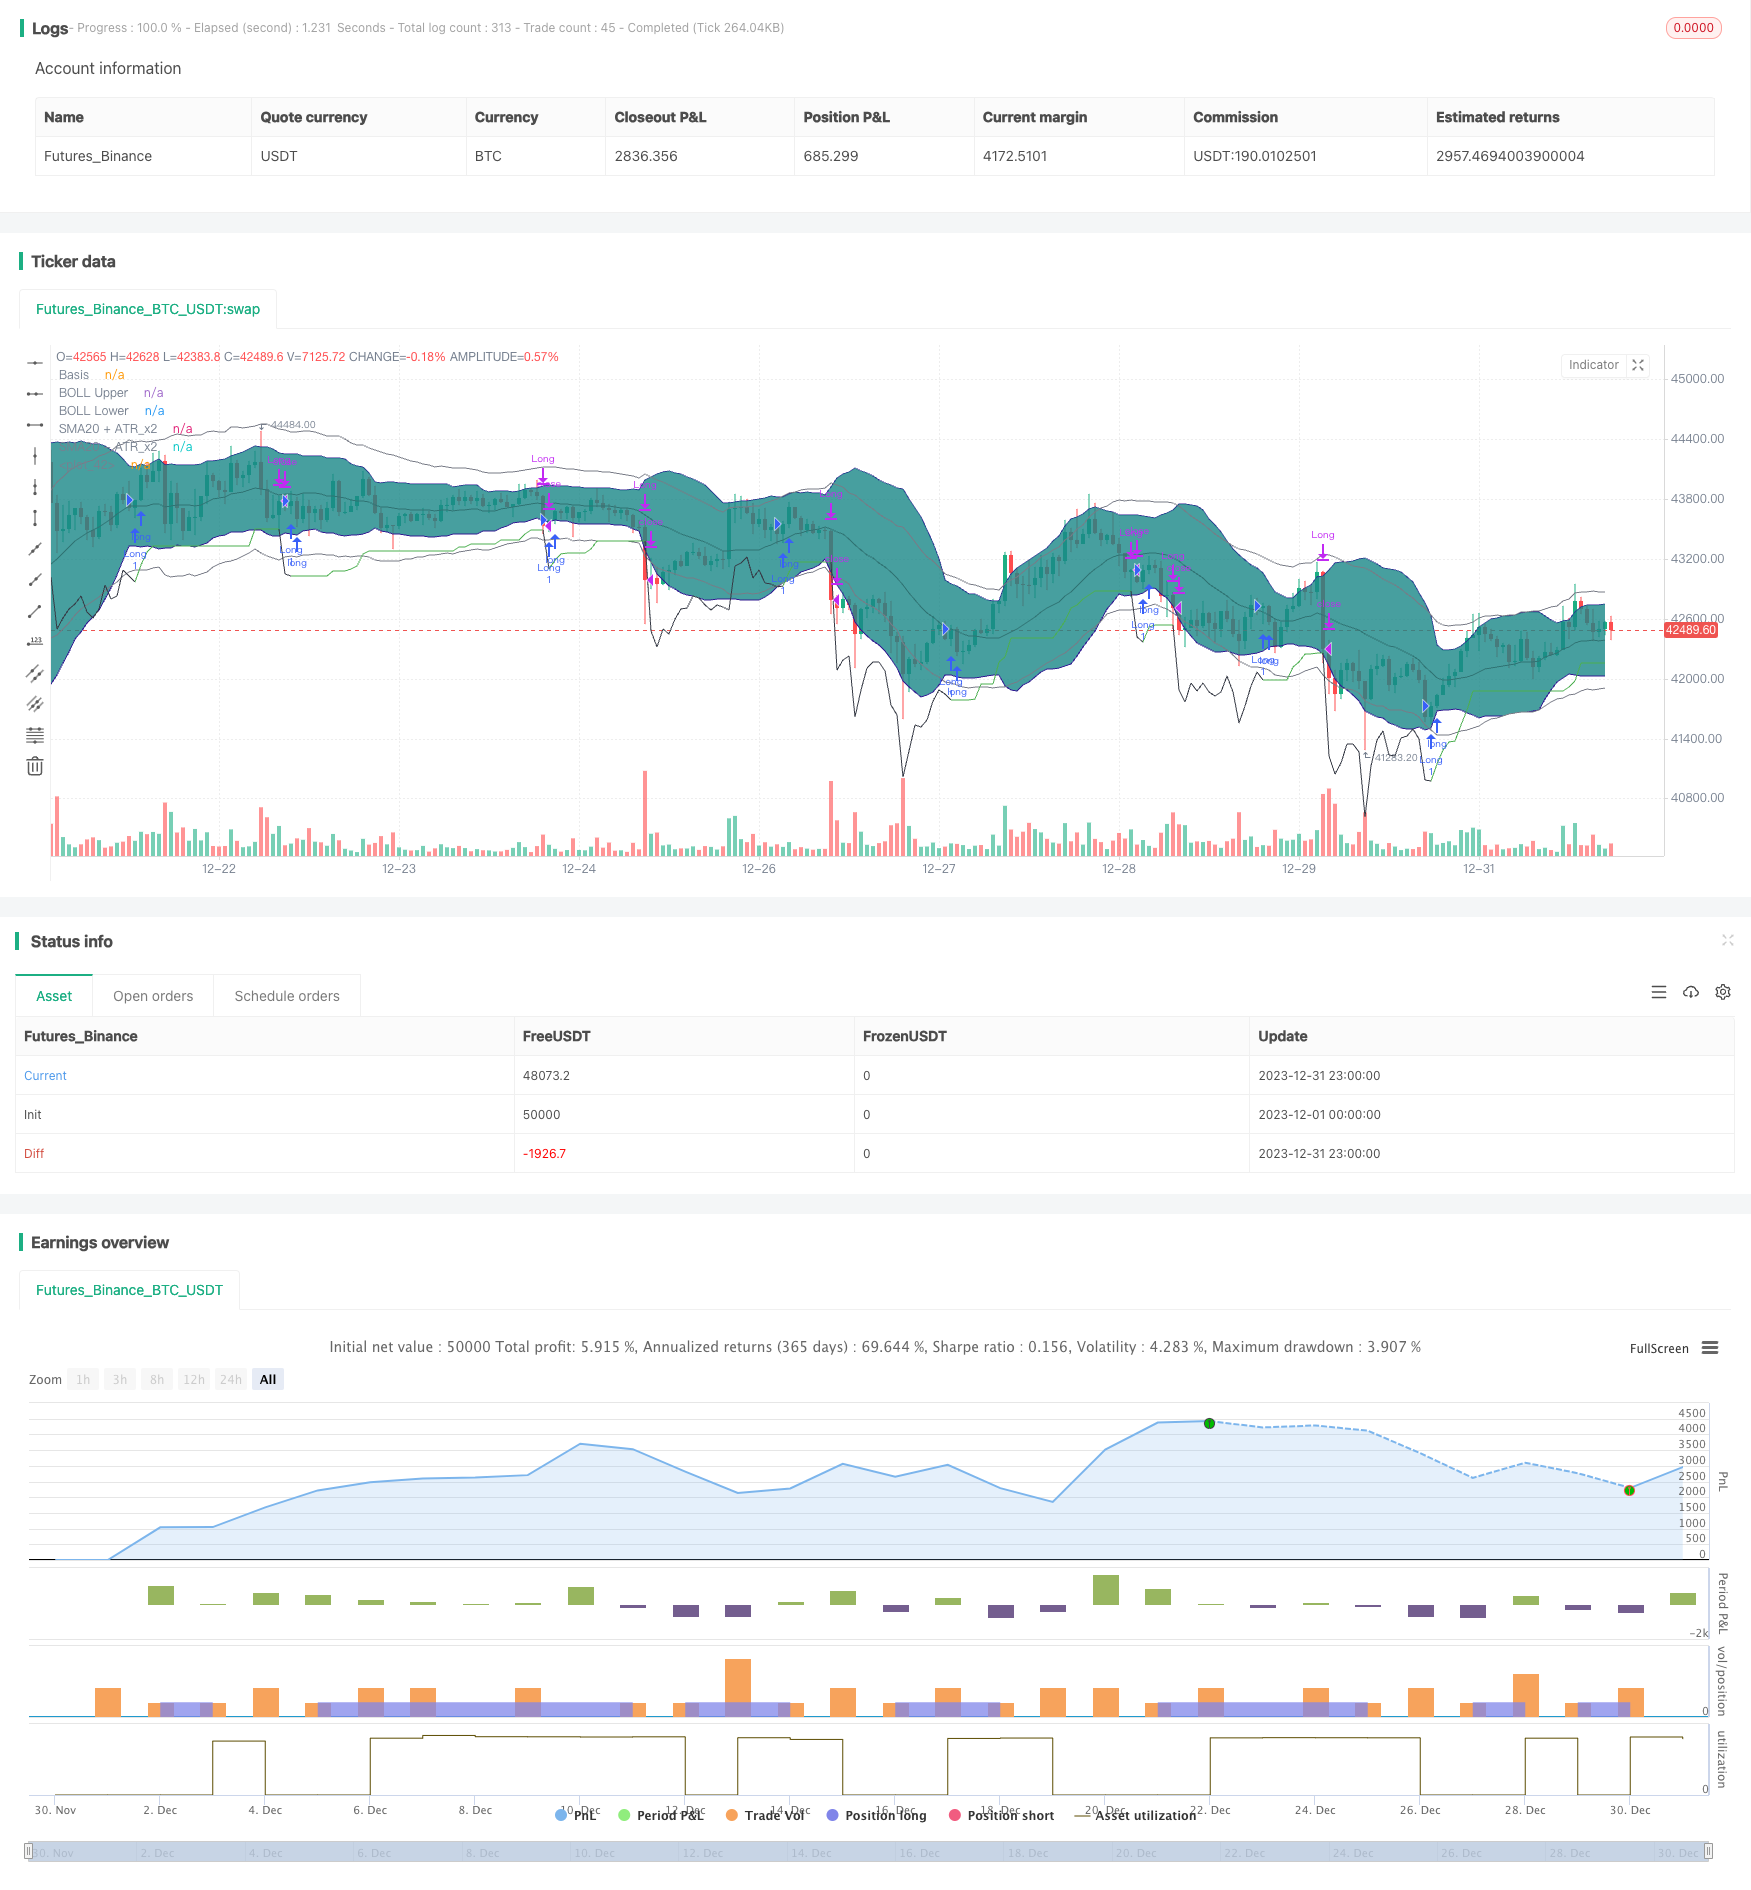
개요
이 전략은 부린띠와 상대적으로 강한 지표 ((RSI)) 의 조합을 사용하여 부린띠 수축 기간이 RSI 상승과 일치하는 기회를 식별하고, 위험을 제어하기 위해 트렌드 추적 스톱을 사용합니다.
전략 원칙
이 전략의 거래 논리 핵심은 부린 반의 축소를 식별하고 RSI가 상승하는 동안 추세가 상승 초기에 있다고 판단하는 것입니다. 특히 20 일 부린 반의 중간 궤도에 있는 표준이 ATR보다 작을 때*2시, 우리는 부린이 수축한다고 판단하고, 10일과 14일 RSI가 상승한다면, 우리는 부린을 돌파할 것이라고 예측하고, 여러 전략을 사용합니다.
경기장에 들어가면 ATR 안전 거리 + 가격 상승에 따른 손실 방식을 사용하여 수익을 잠금하고 위험을 통제합니다. 가격이 스톱 라인을 초과하거나 RSI가 너무 뜨거워지면 (RSI가 14 일 이상 70, RSI가 10 일 이상 14 일 이상)
우위 분석
이 전략의 가장 큰 장점은 RSI 지표가 예측하는 가격의 돌파 방향을 결합하여 부린 밴드 수축을 사용하여 시장을 정리하는 기간을 판단하는 데 있습니다. 또한, 고정된 스톱 대신 적응 스톱을 사용하여 시장의 변동 정도에 따라 유연하게 조정 할 수 있으므로 위험을 통제 할 수 있다는 전제를 보장하면서 더 큰 수익을 얻을 수 있습니다.
위험 분석
이 전략의 주요 위험은 부린띠 수축과 RSI 상승을 식별할 때, 시장이 가짜 브레이크가 될 수 있다는 것입니다. 또한, 중단 측면에서, 과도한 변동이 있을 때 적응적 인 중단이 제 시간에 중단되지 않을 수 있습니다. 중단 방법을 개선하여 (예: 곡선 중단) 이 위험을 줄일 수 있습니다.
최적화 방향
이 전략은 다음과 같은 부분에서 최적화될 수 있습니다.
부린 대역 변수 설정을 개선하여 압축 효과를 최적화합니다.
다른 RSI 주기 변수를 시도합니다.
다른 손해 방지 방법의 효과를 테스트하기 (곡선 손해 방지, 회전 손해 방지 등)
다양한 품종 특성에 따라 변수를 조정
요약하다
이 전략은 브린 밴드와 RSI의 상호보완성을 종합적으로 활용하여 위험을 통제하는 전제 하에 더 나은 회수 수익률을 얻습니다. 후속적으로 중지 방법, 매개 변수 선택 등의 측면에서 최적화하여 전략이 다른 거래 품종에 더 적합하도록합니다.
/*backtest
start: 2023-12-01 00:00:00
end: 2023-12-31 23:59:59
period: 1h
basePeriod: 15m
exchanges: [{"eid":"Futures_Binance","currency":"BTC_USDT"}]
*/

// This source code is subject to the terms of the Mozilla Public License 2.0 at https://mozilla.org/MPL/2.0/
// © DojiEmoji
//

//@version=4
strategy("[KL] BOLL + RSI Strategy",overlay=true,pyramiding=1)

// Timeframe {
backtest_timeframe_start = input(defval = timestamp("01 Apr 2016 13:30 +0000"), title = "Backtest Start Time", type = input.time)
USE_ENDTIME = input(false,title="Define backtest end-time (If false, will test up to most recent candle)")
backtest_timeframe_end = input(defval = timestamp("01 May 2021 19:30 +0000"), title = "Backtest End Time (if checked above)", type = input.time)
within_timeframe = true
// }

// Bollinger bands (sdv=2, len=20) {
BOLL_length = 20, BOLL_src = close, SMA20 = sma(BOLL_src, BOLL_length), BOLL_sDEV_x2 = 2 * stdev(BOLL_src, BOLL_length)
BOLL_upper = SMA20 + BOLL_sDEV_x2, BOLL_lower = SMA20 - BOLL_sDEV_x2
plot(SMA20, "Basis", color=#872323, offset = 0)
BOLL_p1 = plot(BOLL_upper, "BOLL Upper", color=color.navy, offset = 0, transp=50)
BOLL_p2 = plot(BOLL_lower, "BOLL Lower", color=color.navy, offset = 0, transp=50)
fill(BOLL_p1, BOLL_p2, title = "Background", color=#198787, transp=85)
// }

// Volatility Indicators {
ATR_x2 = atr(BOLL_length) * 2 // multiplier aligns with BOLL
avg_atr = sma(ATR_x2, input(1,title="No. of candles to lookback when determining ATR is decreasing"))
plot(SMA20+ATR_x2, "SMA20 + ATR_x2", color=color.gray, offset = 0, transp=50)
plot(SMA20-ATR_x2, "SMA20 - ATR_x2", color=color.gray, offset = 0, transp=50)
plotchar(ATR_x2, "ATR_x2", "", location = location.bottom)
//}

// Trailing stop loss {
TSL_source = low
var entry_price = float(0), var stop_loss_price = float(0)

trail_profit_line_color = color.green
if strategy.position_size == 0 or not within_timeframe
    trail_profit_line_color := color.black
    stop_loss_price := TSL_source - ATR_x2
else if strategy.position_size > 0
    stop_loss_price := max(stop_loss_price, TSL_source - ATR_x2)
plot(stop_loss_price, color=trail_profit_line_color)

if strategy.position_size > 0 and stop_loss_price > stop_loss_price[1]
	alert("Stop loss limit raised", alert.freq_once_per_bar)

// } end of Trailing stop loss

//Buy setup - Long positions {
is_squeezing = ATR_x2 > BOLL_sDEV_x2
if is_squeezing and within_timeframe and not is_squeezing[1]
	alert("BOLL bands are squeezing", alert.freq_once_per_bar)
else if not is_squeezing and within_timeframe and is_squeezing[1]
	alert("BOLL bands stopped squeezing", alert.freq_once_per_bar)

ema_trend = ema(close, 20)

concat(a, b) =>
	concat = a
	if a != ""
		concat := concat + ", "
	concat := concat + b
	concat
// }

// Sell setup - Long position {
rsi_10 = rsi(close, 10), rsi_14 = rsi(close, 14)
overbought = rsi_14 > input(70,title="[Exit] RSI(14) value considered as overbought") and rsi_10 > rsi_14
// } end of Sell setup - Long position

// MAIN: {
if within_timeframe
	entry_msg = ""
	exit_msg = ""

    // ENTRY {
	conf_count = 0
    volat_decr = avg_atr <= avg_atr[1]
	rsi_upslope = rsi_10 > rsi_10[1] and rsi_14 > rsi_14[1]

	if volat_decr and rsi_upslope and is_squeezing and strategy.position_size == 0
		strategy.entry("Long",strategy.long, comment=entry_msg)
		entry_price := close
		stop_loss_price := TSL_source - ATR_x2
	// }

    // EXIT	{
	if strategy.position_size > 0
		bExit = false
		if close <= entry_price and TSL_source <= stop_loss_price
            exit_msg := concat(exit_msg, "stop loss [TSL]")
			bExit := true
        else if close > entry_price and TSL_source <= stop_loss_price
            exit_msg := concat(exit_msg, "take profit [TSL]")
            bExit := true
		else if overbought
			exit_msg := concat(exit_msg, "overbought")
			bExit := true

        strategy.close("Long", when=bExit, comment=exit_msg)
	// }
// }

// CLEAN UP:
if strategy.position_size == 0 and not is_squeezing
	entry_price := 0
	stop_loss_price := float(0)