개요
이 전략은 부린 밴드, RSI, ADX, MACD 등 여러 지표를 사용하여 시장 추세를 판단하여 강력한 추세 식별 능력을 갖는다. 지표 신호가 동시에 bullish일 때, 추적 전략을 취한다. 지표 신호가 동시에 bearish일 때, 평소 포지 손실한다.
전략 원칙
- 브린 띠를 사용하여 가격이 브린 띠의 오프트레일 또는 오프트레일 근처에 있는지 판단하여 트렌드가 형성되는지 판단합니다.
- RSI와 결합하여 과매매 영역에 있는지 판단하여 가짜 돌파구를 피하십시오.
- ADX를 사용하여 트렌드 강도를 판단하고, 트렌드 강도가 강할 때만 신호를 발산합니다.
- MACD를 사용하여 단기 및 장기 동향의 일치성을 판단합니다.
- 일간 시간대와 결합하여 지정된 거래 시간대에만 거래
다중 지표 포지션을 통해 판단하여 가격 추세를 정확하게 식별하고, 추세가 발생했을 때 적시에 추적하여 초과 수익을 달성하십시오.
우위 분석
이 전략의 가장 큰 장점은 지표의 조합을 판단하는 것이 포괄적이고 정확하기 때문에 가격 추세를 효과적으로 식별하고 단일 지표로 인해 발생하는 잘못된 신호를 피할 수 있다는 것입니다.
특히, 장점은 다음과 같습니다:
- 브린띠는 가격 변동의 범위와 강도를 판단할 수 있다.
- RSI는 과매도구역을 피하고 과매도구역을 매각한다.
- ADX는 동향의 강도를 판단하고, 동향의 강도를 따릅니다.
- MACD는 짧은 선과 긴 선의 일치성을 판단합니다.
- 거래시간을 제한하여 밤새의 위험을 피하십시오.
지표의 조합을 통해 판단하면, 가짜 신호를 최대한 줄이고, 전략의 안정성을 강화할 수 있다.
위험 분석
이 전략의 주요 위험은 다음과 같습니다.
- 급격한 사건으로 인해 지표가 작동하지 않습니다.
- 이번 지진으로 인해 많은 가짜 신호가 발생했습니다.
위험 1에 대해, 여러 지표에 의존하기 때문에 단일 지표의 실패 문제를 어느 정도 피할 수 있지만, 여전히 위험 관리 장치를 개선해야 한다.
리스크 2에 대해, 적절한 수치를 조정하여 거래 범위를 줄이고 거래 빈도를 줄이고 위험을 줄일 수 있습니다.
최적화 방향
이 전략의 주요 최적화 방향은 다음과 같습니다.
- 이동 상쇄, 시간 상쇄, 돌파 상쇄와 같은 상쇄 메커니즘을 추가하여 너무 깊게 회수하지 마십시오.
- 최적화 변수, 지표 변수 조합을 조정, 최적의 변수를 찾아
- 교류량 필터링과 같은 필터링 조건을 추가하여 소량의 가짜 돌파구를 피합니다.
- KDJ, OBV 등과 같은 더 많은 지표와 결합하여 신호 정확도를 향상시킵니다.
- 기계 학습 방법을 사용하여 자동 최적화 매개 변수
계속적인 최적화를 통해 전략 변수의 튼튼성을 높이고, 잘못된 신호의 가능성을 줄여줍니다.
요약하다
이 전략은 전체적으로 트렌드 신호를 식별하는 데 강한 능력을 가지고 있으며, 지표 조합을 통해 가격 트렌드를 효과적으로 식별 할 수 있습니다.
그러나 또한 특정 위험이 있습니다. 장기적으로 안정적인 운영을 위해 지속적으로 풍력 제어 메커니즘을 개선하고 매개 변수를 지속적으로 최적화해야합니다. 후기에는 기계 학습과 같은 방법을 도입하여 매개 변수를 자동으로 최적화 할 수 있다면 전략의 거친성과 수익 능력을 크게 향상시킬 수 있습니다.
/*backtest
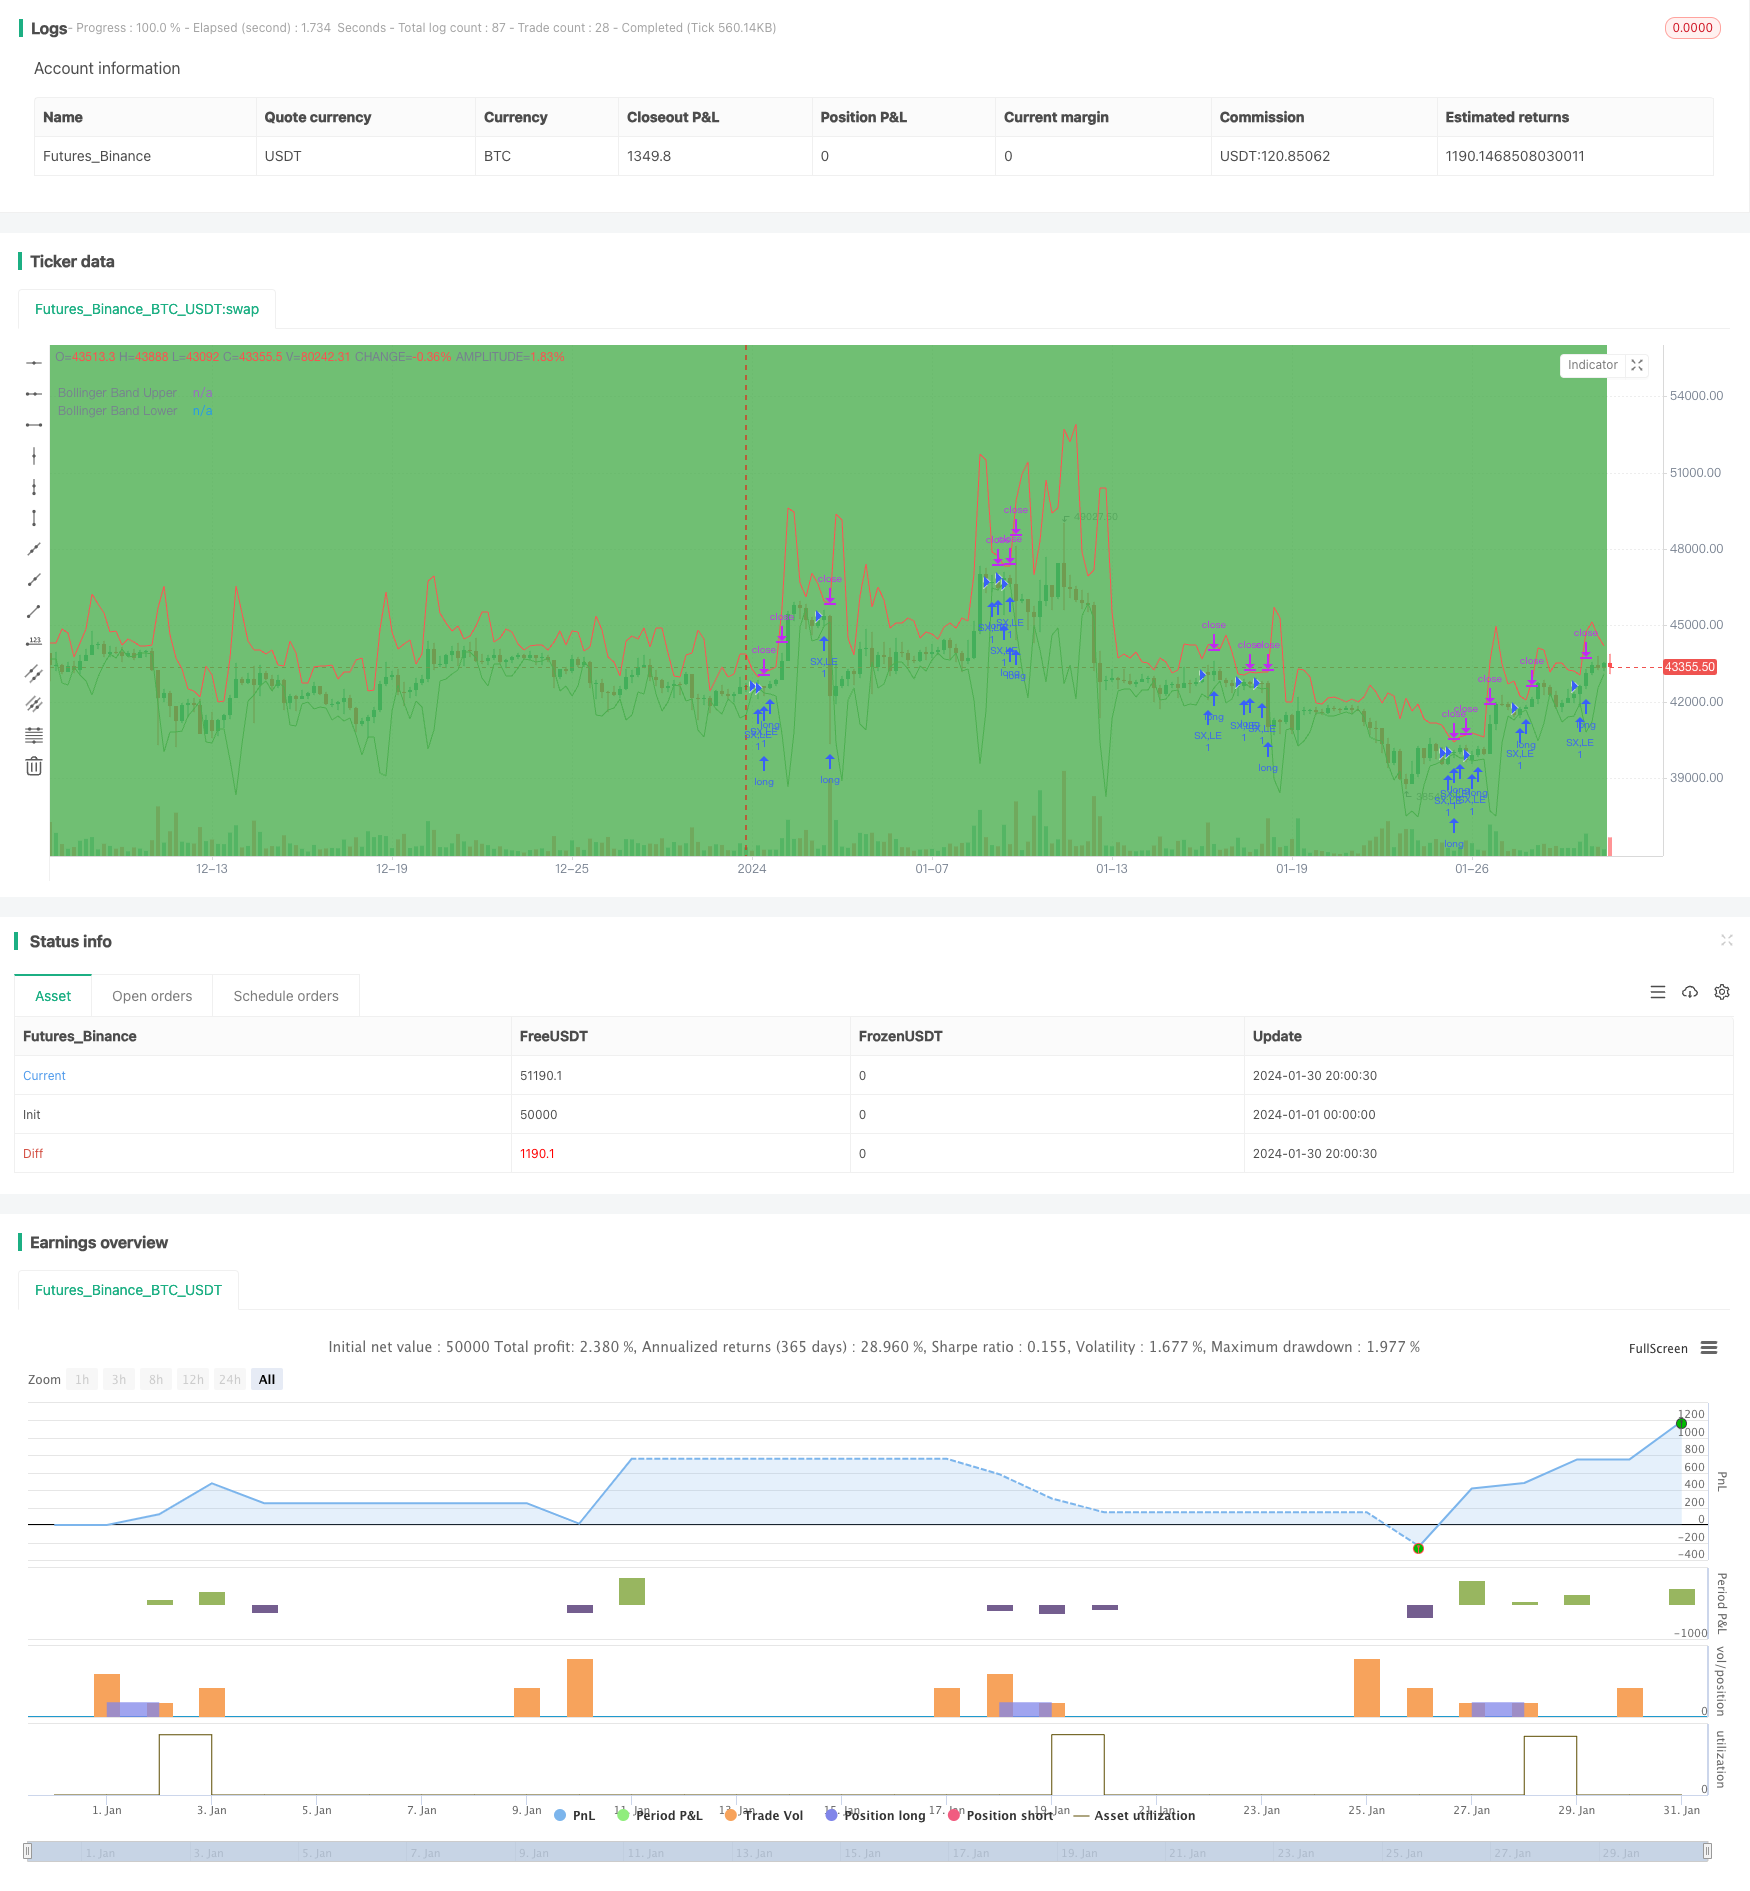
start: 2024-01-01 00:00:00
end: 2024-01-31 00:00:00
period: 5h
basePeriod: 15m
exchanges: [{"eid":"Futures_Binance","currency":"BTC_USDT"}]
*/
// This source code is subject to the terms of the Mozilla Public License 2.0 at https://mozilla.org/MPL/2.0/
// © abilash.s.90
dIMinusCalc(adxLen) =>
smoothedTrueRange = 0.0
smoothedDirectionalMovementMinus = 0.0
dIMinus = 0.0
trueRange = 0.0
directionalMovementMinus = 0.0
trueRange := max(max(high-low, abs(high-nz(close[1]))), abs(low-nz(close[1])))
directionalMovementMinus := nz(low[1])-low > high-nz(high[1]) ? max(nz(low[1])-low, 0): 0
smoothedTrueRange := nz(smoothedTrueRange[1]) - (nz(smoothedTrueRange[1])/adxLen) + trueRange
smoothedDirectionalMovementMinus := nz(smoothedDirectionalMovementMinus[1]) - (nz(smoothedDirectionalMovementMinus[1])/adxLen) + directionalMovementMinus
dIMinus := smoothedDirectionalMovementMinus / smoothedTrueRange * 100
dIMinus
dIPlusCalc(adxLen) =>
smoothedTrueRange = 0.0
smoothedDirectionalMovementPlus = 0.0
dIPlus = 0.0
trueRange = 0.0
directionalMovementPlus = 0.0
trueRange := max(max(high-low, abs(high-nz(close[1]))), abs(low-nz(close[1])))
directionalMovementPlus := high-nz(high[1]) > nz(low[1])-low ? max(high-nz(high[1]), 0): 0
smoothedTrueRange := nz(smoothedTrueRange[1]) - (nz(smoothedTrueRange[1])/adxLen) + trueRange
smoothedDirectionalMovementPlus := nz(smoothedDirectionalMovementPlus[1]) - (nz(smoothedDirectionalMovementPlus[1])/adxLen) + directionalMovementPlus
dIPlus := smoothedDirectionalMovementPlus / smoothedTrueRange * 100
dIPlus
Adx(adxLen) =>
dIPlus = 0.0
dIMinus = 0.0
dX = 0.0
aDX = 0.0
dIPlus := dIPlusCalc(adxLen)
dIMinus := dIMinusCalc(adxLen)
dX := abs(dIPlus-dIMinus) / (dIPlus+dIMinus)*100
aDX := sma(dX, adxLen)
aDX
BarInSession(sess) => time(timeframe.period, sess) != 0
//@version=4
strategy("Bollinger Band + RSI + ADX + MACD", overlay=true)
//Session
session = input(title="Trading Session", type=input.session, defval="0930-1500")
sessionColor = BarInSession(session) ? color.green : na
bgcolor(color=sessionColor, transp=95)
// Bollinger Bands
src = input(high, title="Bollinger Band Source", type=input.source)
length = input(3, minval=1, type=input.integer, title="Bollinger Band Length")
mult = input(4.989, minval=0.001, maxval=50, step=0.001, type=input.float, title="Bollinger Band Std Dev")
basis = sma(src, length)
dev = mult * stdev(src, length)
upper = basis + dev
lower = basis - dev
plot(upper, title="Bollinger Band Upper", color=color.red)
plot(lower, title="Bollinger Band Lower", color=color.green)
// RSI
rsiSrc = input(close, title="RSI Source", type=input.source)
rsiLength = input(16, minval=1, type=input.integer, title="RSI Length")
rsiComparator = input(39.2, title="RSI Comparator", type=input.float, step=0.1)
rsi = rsi(rsiSrc, rsiLength)
// ADX
adxLength = input(14, minval=1, type=input.integer, title="ADX Length")
adxComparator = input(14, minval=1, type=input.integer, title="ADX Comparator")
adx = Adx(adxLength)
// Heikinashi
haClose = security(heikinashi(syminfo.ticker), timeframe.period, close)
haOpen = security(heikinashi(syminfo.ticker), timeframe.period, open)
nextHaOpen = (haOpen + haClose) / 2
//MACD
macdCalcTypeProcessed = input(title="MACD Source", type=input.source, defval=high)
fast = input(12, title="MACD Fast")
slow = input(20, title="MACD Slow")
signalLen = input(15, title="MACD Signal")
fastMA = ema(macdCalcTypeProcessed, fast)
slowMA = ema(macdCalcTypeProcessed, slow)
macd = fastMA - slowMA
signal = sma(macd, signalLen)
longCondition() =>
(low < lower) and (rsi[0] > rsiComparator) and (adx > adxComparator) and (close > nextHaOpen) and BarInSession(session) and macd > signal
stop = (close - max((low - (low * 0.0022)), (close - (close * 0.0032)))) / syminfo.mintick
target = (max(upper, (close + (close * 0.0075))) - close) / syminfo.mintick
strategy.entry("SX,LE", strategy.long, when=longCondition(), comment="SX,LE")
strategy.close_all(when=(not BarInSession(session)))
strategy.exit("LX", from_entry="SX,LE", profit=target, loss=stop)