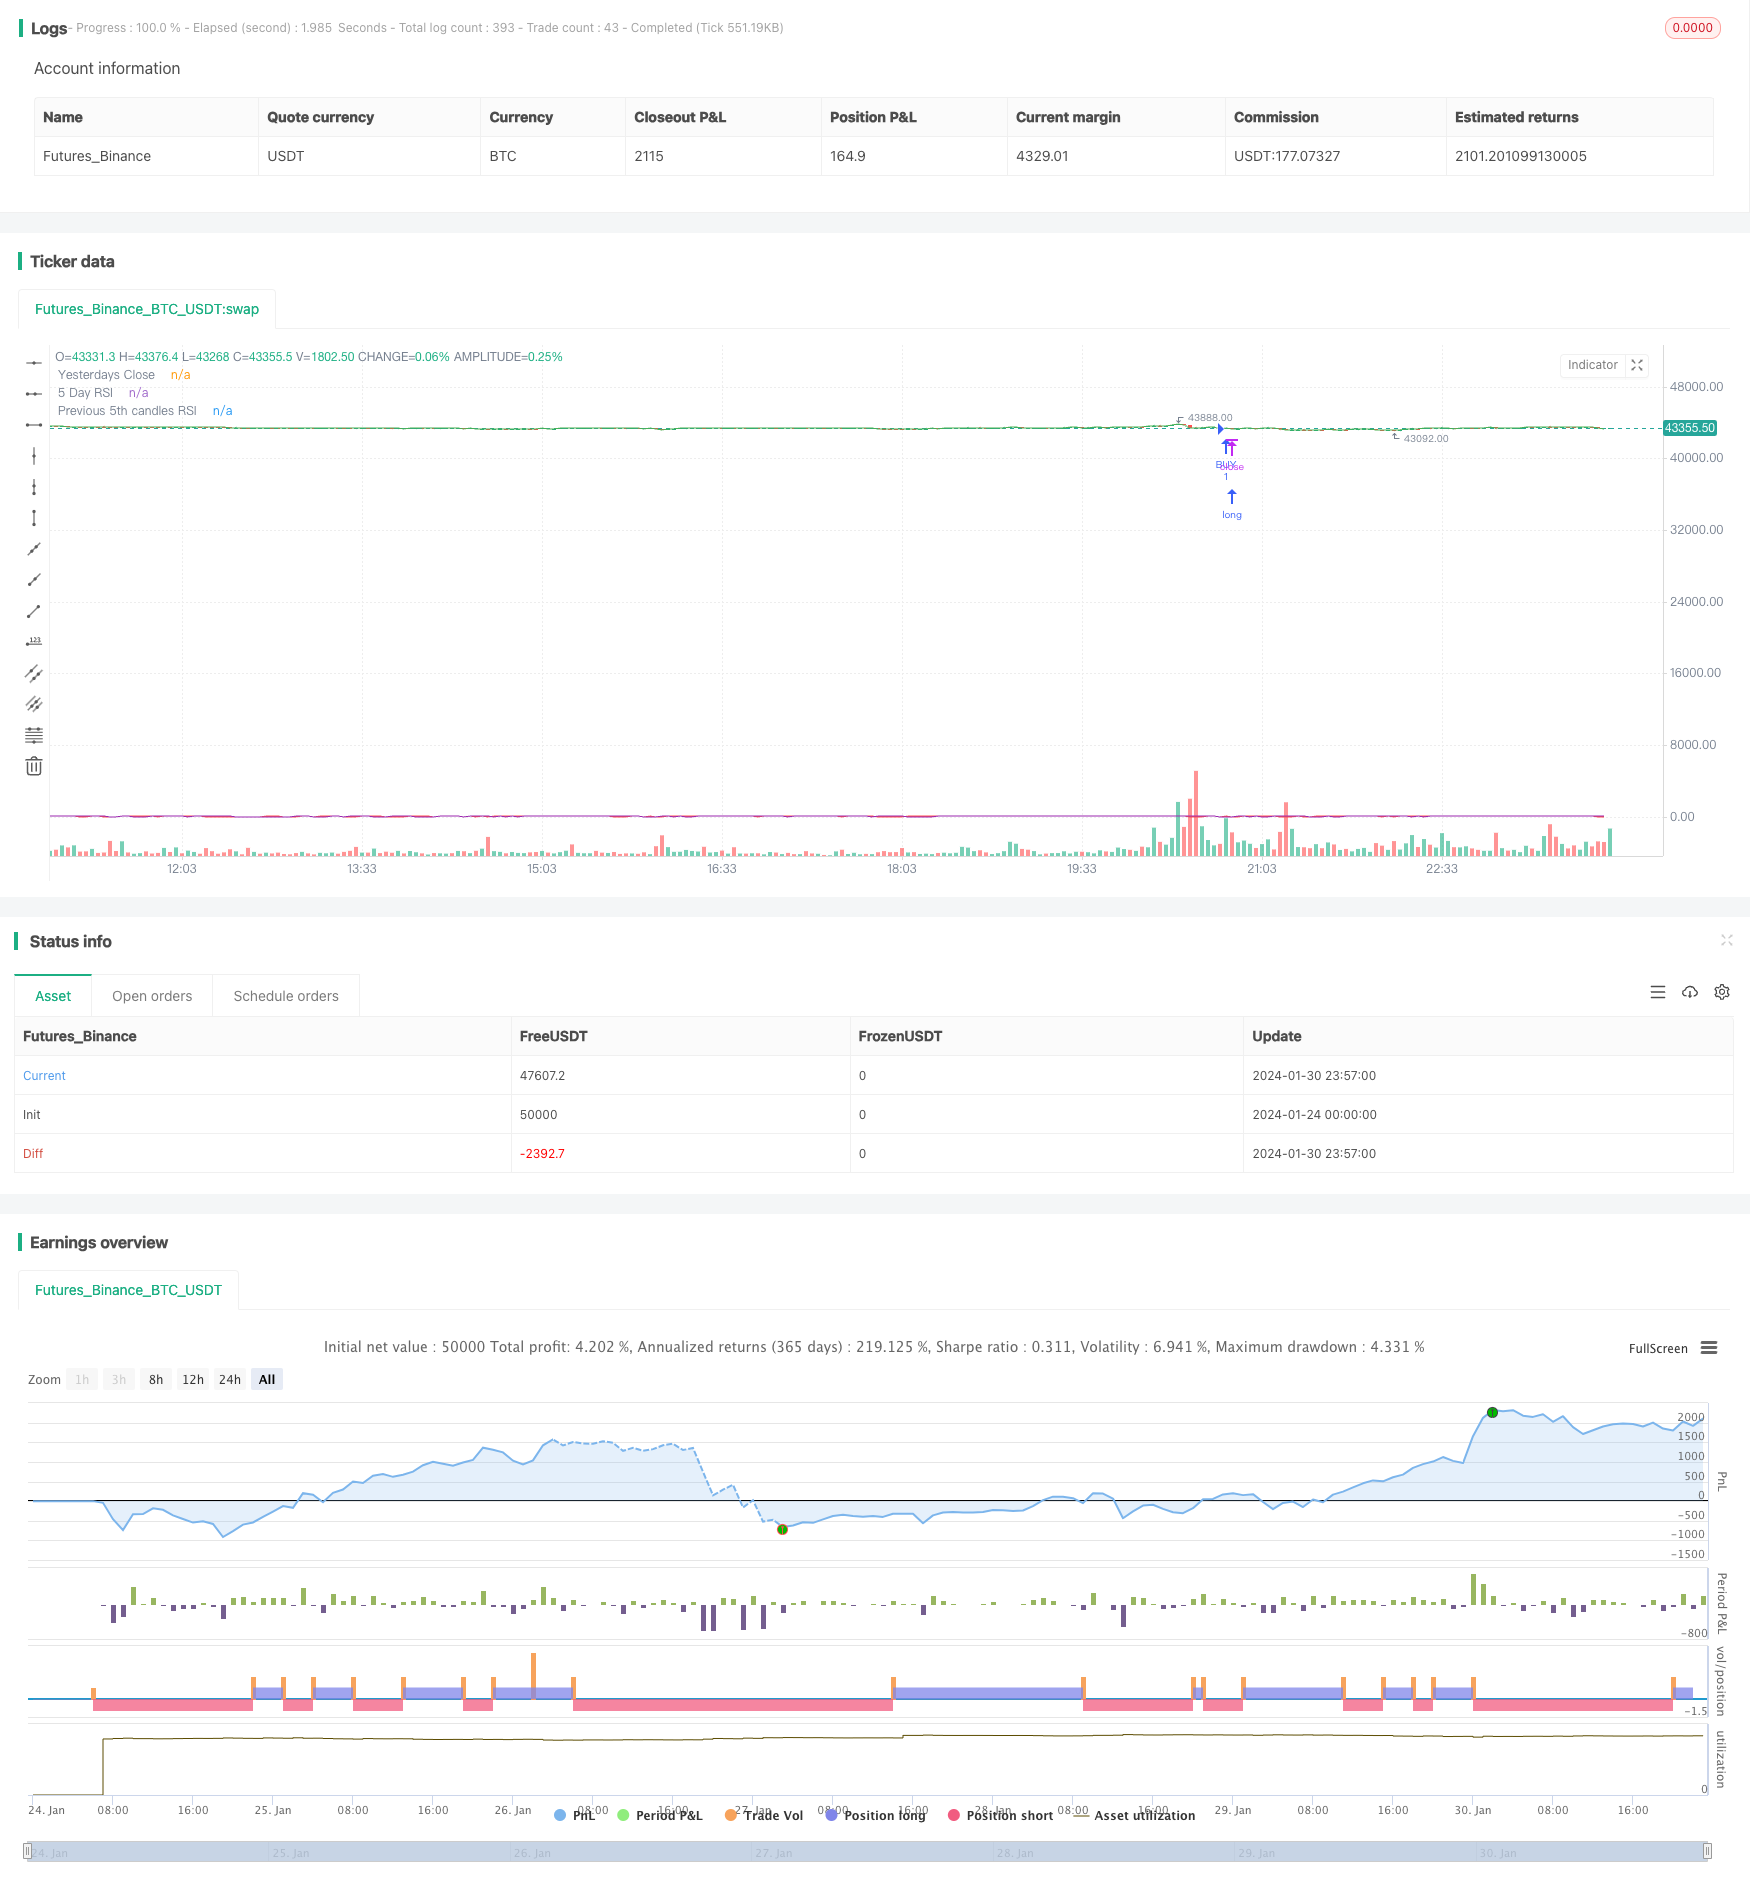
개요
이 전략은 주로 5일 RSI 지표와 200일 이동 평균을 결합하여 거래 결정 신호를 형성하며, 기술 지표 포트폴리오 전략에 속한다. 주요 거래 원칙은: 가격이 오버 바이 오버 세일 영역을 초과 할 때, 신호는 판매; 가격이 오버 세일 영역을 초과 할 때, 신호는 구매한다. 이 전략의 가장 큰 장점은 전략 신호가 명확하고, 회수 위험이 작다는 것이다. 그러나 단일 기술 지표 포트폴리오를 사용하여 거래 결정을 형성하는 데 제한이 있지만, 다인자 모델 및 기계 학습 알고리즘 등을 통해 최적화 할 수 있습니다.
전략 원칙
이 전략은 주로 5일 RSI와 200일 이동 평균을 결합하여 가격의 과매매 영역을 판단하여 거래 결정을 내립니다.
5일 RSI 지표 판단 가격 운행 오버 바이 오버 세일 지역 . 오버 바이 라인을 72로 설정하고, 오버 세일 지역을 30으로 설정합니다. RSI 지표가 아래로 올라가면 30을 돌파할 때 구매 신호를 생성하고, RSI 지표가 위로 내려가면 72을 돌파할 때 판매 신호를 생성합니다.
200일 이동 평균은 가격의 중장선 트렌드 방향을 판단한다. 가격이 200일 평균선 아래 있을 때, 가격 하향 단계; 가격이 200일 평균선 위에 있을 때, 가격 상향 단계이다.
1과 2의 판단과 함께, 이 전략은 5일 RSI 지표가 오버바이트하고 72를 넘어서면 팔고, 5일 RSI가 30을 넘어서고 200일 평균선보다 낮은 가격에 구매합니다.
전략적 이점
전략적 신호는 RSI 지표의 Judgment 영역을 사용하여 오버 바이 오버 셀 신호를 결정합니다.
200 일간 평균선은 큰 트렌드 방향을 판단하고 역동적인 조작을 피한다.
최대 보유 수를 설정할 수 있으며, 이는 위험을 통제하는데 도움이 됩니다.
전략 파라미터를 최적화할 수 있는 공간이 넓고, RSI 파라미터를 평균선 파라미터와 조정할 수 있다.
탈퇴 위험은 낮고, 효과적인 통제 전략은 최대 탈퇴이다.
전략적 위험
RSI와 평균 지표만 사용하면 전략 신호가 불안정할 수 있으며, 여러 개의 공허의 시장의 흔들림으로 거래 손실 위험이 있습니다.
더 나은 전략 효과를 얻기 위해 RSI 파라미트와 평균선 파라미트를 최적화하고 테스트해야합니다.
다른 지표 또는 모델 판단을 도입하여 전략 신호를 최적화할 수 있다. 예를 들어, 변동률 지표, 기계 학습 판단 등을 도입한다.
전략 최적화 방향
MACD, KD, 변동률 지표 등과 같은 더 많은 지표 조합을 사용하여 판단하십시오.
기계 학습 모델 판단을 추가한다. 거래 신호의 안정성을 판단하는 LSTM처럼.
양적 인 요소를 추가하십시오. 거래량 변화, 자금 흐름 등과 같은 재정을 판단하는 요소.
최적화 전략 변수. RSI 변수, 평균선 변수 등.
이동 상쇄, 시간 상쇄 등으로 최적화된 상쇄 메커니즘
요약하다
이 전략은 주로 5일 RSI 지표와 200일 평균선 지표 조합을 사용하여 가격 오버 바이 오버 셀 영역을 판단하여 거래 신호를 형성합니다. 기술 지표 조합 전략에 속합니다. 전략 신호는 명확하고 최대 회수 위험은 작습니다. 그러나 다중 지표 조합과 기계 학습 판단을 통해 추가로 최적화하여 전략 효과를 높일 수 있습니다.
/*backtest
start: 2024-01-24 00:00:00
end: 2024-01-31 00:00:00
period: 3m
basePeriod: 1m
exchanges: [{"eid":"Futures_Binance","currency":"BTC_USDT"}]
*/

// This source code is subject to the terms of the Mozilla Public License 2.0 at https://mozilla.org/MPL/2.0/
// ©chewyScripts.

//@version=5
strategy("96er RSI+200EMA Strategy + Alerts", overlay=true)
// This works best on a small account $100, with 50% of equity and up to 10 max open trades.
// 96% Profitable, turns $100 into $350 in 1 month. very few losses. super happy with it.
// So far it triples the account on a 1m chart in 1 month back testing on the SEI-USD pair.
// I did not test on FX pairs or other instruments.
// had some issues with the inputs not working so had to hard code some, also the lastClose var sometimes breaks and starts following every candle, not sure why.

in_r1 = input.int(5,"5 day input or RSI1")
in_openOrders = input.int(3,"max open orders")

in_lowerRSI = input.int(30,"RSI Lower")
in_upperRSI = input.int(72,"RSI Upper ")

in_emaperiod = input.int(200,"EMA Period")

in_buybreakout = input.int(50,"Buy breakout range")

in_buyTP = input.float(1.05,"Buy TP: 1+TP %, .05 seems to work well.")
in_sellTP = input.float(0.9850, "Sell TP: 1-TP%. .025 seems to work well. ")

simple int rsi5 = in_r1

// 3 rsi strategy , when all of them are overbought we sell, and vice versa
rsi7 = ta.rsi(close,rsi5)
lastClose = request.security(syminfo.tickerid, "D", close, lookahead = barmerge.lookahead_on)
rsi3 = ta.rsi(close[5],rsi5)

ma = ta.ema(close,in_emaperiod)

plot(rsi7,"5 Day RSI",color.red)
plot(lastClose,"Yesterdays Close",color.green)
plot(rsi3,"Previous 5th candles RSI",color.purple)


// sell condition
//sell = ta.crossunder(rsi7,70) and ta.crossunder(rsi14,70) and ta.crossunder(rsi21,70)

//buy condition
//buy = ta.crossover(rsi7,in_lowerRSI) and close < ma and rsi3 <= in_upperRSI and strategy.opentrades < in_openOrders
//sell = ta.crossunder(rsi7,in_upperRSI) and close > ma and rsi3 >= in_lowerRSI3 and strategy.opentrades < in_openOrders

buy = ta.crossover(rsi7,in_lowerRSI) and close < ma and close < lastClose and strategy.opentrades < in_openOrders
sell = ta.crossunder(rsi7,in_upperRSI) and close > ma and close > lastClose and strategy.opentrades < in_openOrders


var lastBuy = close
var lastSell = close

if (buy)
    strategy.entry("BUY", strategy.long)
    lastBuy := close
    alert("Buy")

if ((close >= lastBuy*in_buyTP ) or rsi7 > in_buybreakout and close >= lastClose and (close >= lastClose*in_buyTP or close >= lastBuy*in_buyTP ) )
    strategy.close("BUY", "BUY Exit")
    alert("Buy Exit")

if (sell)
    strategy.entry("SELL", strategy.short)
    lastSell := close
    alert("Sell")

if ( close < ma and (close <= lastSell*in_sellTP ) or (close < lastClose*in_sellTP) )
    strategy.close("SELL", "Sell Exit")
    alert("Sell Exit")