개요
이 전략은 양적 거래 동력 방향 수렴 전략 수첩이라고 불리며, 윌리엄 블라우가 그의 저서 동력, 방향 및 수렴 (Momentum, Direction and Divergence) 에서 기술한 기술 지표에 따라 설계된 양적 거래 전략이다. 이 전략은 동력, 방향 및 수렴의 세 가지 핵심 차원에 초점을 맞추고 있으며, 주식 가격의 동력 지표를 계산하여 시장 추세 방향을 판단하고 가격과 지표 사이의 오차 현상을 찾아 거래 기회를 얻는다.
전략 원칙
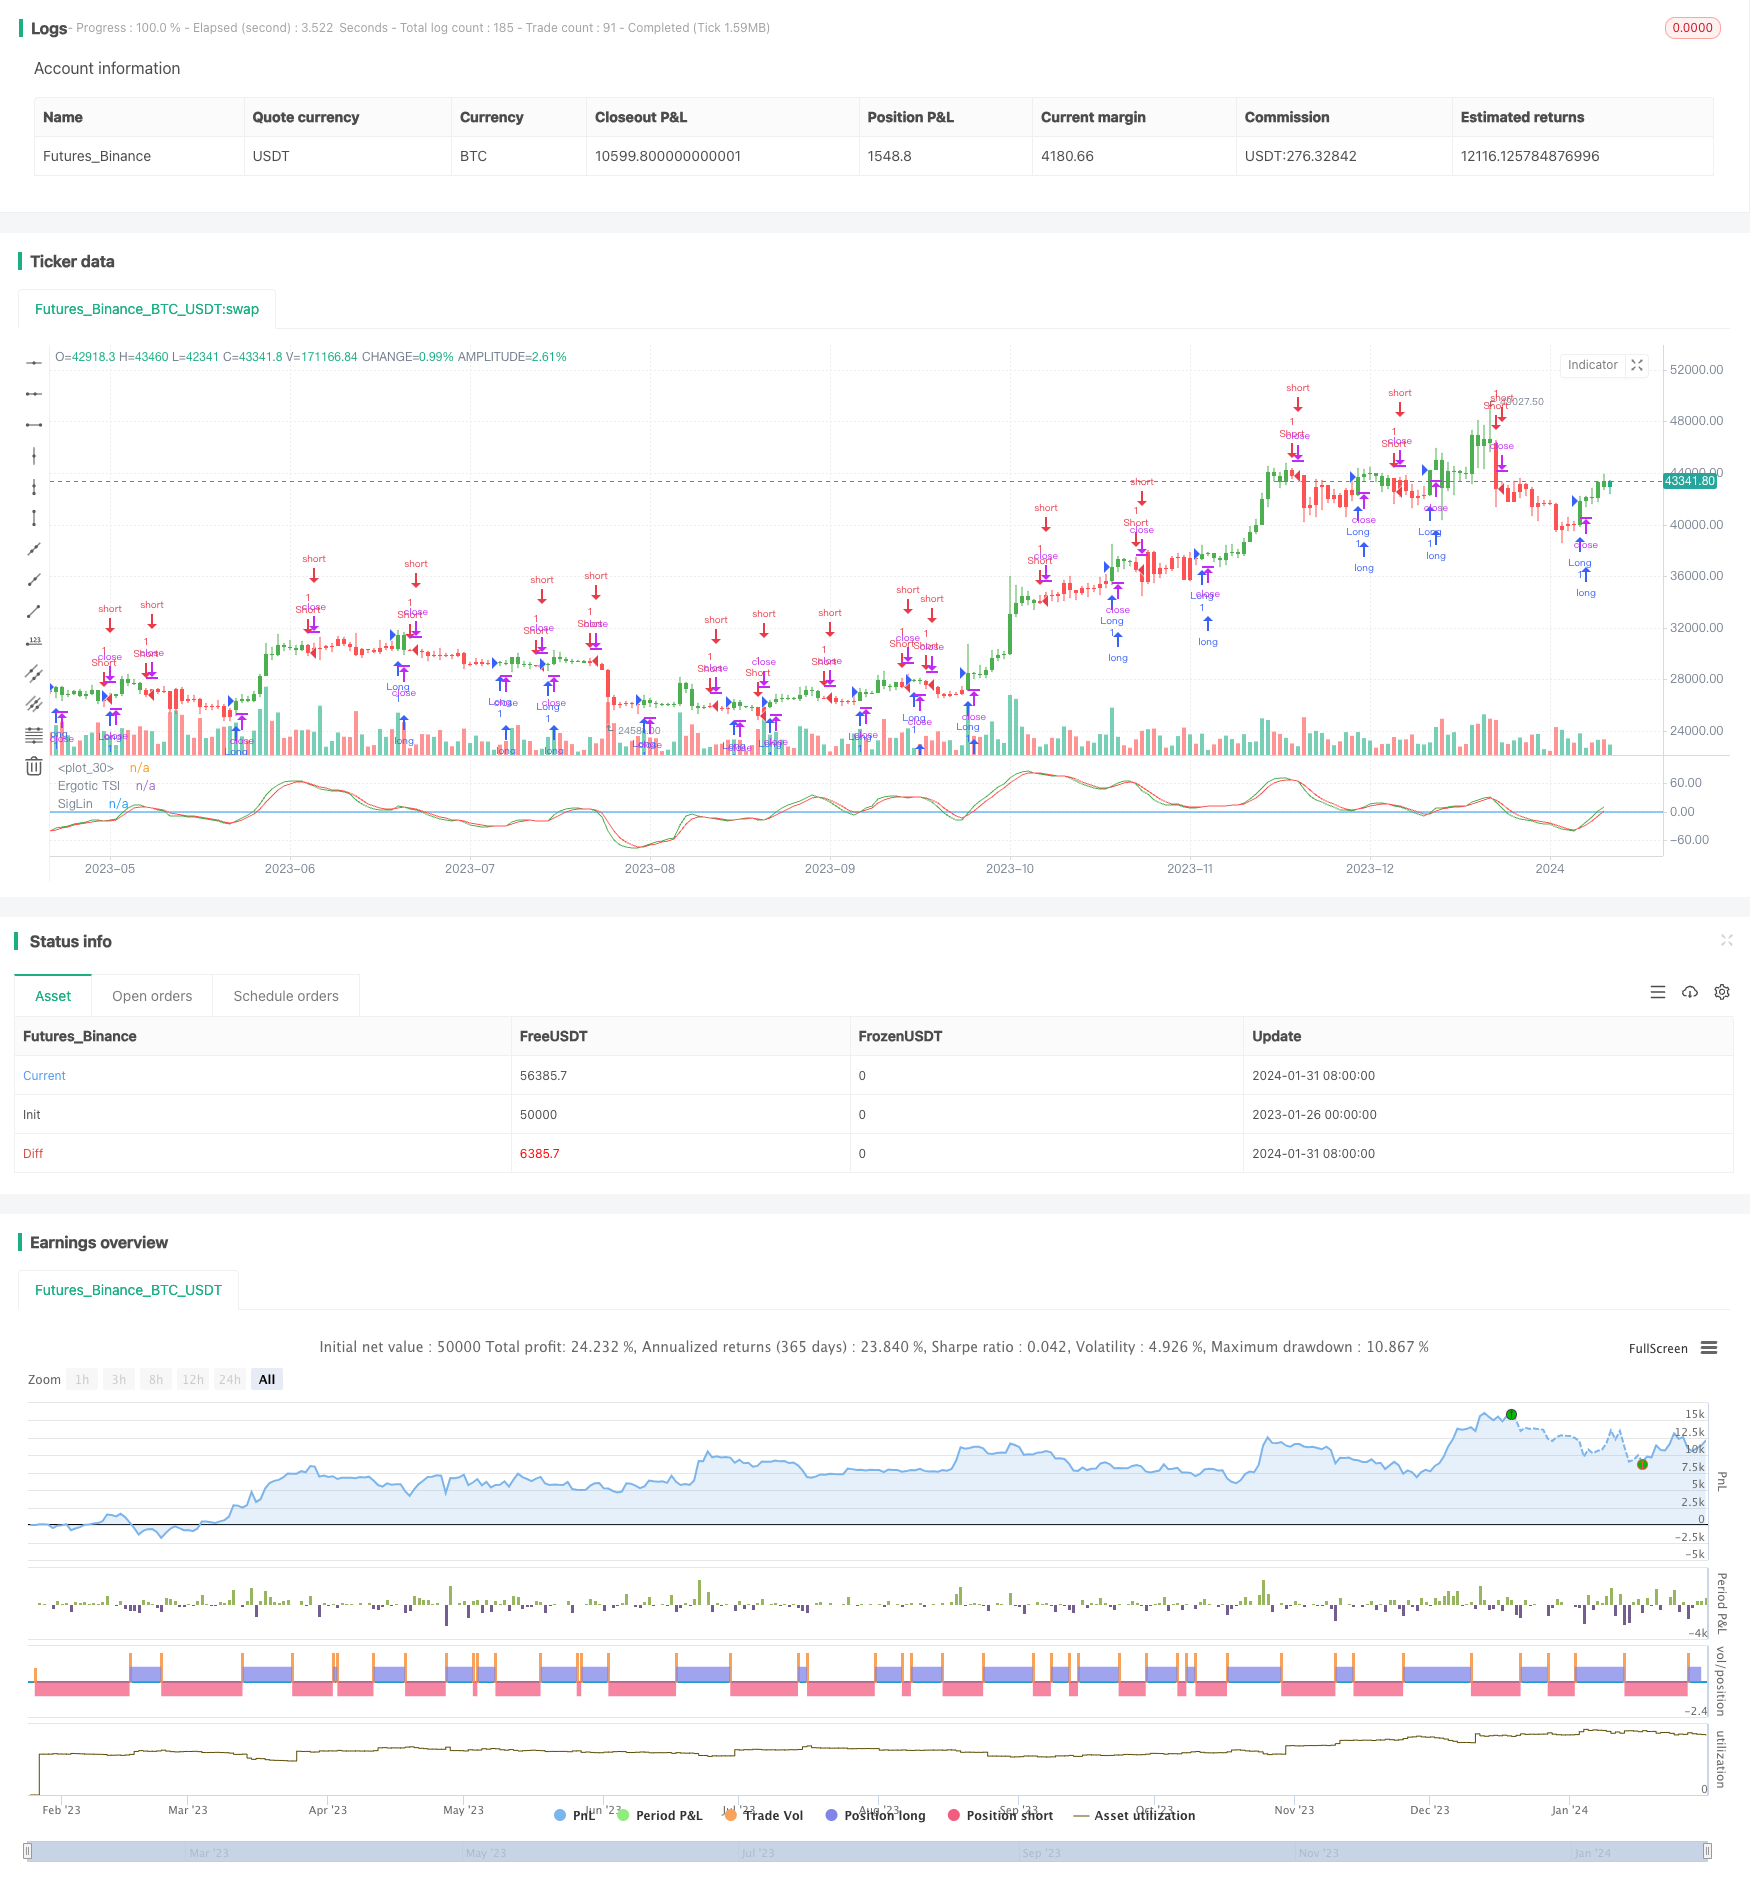
이 전략의 핵심 지표는 ERGOTIC TSI입니다. 이 수식은 다음과 같습니다.
Val1 = 100 * EMA(EMA(EMA(价格变化量,r),s),u)

Val2 = EMA(EMA(EMA(价格变化量的绝对值,r),s),u)

Ergotic TSI = 如果Val2不等于0,则为Val1/Val2,否则为0
그 중 r,s,u는 평평함수이다. 이 지표는 가격변동량의 절대값에 대한 가격변동량의 비율을 반영하며, 운동량 흔들림 지표에 속한다. 그 다음 우리는 Ergotic TSI의 EMA 평평한 이동 평균을 신호선으로 계산한다.
우위 분석
이 전략은 다음과 같은 장점을 가지고 있습니다.
- 가격 변화의 흐름을 파악할 수 있는 능력
- 가격 변동에 대한 좋은 필터입니다.
- 더 나은 탈퇴 특성을 가진
- 매개 변수 설정은 유연하고 부드러움을 조정할 수 있습니다.
위험 분석
이 전략에는 몇 가지 위험도 있습니다.
- 트렌드 반전 시 잘못된 신호가 발생합니다.
- 잘못 설정된 매개 변수는 거래 기회를 놓치거나 가짜 신호를 추가합니다.
- 다양한 품종과 거래 환경에 적합한 변수를 조정해야 합니다.
최적화 매개 변수, 다른 지표의 조합을 통해 확인하고, 스톱로스를 설정하여 위험을 제어할 수 있다.
최적화 방향
이 전략은 다음과 같은 부분에서 최적화될 수 있습니다.
- 다양한 가격 입력들을 테스트합니다. 예를 들어, 오프닝 가격, 오프닝 가격, 오프닝 가격, 오프닝 가격, 오프닝 가격, 오프닝 가격, 오프닝 가격, 오프닝 가격, 오프닝 가격, 오프닝 가격, 오프닝 가격, 오프닝 가격, 오프닝 가격, 오프닝 가격, 오프닝 가격 등이죠.
- 평형 변수 r, s, u의 값을 조정하여 최적의 변수 조합을 찾습니다.
- 다른 지표 또는 필터 조건을 추가하여 신호를 추가 확인
- 스톱포인트와 탈퇴 메커니즘을 설정합니다.
요약하다
이 전략은 동력 변화, 트렌드 판단 및 탈선 특성을 고려하여 트렌드 기회를 효과적으로 포착할 수 있다. 변수 최적화, 신호 필터링 및 위험 제어의 수단을 통해 더 나은 전략 성능을 얻을 수 있다. 전체적으로 이 전략은 합리적으로 설계되어 더 많은 연구와 실습을 할 가치가 있다.
전략 소스 코드
/*backtest
start: 2023-01-26 00:00:00
end: 2024-02-01 00:00:00
period: 1d
basePeriod: 1h
exchanges: [{"eid":"Futures_Binance","currency":"BTC_USDT"}]
*/

//@version = 2
////////////////////////////////////////////////////////////
//  Copyright by HPotter v1.0 13/12/2016
// r - Length of first EMA smoothing of 1 day momentum        4
// s - Length of second EMA smoothing of 1 day smoothing      8
// u- Length of third EMA smoothing of 1 day momentum         6
// Length of EMA signal line                                  3
// Source of Ergotic TSI                                      Close
//
// This is one of the techniques described by William Blau in his book "Momentum,
// Direction and Divergence" (1995). If you like to learn more, we advise you to
// read this book. His book focuses on three key aspects of trading: momentum,
// direction and divergence. Blau, who was an electrical engineer before becoming
// a trader, thoroughly examines the relationship between price and momentum in
// step-by-step examples. From this grounding, he then looks at the deficiencies
// in other oscillators and introduces some innovative techniques, including a
// fresh twist on Stochastics. On directional issues, he analyzes the intricacies
// of ADX and offers a unique approach to help define trending and non-trending periods.
//
// You can use in the xPrice any series: Open, High, Low, Close, HL2, HLC3, OHLC4 and ect...
// You can change long to short in the Input Settings
// Please, use it only for learning or paper trading. Do not for real trading.
////////////////////////////////////////////////////////////
strategy(title="Ergotic TSI Strategy Backtest")
r = input(4, minval=1)
s = input(8, minval=1)
u = input(6, minval=1)
SmthLen = input(3, minval=1)
reverse = input(false, title="Trade reverse")
hline(0, color=blue, linestyle=line)
xPrice = close
xPrice1 = xPrice - xPrice[1]
xPrice2 = abs(xPrice - xPrice[1])
xSMA_R = ema(ema(ema(xPrice1,r), s),u)
xSMA_aR = ema(ema(ema(xPrice2, r), s),u)
Val1 = 100 * xSMA_R
Val2 = xSMA_aR
xTSI = iff (Val2 != 0, Val1 / Val2, 0)
xEMA_TSI = ema(xTSI, SmthLen)
pos = iff(xTSI > xEMA_TSI, 1,
	   iff(xTSI < xEMA_TSI, -1, nz(pos[1], 0)))
possig = iff(reverse and pos == 1, -1,
          iff(reverse and pos == -1, 1, pos))
if (possig == 1)
    strategy.entry("Long", strategy.long)
if (possig == -1)
    strategy.entry("Short", strategy.short)
barcolor(possig == -1 ? red: possig == 1 ? green : blue )
plot(xTSI, color=green, title="Ergotic TSI")
plot(xEMA_TSI, color=red, title="SigLin")