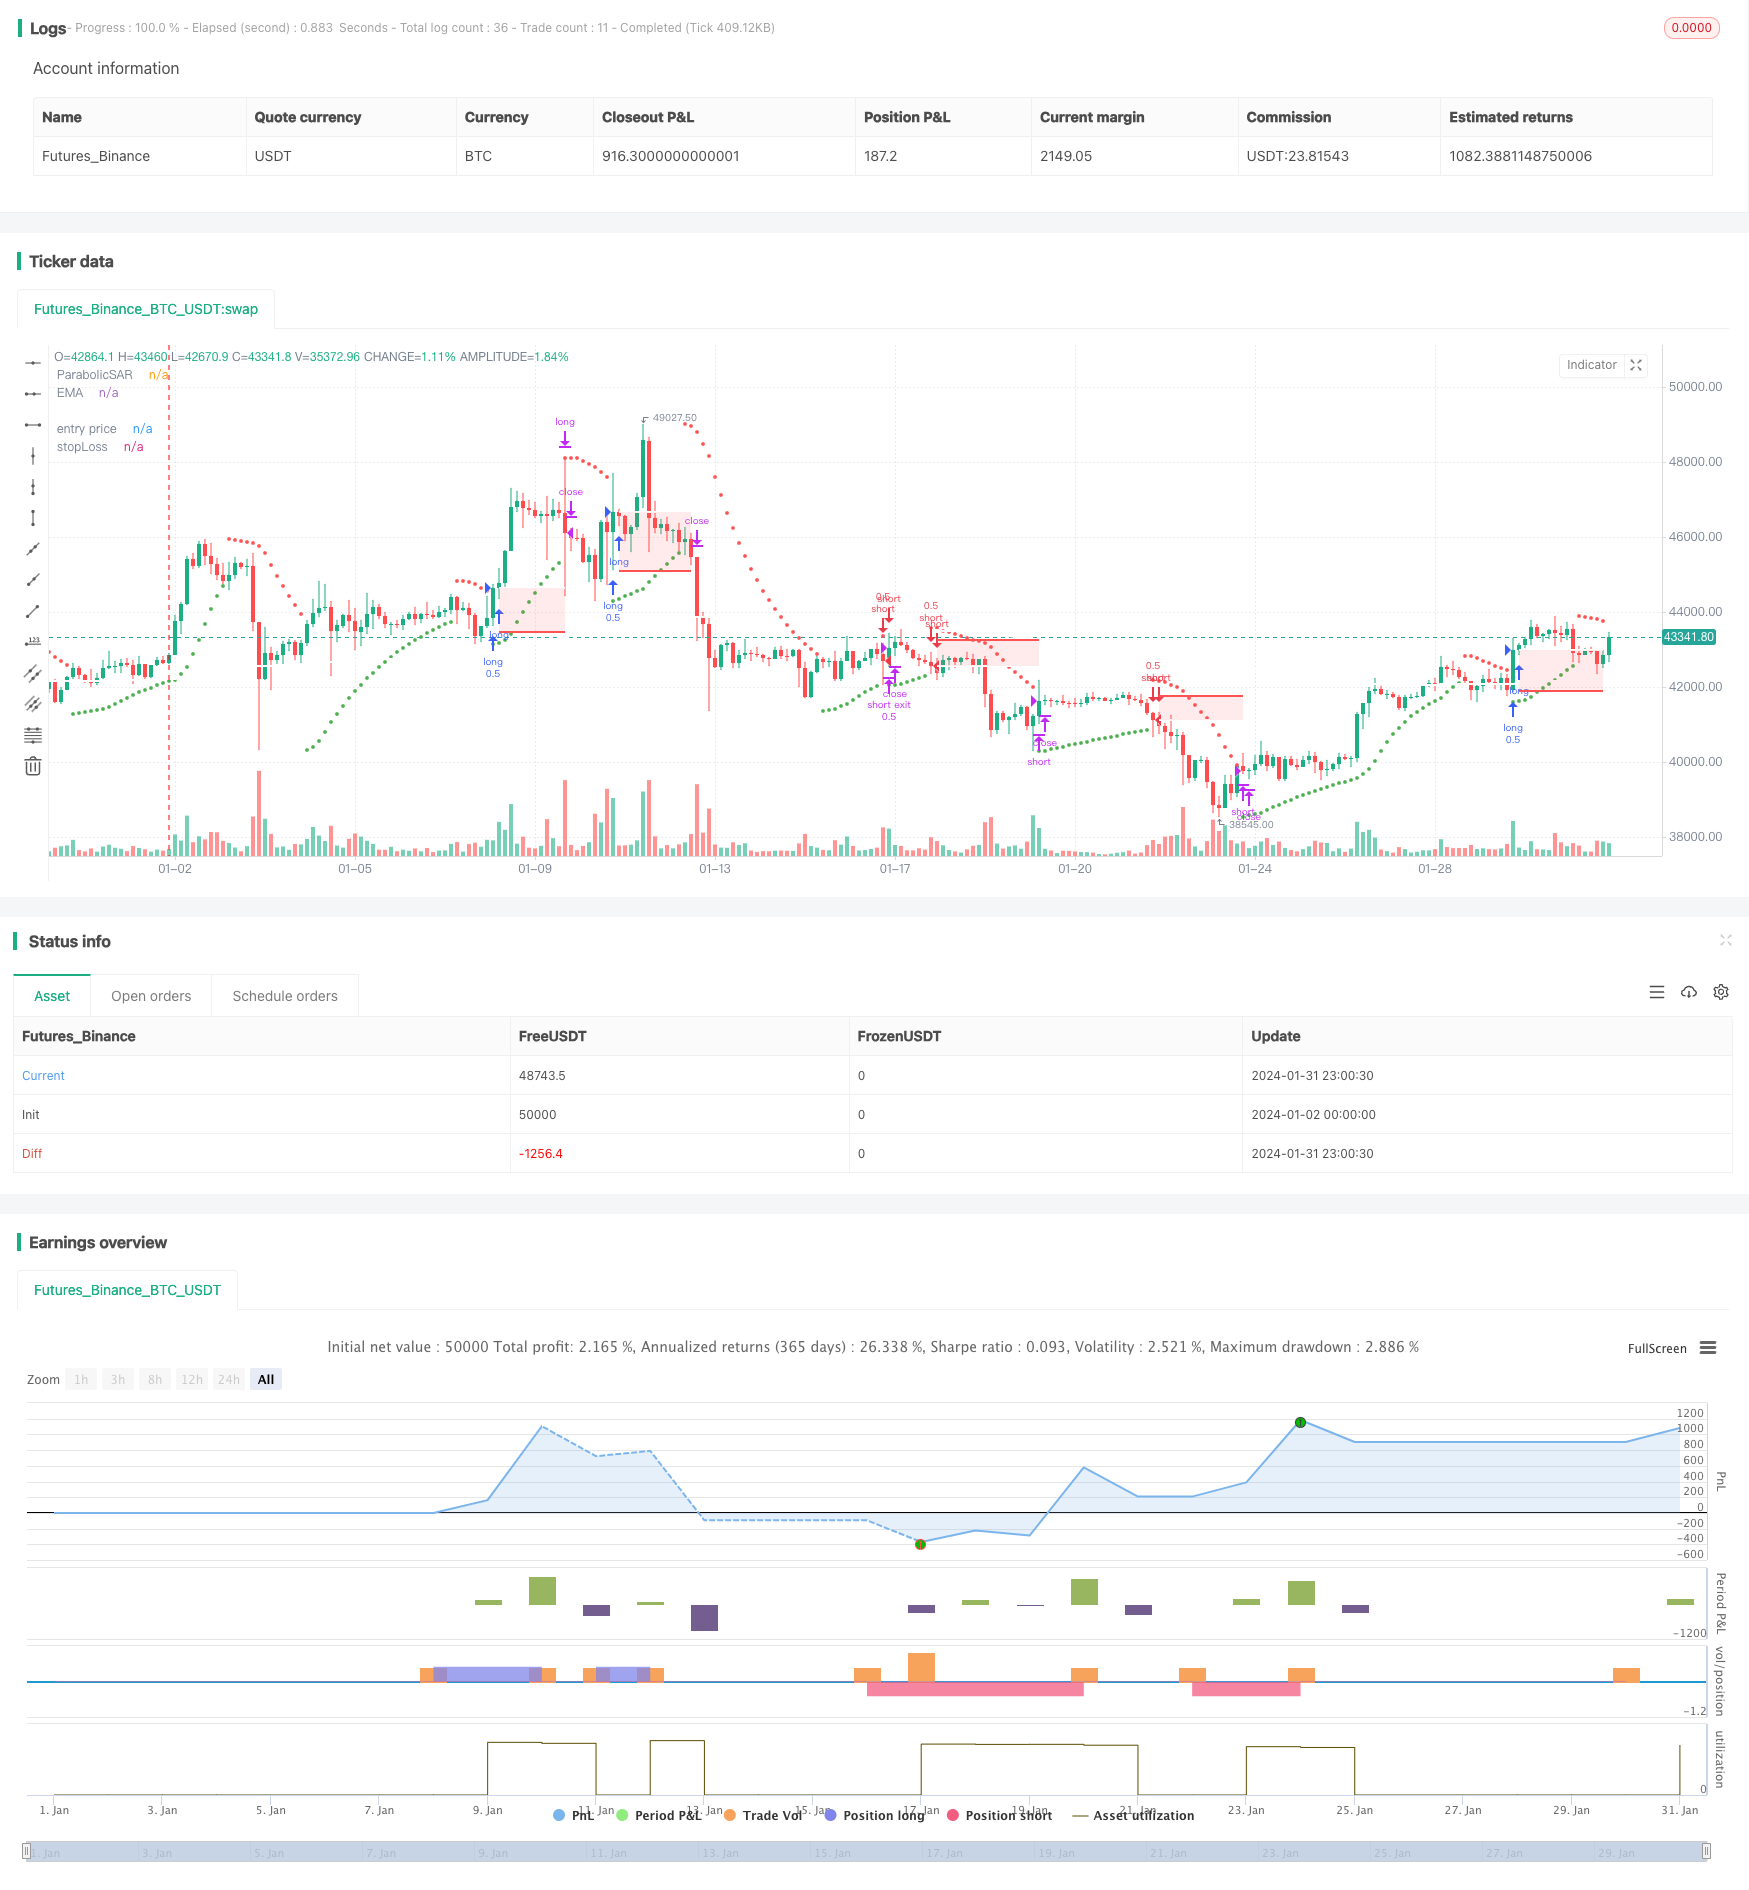
개요
이 글은 파로벨 주기 지표와 브린 밴드 지표를 결합하여 이동 상쇄 전략을 설정하는 양적 거래 전략을 소개한다. 이 전략은 파로벨 주기선을 계산하여 시장 추세 방향을 판단하고, 브린 밴드의 오르락 내리락 동력을 사용하여 상쇄 위치를 설정하여 수익을 잠금하기 위해 이동 상쇄를 실현한다.
전략 원칙
첫째, 이 전략은 파로벨 지표를 사용하여 현재 시장의 추세를 판단한다. 오늘의 종결 가격이 어제의 파로벨 주기선을 통과했을 때, 시장의 상황이 비관적이라고 생각하면, 더 많이 할 수 있다. 오늘의 종결 가격이 어제의 주기선을 통과했을 때, 시장의 상황이 하락하여, 공백을 할 수 있다.
둘째, 이 전략은 부린띠 지표의 동적 설정 스톱포트를 결합한다. 부린띠의 상반선은 과매구역으로 볼 수 있고, 하반선은 과매구역으로 볼 수 있다. 부린띠의 하반선으로 다시 떨어지면 평점을 멈춘다. 부린띠의 하반선으로 다시 떨어지면 출장을 멈춘다.
위와 같은 원칙을 통해, 이 전략은 시장 방향을 판단하는 동시에, 수익을 추적하기 위해 동적 인 중지 장치를 설정합니다. 이것은 큰 추세에서 일부 상승세를 포착 할 수있게 해줍니다. 동시에 손실을 통해 수익을 고정하여 위험을 회피 할 수 있습니다.
전략적 이점
기존의 스톱 스트래치 전략에 비해 고정된 스톱 스탠드만 설정하고 있으며, 이 전략은 브린 밴드 지표를 스톱 스트래치로 사용하여 스톱 스트래치가 가격 변동에 따라 이동할 수 있게 한다. 이것은 비교적 큰 시세에서 더 많은 이익을 잠금할 수 있게 한다. 또한, 이 전략은 브린 밴드 지표를 추가하여 오버 바이 오버 소매 지역을 판단하는 데 있어, 파로벨 주기선을 사용하는 것에 비해 더 정확하다.
위험과 해결
이 전략의 주요 위험은 파로벨 지표 판단의 경향성이 강하지 않다는 것이다. 변동적인 상황에서는 가격이 여러 번 오르락 내리락하여 파로벨 주기선을 통과하여 전략이 빈번하지만 미미한 수익을 창출한다. 이 때 거래 비용과 슬라이드 포인트 비용은 전략의 수익성을 감소시키는 데 큰 비중을 차지할 수 있다.
위와 같은 위험을 대응하기 위해, 파라미터의 조정, 파로벨 주기선의 변화 정도를 확대하여 오판 가능성을 줄이는 것을 고려할 수 있습니다. 또는 다른 지표와 결합하여 시장에 들어가는 시기를 필터링 할 수 있습니다. 예를 들어, 흔들림 지표와 같은 판단은 불필요한 거래를 줄이기 위해 추세 또는 흔들림이라고 할 수 있습니다.
전략 최적화
이 전략은 다음과 같은 부분에서 최적화될 수 있습니다.
파라벨 지표의 변수를 최적화하고, 변수 지표의 변화 속도를 조정하여 오판의 확률을 감소시킵니다.
다른 기술 지표 필터링을 추가하여 MACD, KD와 같은 거래 유형을 판단하여 변동 시장의 중매를 피하십시오.
부린 밴드 변수를 최적화하고, 부린 밴드 변수를 조정하여 가격 변화에 더 가깝게 만듭니다.
거래량, 지분량 등의 부수적 판단을 통해 가짜 브레이크를 방지하기 위한 양력 지표의 증대
주식 기본 정보와 결합하여 전략 보유 주식 성과에 영향을 미치지 않는 문제
요약하다
이 전략은 파로벨 지표를 통해 시장 경향의 방향과 강도를 판단하고, 그 다음 브린 대역을 이용하여 궤도 아래로 이동한 손실 지점을 설정하여 손실 전략을 달성한다. 트렌드 추적과 위험 통제의 조합을 실현한다. 전통적인 고정 손실 전략에 비해 이 전략은 큰 상황에서 더 높은 수익을 얻을 수 있다. 변수 최적화 및 기타 보조 판단 지표를 추가함으로써 전략 안정성을 더욱 강화하고 불필요한 거래를 줄일 수 있다.
/*backtest
start: 2024-01-02 00:00:00
end: 2024-02-01 00:00:00
period: 3h
basePeriod: 15m
exchanges: [{"eid":"Futures_Binance","currency":"BTC_USDT"}]
*/

// This source code is subject to the terms of the Mozilla Public License 2.0 at https://mozilla.org/MPL/2.0/
// © maxencetajet

//@version=5
strategy("HA_RSI", overlay=true, initial_capital=1000, default_qty_type=strategy.fixed, default_qty_value=0.5, slippage=25)

closeHA = request.security(ticker.heikinashi(syminfo.tickerid), timeframe.period, close)

useDateFilter = input.bool(true, title="Filter Date Range of Backtest",
     group="Backtest Time Period")
backtestStartDate = input(timestamp("5 June 2022"),
     title="Start Date", group="Backtest Time Period",
     tooltip="This start date is in the time zone of the exchange " +
     "where the chart's instrument trades. It doesn't use the time " +
     "zone of the chart or of your computer.")
backtestEndDate = input(timestamp("5 July 2022"),
     title="End Date", group="Backtest Time Period",
     tooltip="This end date is in the time zone of the exchange " +
     "where the chart's instrument trades. It doesn't use the time " +
     "zone of the chart or of your computer.")

inTradeWindow = true

swingHighV = input.int(10, title="Swing High", group="number of past candles")
swingLowV = input.int(10, title="Swing Low", group="number of past candles")

emaV = input.int(200, title="Ema Period", group="EMA")

rsiV = input.int(14, title="RSI Period", group="RSI")

start = input(0.02, group="Parabolic SAR")
increment = input(0.02, group="Parabolic SAR")
maximum = input(0.2, "Max Value", group="Parabolic SAR")

ema = ta.ema(closeHA, emaV)
rsi = ta.rsi(closeHA, rsiV)
SAR = ta.sar(start, increment, maximum)

myColor = SAR < low?color.green:color.red

longcondition = closeHA > ema and rsi > 50 and closeHA[1] > SAR and closeHA[1] < SAR[1]
shortcondition = closeHA < ema and rsi < 50 and closeHA[1] < SAR and closeHA[1] > SAR[1]

float risk_long = na
float risk_short = na
float stopLoss = na
float entry_price = na
float takeProfit = na

risk_long := risk_long[1]
risk_short := risk_short[1]

swingHigh = ta.highest(closeHA, swingHighV)
swingLow = ta.lowest(closeHA, swingLowV)

if strategy.position_size == 0 and longcondition and inTradeWindow
    risk_long := (close - swingLow) / close
    strategy.entry("long", strategy.long, comment="Buy")

if strategy.position_size == 0 and shortcondition and inTradeWindow
    risk_short := (swingHigh - close) / close
    strategy.entry("short", strategy.short, comment="Sell")

if strategy.position_size > 0

    stopLoss := strategy.position_avg_price * (1 - risk_long)
    entry_price := strategy.position_avg_price
    strategy.exit("long exit", "long", stop = stopLoss)

if strategy.position_size < 0

    stopLoss := strategy.position_avg_price * (1 + risk_short)
    entry_price := strategy.position_avg_price
    strategy.exit("short exit", "short", stop = stopLoss)

if closeHA[1] < SAR and close > strategy.position_avg_price
    strategy.close("long", comment="Exit Long")

if closeHA[1] > SAR and close < strategy.position_avg_price
    strategy.close("short", comment="Exit Short")

p_ep = plot(entry_price, color=color.new(color.white, 0), linewidth=2, style=plot.style_linebr, title='entry price')
p_sl = plot(stopLoss, color=color.new(color.red, 0), linewidth=2, style=plot.style_linebr, title='stopLoss')
fill(p_sl, p_ep, color.new(color.red, transp=85))

plot(SAR, "ParabolicSAR", style=plot.style_circles, color=myColor, linewidth=1)
plot(ema, color=color.white, linewidth=2, title="EMA")