개요
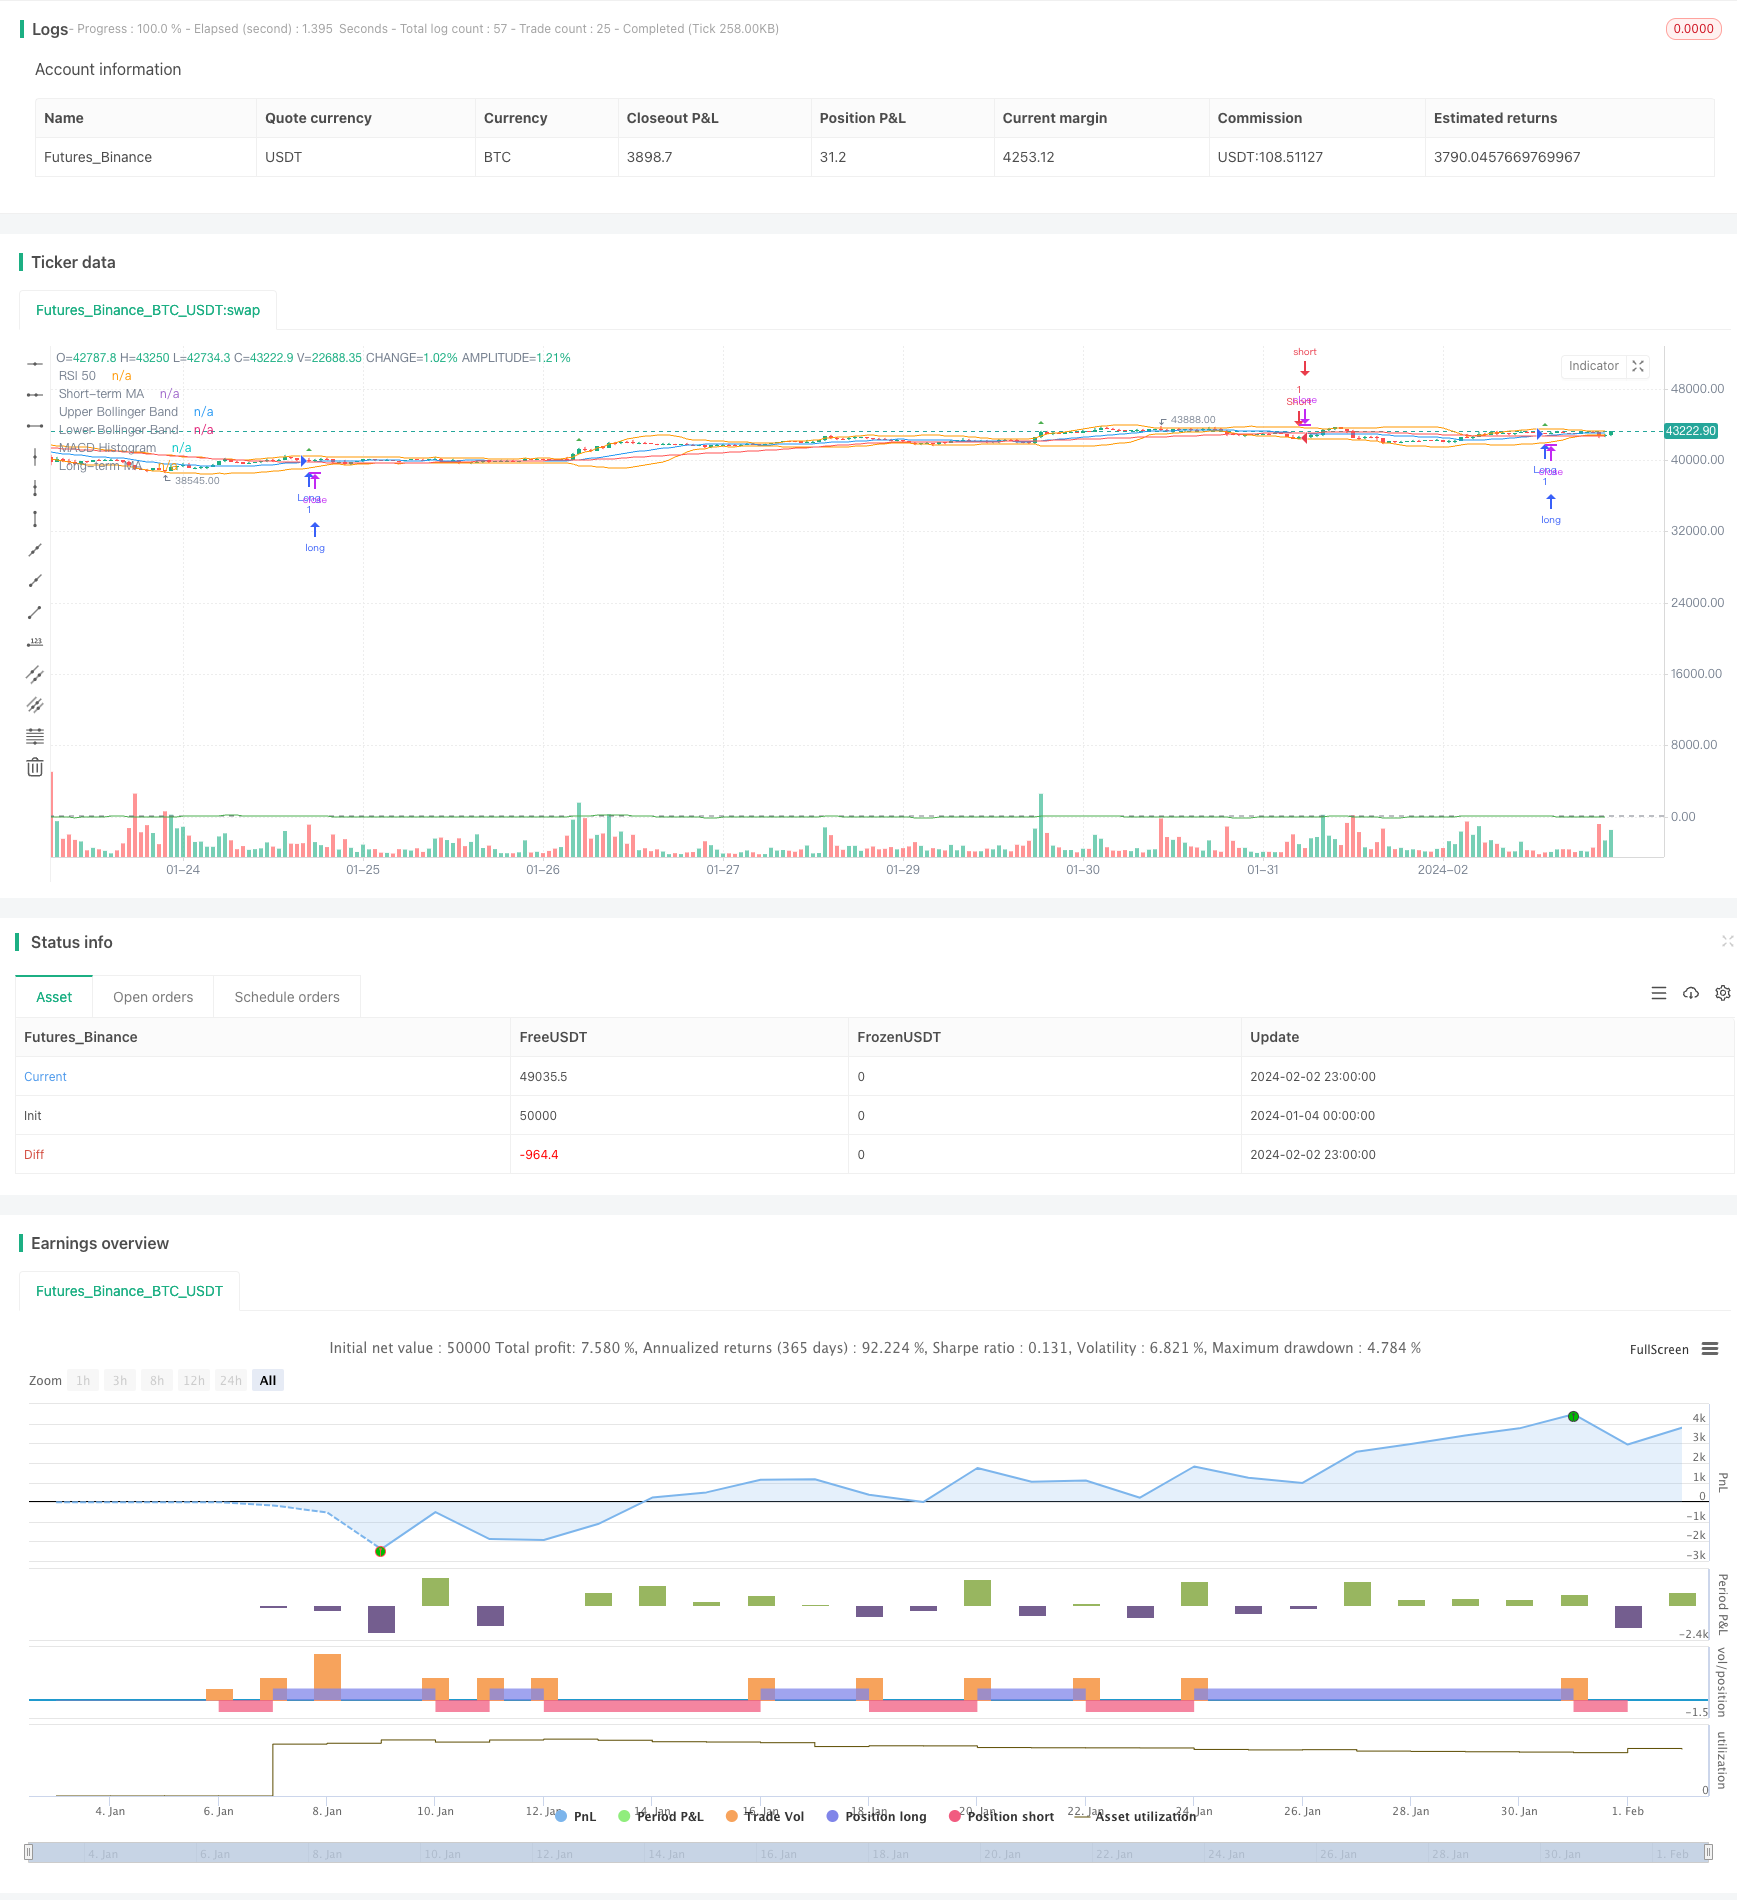
스윙 트레이딩 전략 (영어: Swing Trading Strategy Based on Momentum, Oscillation and Moving Average Crossover) 은 동력 지표, 진동 지표 및 이동 평균의 교차를 사용하여 구매 및 판매 신호를 제공하는 전략이다. 그것은 상품, 외환 등의 시장에서 일간 및 일간 거래에 사용할 수 있다.
전략 원칙
이 전략은 이동 평균, 상대적으로 약한 지표 (RSI), MACD, 그리고 브린과 함께 4개의 기술 지표를 사용하여 구매 및 판매 신호를 식별합니다. 구체적인 논리는 다음과 같습니다:
단기 이동 평균 위에 장기 이동 평균을 착용하고 RSI가 50보다 크면 더 많이; 단기 이동 평균 아래에 장기 이동 평균을 착용하고 RSI가 50보다 작으면 공백을 둡니다.
이러한 조합은 동선형의 골드 크로스 및 데이트 크로스를 사용하여 트렌드를 판단할 수 있으며, RSI에 트렌드 반전의 위험을 추가할 수 있습니다. MACD의 역할은 매매 지점을 결정하는 것이고, 브린의 역할은 손실 지점을 설정합니다.
우위 분석
이 전략의 가장 큰 장점은 지표 조합이 적절하고, 트렌드 지표와 충격 지표의 상호 보완성을 효과적으로 활용할 수 있다는 것입니다. 구체적으로:
- 이동 평균은 주요 트렌드 방향과 거래 신호 지점을 판단합니다.
- RSI는 트렌드 반전의 위험을 회피합니다.
- MACD는 특정 진입 지점을 결정하는데 도움을 줍니다.
- 브린 벨트 설정 중지
이러한 조합을 통해 각 지표의 장점을 최대한 발휘할 수 있으며, 동시에 상호 보완적일 수 있습니다.
위험 분석
이 전략의 주요 위험은 다음과 같습니다.
- 트렌드 반전 위험. 시장이 급격히 반전할 때, 이동 평균과 RSI가 적시에 신호를 주지 못하면 손실이 커질 수 있다.
- 위기 상황의 가짜 신호. 시장이 장기적으로 흔들릴 때, 이동 평균과 RSI는 종종 매수 신호를 주며, 쉽게 잡힐 수 있습니다.
- 매개 변수 설정이 잘못되었다. 매개 변수 설정이 잘못되었다면, 필터링 효과는 좋지 않으며, 잘못된 신호가 발생하기 쉽다.
이러한 위험을 제어하기 위해, 최적화 파라미터, 스톱 로즈 스톱을 설정, 합리적인 포지션 위치를 제어하는 등의 방법으로 관리할 수 있다.
최적화 방향
이 전략은 다음과 같은 부분에서 최적화될 수 있습니다.
- 다른 시장과 다른 주기적 변수 조합을 테스트하여 최적의 변수를 찾습니다.
- 지표의 변동성을 높여서 지진 상황을 더 잘 처리할 수 있습니다.
- 거래량 지표의 필터링 신호를 늘리고, 가짜 돌파구를 피하십시오.
- 딥러닝 알고리즘과 함께 실시간 최적화 파라미터를 사용하여 시스템을 더 똑똑하게 만들 수 있습니다.
- 이 논리들을 적용하여 수익을 더 높이고 손실을 줄일 수 있습니다.
요약하다
동적 흔들림 크로스 평평선 거래 전략은 트렌드 지표와 흔들림 지표의 장점을 활용하여 구매 시판 신호를 상호 보완적으로 식별합니다. 매개 변수 최적화 및 위험 관리가 적절한 경우 좋은 효과를 얻을 수 있습니다. 이 전략은 매개 변수, 스톱 로직 등의 측면을 더 최적화하여 더 뛰어난 성과를 얻을 수 있습니다.
//@version=5
strategy("Swing Trading Strategy", overlay=true)

// Input for moving averages
shortMA = input(20, title="Short-term MA")
longMA = input(50, title="Long-term MA")

// Input for RSI
rsiLength = input(14, title="RSI Length")

// Input for MACD
macdShort = input(12, title="MACD Short")
macdLong = input(26, title="MACD Long")
macdSignal = input(9, title="MACD Signal")

// Input for Bollinger Bands
bbLength = input(20, title="Bollinger Bands Length")
bbMultiplier = input(2, title="Bollinger Bands Multiplier")

// Calculate moving averages
shortTermMA = ta.sma(close, shortMA)
longTermMA = ta.sma(close, longMA)

// Calculate RSI
rsiValue = ta.rsi(close, rsiLength)

// Calculate MACD
[macdLine, signalLine, _] = ta.macd(close, macdShort, macdLong, macdSignal)

// Calculate Bollinger Bands
basis = ta.sma(close, bbLength)
upperBand = basis + bbMultiplier * ta.stdev(close, bbLength)
lowerBand = basis - bbMultiplier * ta.stdev(close, bbLength)

// Plot moving averages
plot(shortTermMA, color=color.blue, title="Short-term MA")
plot(longTermMA, color=color.red, title="Long-term MA")

// Plot RSI
hline(50, "RSI 50", color=color.gray)

// Plot MACD
plot(macdLine - signalLine, color=color.green, title="MACD Histogram")

// Plot Bollinger Bands
plot(upperBand, color=color.orange, title="Upper Bollinger Band")
plot(lowerBand, color=color.orange, title="Lower Bollinger Band")

// Strategy conditions
longCondition = ta.crossover(shortTermMA, longTermMA) and rsiValue > 50
shortCondition = ta.crossunder(shortTermMA, longTermMA) and rsiValue < 50

// Execute trades
strategy.entry("Long", strategy.long, when=longCondition)
strategy.entry("Short", strategy.short, when=shortCondition)

// Plot trade signals on the chart
plotshape(series=longCondition, title="Long Signal", color=color.green, style=shape.triangleup, size=size.small)
plotshape(series=shortCondition, title="Short Signal", color=color.red, style=shape.triangledown, size=size.small)