개요
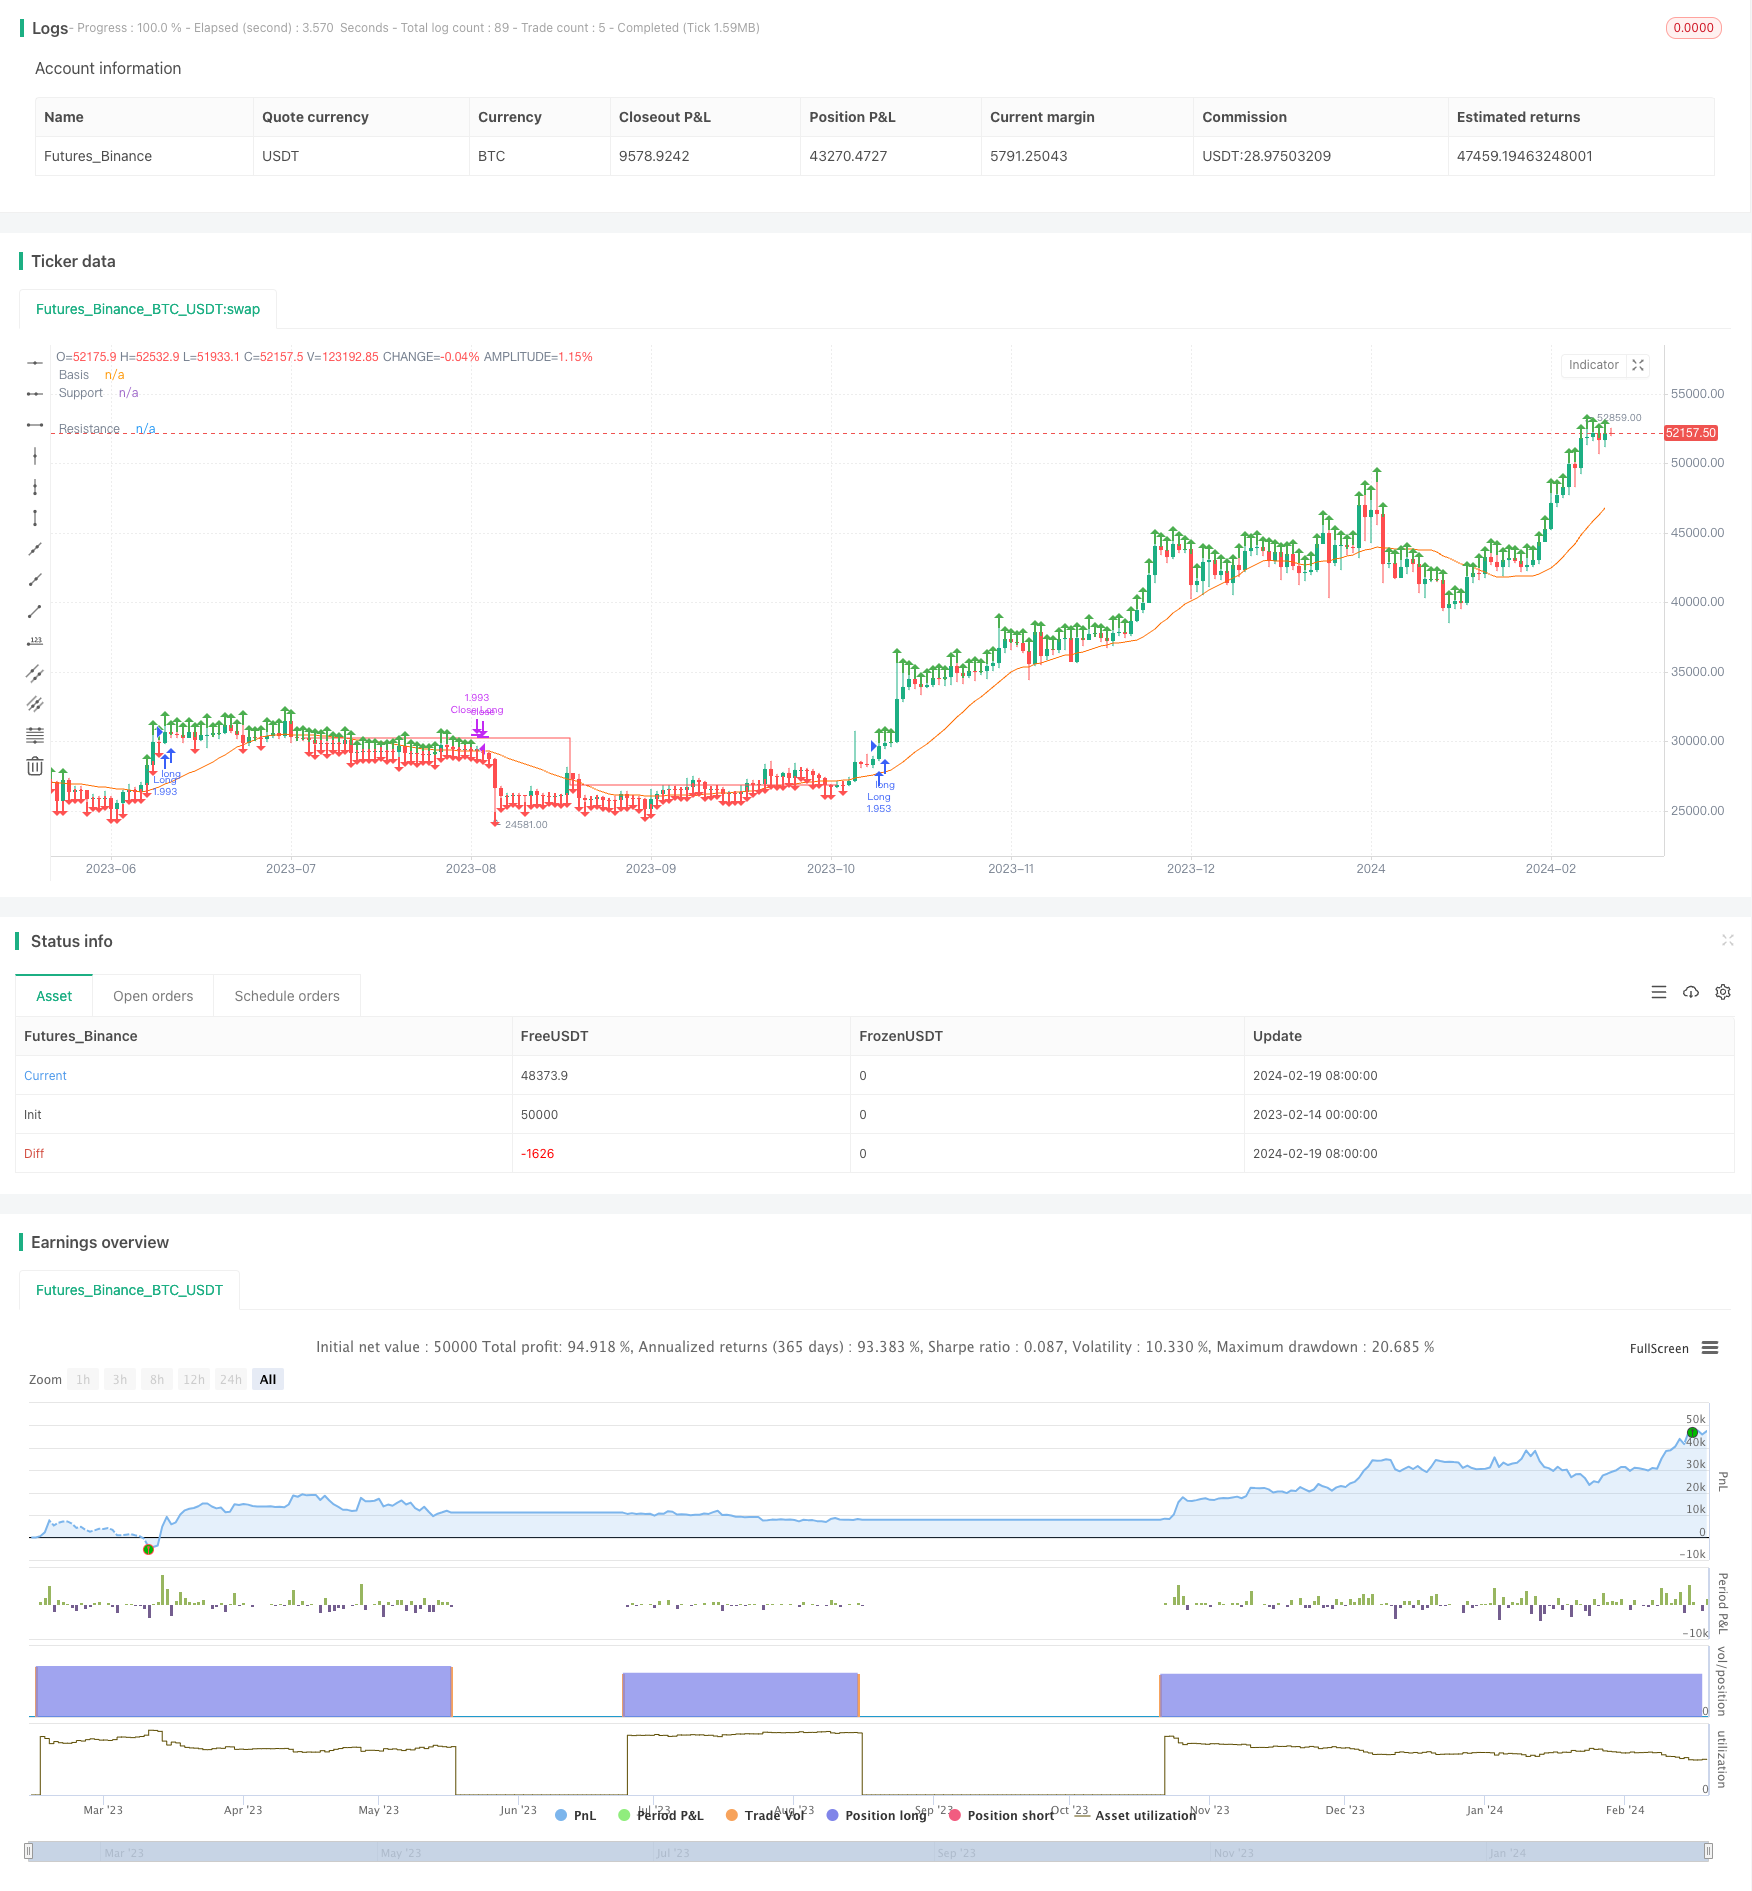
이 전략은 간단한 이동 평균을 기반으로 트렌드 방향을 결정하고, 저항지원선과 함께 돌파 신호를 형성하는 긴 선 포지션 전략이다. 가격의 Pivot 고점과 Pivot 저점을 계산하여, 저항선과 지지선을 그리며, 가격이 저항선 돌파를 할 때 더 많이하고, 지지선 돌파를 할 때 평소한다. 이 전략은 트렌드가 명백한 주식에 적합하며, 더 나은 위험-이익 비율을 얻을 수 있다.
전략 원칙
- 동향을 판단하는 기준으로 20일 간소 이동 평균을 계산합니다.
- 사용자 입력 변수에 따라 Pivot 하위점과 Pivot 하위점을 계산합니다.
- 피벗 고점과 피벗 저점에 따라 저항선과 지지선을 그리기
- 마감값이 저항선보다 높을 때 더 많은 입장을 취하십시오.
- 지지선 아래에서 저항선을 통과할 때 평행함
이 전략은 간단한 이동 평균을 사용하여 전체 트렌드 방향을 판단하고, 그 다음 핵심 포인트 브레이크를 사용하여 거래 신호를 형성하며, 전형적인 브레이크 타입 전략에 속한다. 핵심 포인트와 트렌드 판단을 통해 가짜 브레이크를 효과적으로 필터링 할 수 있다.
우위 분석
- 전략적 기회는 풍부하고, 동요가 높은 주식과 트렌드를 쉽게 잡을 수 있습니다.
- 위험 조절: 위험과 이익의 비율이 높다
- 해킹 신호를 사용하여 가짜 해킹의 위험을 피하십시오.
- 사용자 정의 가능한 파라미터, 적응력
위험 분석
- 변수 최적화에 의존하고, 변수가 잘못되면 가짜 돌파의 확률이 증가합니다.
- 갱신 신호 지연, 일부 기회를 놓칠 수 있다
- 지진으로 인한 손해
- 지원선 조정이 늦어지면 손실이 발생할 수 있습니다.
리스크를 줄일 수 있는 방법은 실디 최적화 매개 변수와 스톱 스톱 전략을 결합하는 것이다.
최적화 방향
- 이동 평균 주기 변수를 최적화
- 지원 저항선 파라미터를 최적화
- 더 많은 손실을 막는 전략
- 브레이크 확인 메커니즘
- 거래량과 같은 지표 필터링 신호
요약하다
이 전략은 전체적으로 전형적인 돌파구 전략으로, 변수 최적화와 유동성에 의존하며, 트렌드를 추적하는 거래자에게 적합하다. 참조 프레임워크로서, 실제 필요에 따라 모듈을 확장할 수 있으며, 손실 중지, 신호 필터링 등의 메커니즘을 통해 위험을 줄이고 안정성을 높인다.
전략 소스 코드
/*backtest
start: 2023-02-14 00:00:00
end: 2024-02-20 00:00:00
period: 1d
basePeriod: 1h
exchanges: [{"eid":"Futures_Binance","currency":"BTC_USDT"}]
*/

// This source code is subject to the terms of the Mozilla Public License 2.0 at https://mozilla.org/MPL/2.0/
// © CheatCode1

//@version=5
strategy("Quantitative Trend Strategy- Uptrend long", 'Steady Uptrend Strategy', overlay=true, initial_capital = 1500, default_qty_value = 100, commission_type = strategy.commission.percent, commission_value = 0.01, default_qty_type = strategy.percent_of_equity)


length = input.int(20, minval=1)
src = input(close, title="Source")
basis = ta.sma(src, length)
offset = input.int(0, "Offset", minval = -500, maxval = 500)
plot(basis, "Basis", color=#FF6D00, offset = offset)

inp1 = input.int(46, 'LookbackLeft')
inp2 = input.int(32, 'LookbackRight')

l1 = ta.pivothigh(close, inp1, inp2)
S1 = ta.pivotlow(close, inp1, inp2)

// plot(l1, 'Pivothigh', color.red, 1)
// // plot(S1, 'Pivot Low', color.red)

l1V = ta.valuewhen(l1, close, 0)
S1V = ta.valuewhen(S1, close, 0)

Plotl1 = not na(l1) ? l1V : na
PlotS1 = not na(S1) ? S1V : na

plot(Plotl1, 'Resistance', color.green, 1, plot.style_stepline, true)
plot(PlotS1, 'Support', color.red, 1, plot.style_stepline, true)

Priceforlong = close > l1V ? true : na
Priceforshort = close < S1V ? true : na

plotshape(Priceforlong ? high : na, 'p', shape.arrowup, location.abovebar, color.green, size = size.small)
plotshape(Priceforshort ? low : na, 's', shape.arrowdown, location.belowbar, color.red, size = size.small)

vol = volume
volma = ta.sma(vol, 20)

Plotl1C = ta.valuewhen(na(Plotl1), l1V, 0)
PlotS1C = ta.valuewhen(na(PlotS1), S1V, 0)
//Strategy Execution
volc = volume > volma

Lc1 = Priceforlong

Sc1 = Priceforshort

sL = Plotl1 < PlotS1 ? close : na
sS = PlotS1 > Plotl1 ? close : na


if Lc1
    strategy.entry('Long', strategy.long)
// if Sc1 and C2
//     strategy.entry('Short', strategy.short)

if Priceforshort
    strategy.cancel('Long')
if Priceforlong
    strategy.cancel('Short')


// Stp1 = ta.crossover(k, d)
// Ltp1 = ta.crossunder(k, d)
// Ltp = d > 70  ? Ltp1 : na
// Stp = d < 30  ? Stp1 : na


if strategy.openprofit >= 0 and sL
    strategy.close('Long')
if strategy.openprofit >= 0 and sS
    strategy.close('Short')
takeP = input.float(2, title='Take Profit') / 100
stopL = input.float(1.75, title='Stop Loss') / 100


// // Pre Directionality

Stop_L = strategy.position_avg_price * (1 - stopL)

Stop_S = strategy.position_avg_price * (1 + stopL)

Take_S= strategy.position_avg_price * (1 - takeP)

Take_L = strategy.position_avg_price * (1 + takeP)

// sL = Plotl1 < PlotS1 ? close : na
// sS = PlotS1 < Plotl1 ? close : na

// //Post Excecution
if strategy.position_size > 0 and not (Lc1)
    strategy.exit("Close Long", stop = Stop_L, limit = Take_L)

if strategy.position_size < 0 and not (Sc1)
    strategy.exit("Close Short", stop = Stop_S, limit = Take_S)