문 플래그 MACD 모멘텀 StochRSI 트레이딩 전략

개요
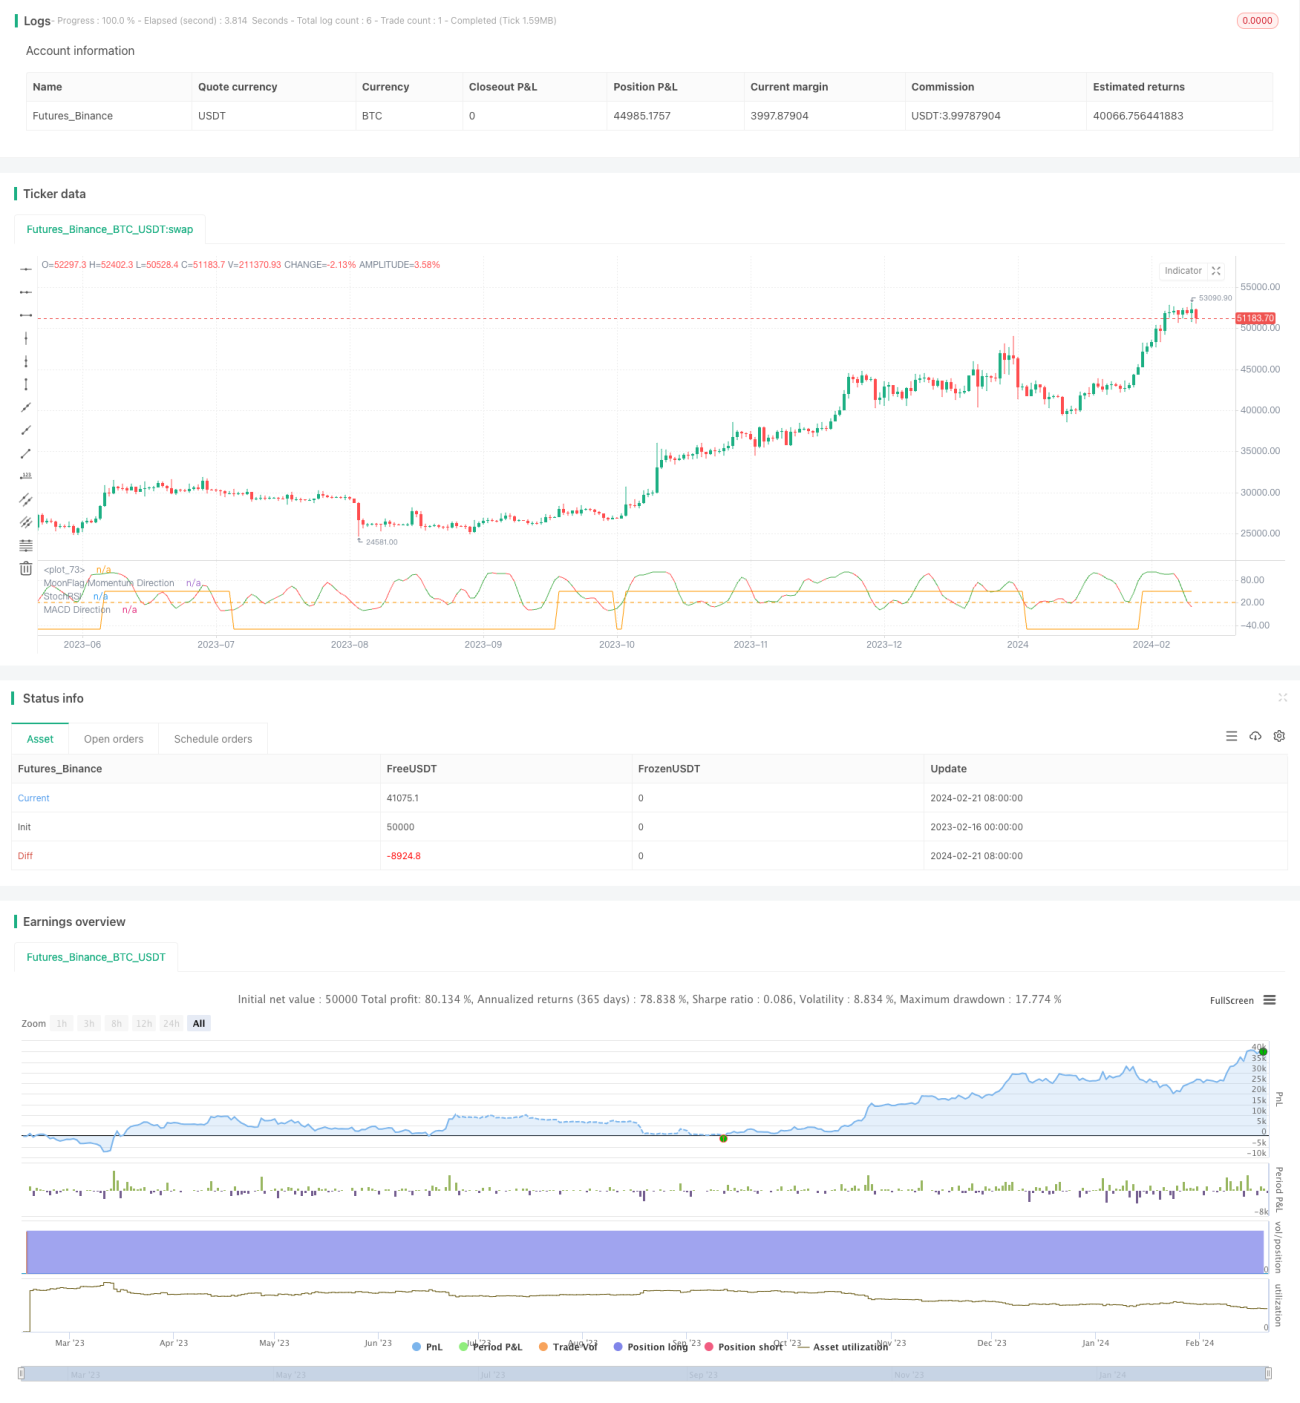
달의 깃발 MACD 동력 StochRSI 거래 전략은 MACD, 동력 및 StochRSI를 사용하여 세 가지 지표를 판단하는 양적 거래 전략입니다. 이 전략은 주로 비트코인과 에티오늄의 일계 거래에 적용됩니다.
전략 원칙
이 전략은 다음과 같은 몇 가지 주요 지표를 사용하여 판단합니다.
-
MACD 지수: 빠른 SMA 주기는 50, 느린 SMA 주기는 200, 시장에서 흔히 사용되는 50 일선과 200 일선. 이 지수는 시장의 장기적인 경향 방향을 판단한다.
-
자체 생성 된 동력 지표: 본질적으로 스토흐 지표와 비슷하며, 시장의 단기 동력 방향을 판단하기 위해 사용됩니다.
-
StochRSI: 시장의 강도와 과매매를 판단하는 지표
다목적으로 들어가기 위해서는 MACD>0 (중장기 동향을 나타낸다는 뜻) 과 자작동량 지표>0 (단기 동향을 나타낸다는 뜻) 과 종결 가격보다 하루 전일 상승 (현재 상승세를 나타낸다는 뜻) 을 동시에 충족해야 한다.
평평한 다중 헤드 신호는 다소 복잡하며, MACD <0, 자작동량 지표 <0, 종전 가격보다 낮아진 것과 StochRSI>20의 4가지 조건을 동시에 충족시켜야 한다.
이 전략은 중·장기적 추세와 단기적 동력과 현재의 추세를 종합적으로 판단하여, 좀 더 안정적인 돌파구 시스템이다.
전략적 이점
-
여러 지표의 통합 판단을 통해 잘못된 신호를 피하십시오.
-
MACD 변수는 시장에서 중요한 50 일선과 200 일선을 고려하여 선택되었습니다.
-
각 지표 매개 변수를 테스트한 후, 전략 효과는 크게 변하지 않고, 과 적합성의 위험을 피합니다.
-
데이터의 신뢰도도 높습니다.
전략적 위험
-
<unk>은 시스템으로 인해 거래가 늘어나고 슬라이드 포인트 비용이 증가할 수 있습니다.
-
통합 다중 지표 판단의 복잡성, 매개 변수 조정 및 최적화 난이도
-
낮 시간 단선 운영은 위험하다
전략 최적화
-
거래량 분석과 같은 더 많은 지표와 함께
-
기계 학습 알고리즘을 추가하여 동적 변수 최적화를 구현합니다.
-
거래 주파수를 낮추고 더 높은 주기로 전환하여 판단하십시오.
요약하다
월표 MACD 동력 StochRSI 거래 전략은 시장의 추세와 강도를 판단하는 여러 지표를 통합하고, 재측량 효과가 좋으며, 신뢰성이 높으며, 경험이 많은 양자 거래자가 고품질의 디지털 통화에서 적용하고 최적화 할 수 있습니다.
/*backtest
start: 2023-02-16 00:00:00
end: 2024-02-22 00:00:00
period: 1d
basePeriod: 1h
exchanges: [{"eid":"Futures_Binance","currency":"BTC_USDT"}]
*/

// // This Pine Script™ code is subject to the terms of the Mozilla Public License 2.0 at https://mozilla.org/MPL/2.0/
// // © MoonFlag
//@version=5
strategy("MoonFlag 1D MACD Momentum StochRSI Strategy", max_bars_back=500, overlay=false, initial_capital=5000, default_qty_type=strategy.percent_of_equity, default_qty_value=80, pyramiding=0, calc_on_order_fills=true)- 1