개요
이것은 트렌드 상황에서 더 큰 방향성 기회를 잡을 수 있는 3개의 초트렌드 지표를 사용하여 거래 결정을 내리는 전략이다.
전략 원칙
이 전략은 ta.supertrend() 함수를 사용하여 3개의 다른 파라미터 세트의 초상향 지표를 계산한다. 10일 3배의 ATR의 초상향 1, 14일 2배의 ATR의 초상향 2, 그리고 20일 2.5배의 ATR의 초상향 3을 각각 계산한다. 가격이 상단 세 개의 초상향을 통과했을 때 구매 신호를 생성한다. 가격이 아래의 세 개의 초상향을 통과했을 때 판매 신호를 생성한다.
초상향 지표는 ATR 지표와 결합하여 가격 변화의 흐름을 효과적으로 추적할 수 있다. 초상향을 세 배로 겹치는 전략은 신호를 더 신뢰할 수 있게 하여 트렌드 상황에서 더 큰 수익을 얻을 수 있다.
전략적 이점
- 트리플 필터 메커니즘, 가짜 신호를 방지, 신호 품질을 향상
- 초 트렌드 지표는 그 자체로 좋은 소음 제거 기능을 가지고 있습니다.
- 더 넓은 시장 환경에 맞게 여러 초변수 조합을 구성할 수 있습니다.
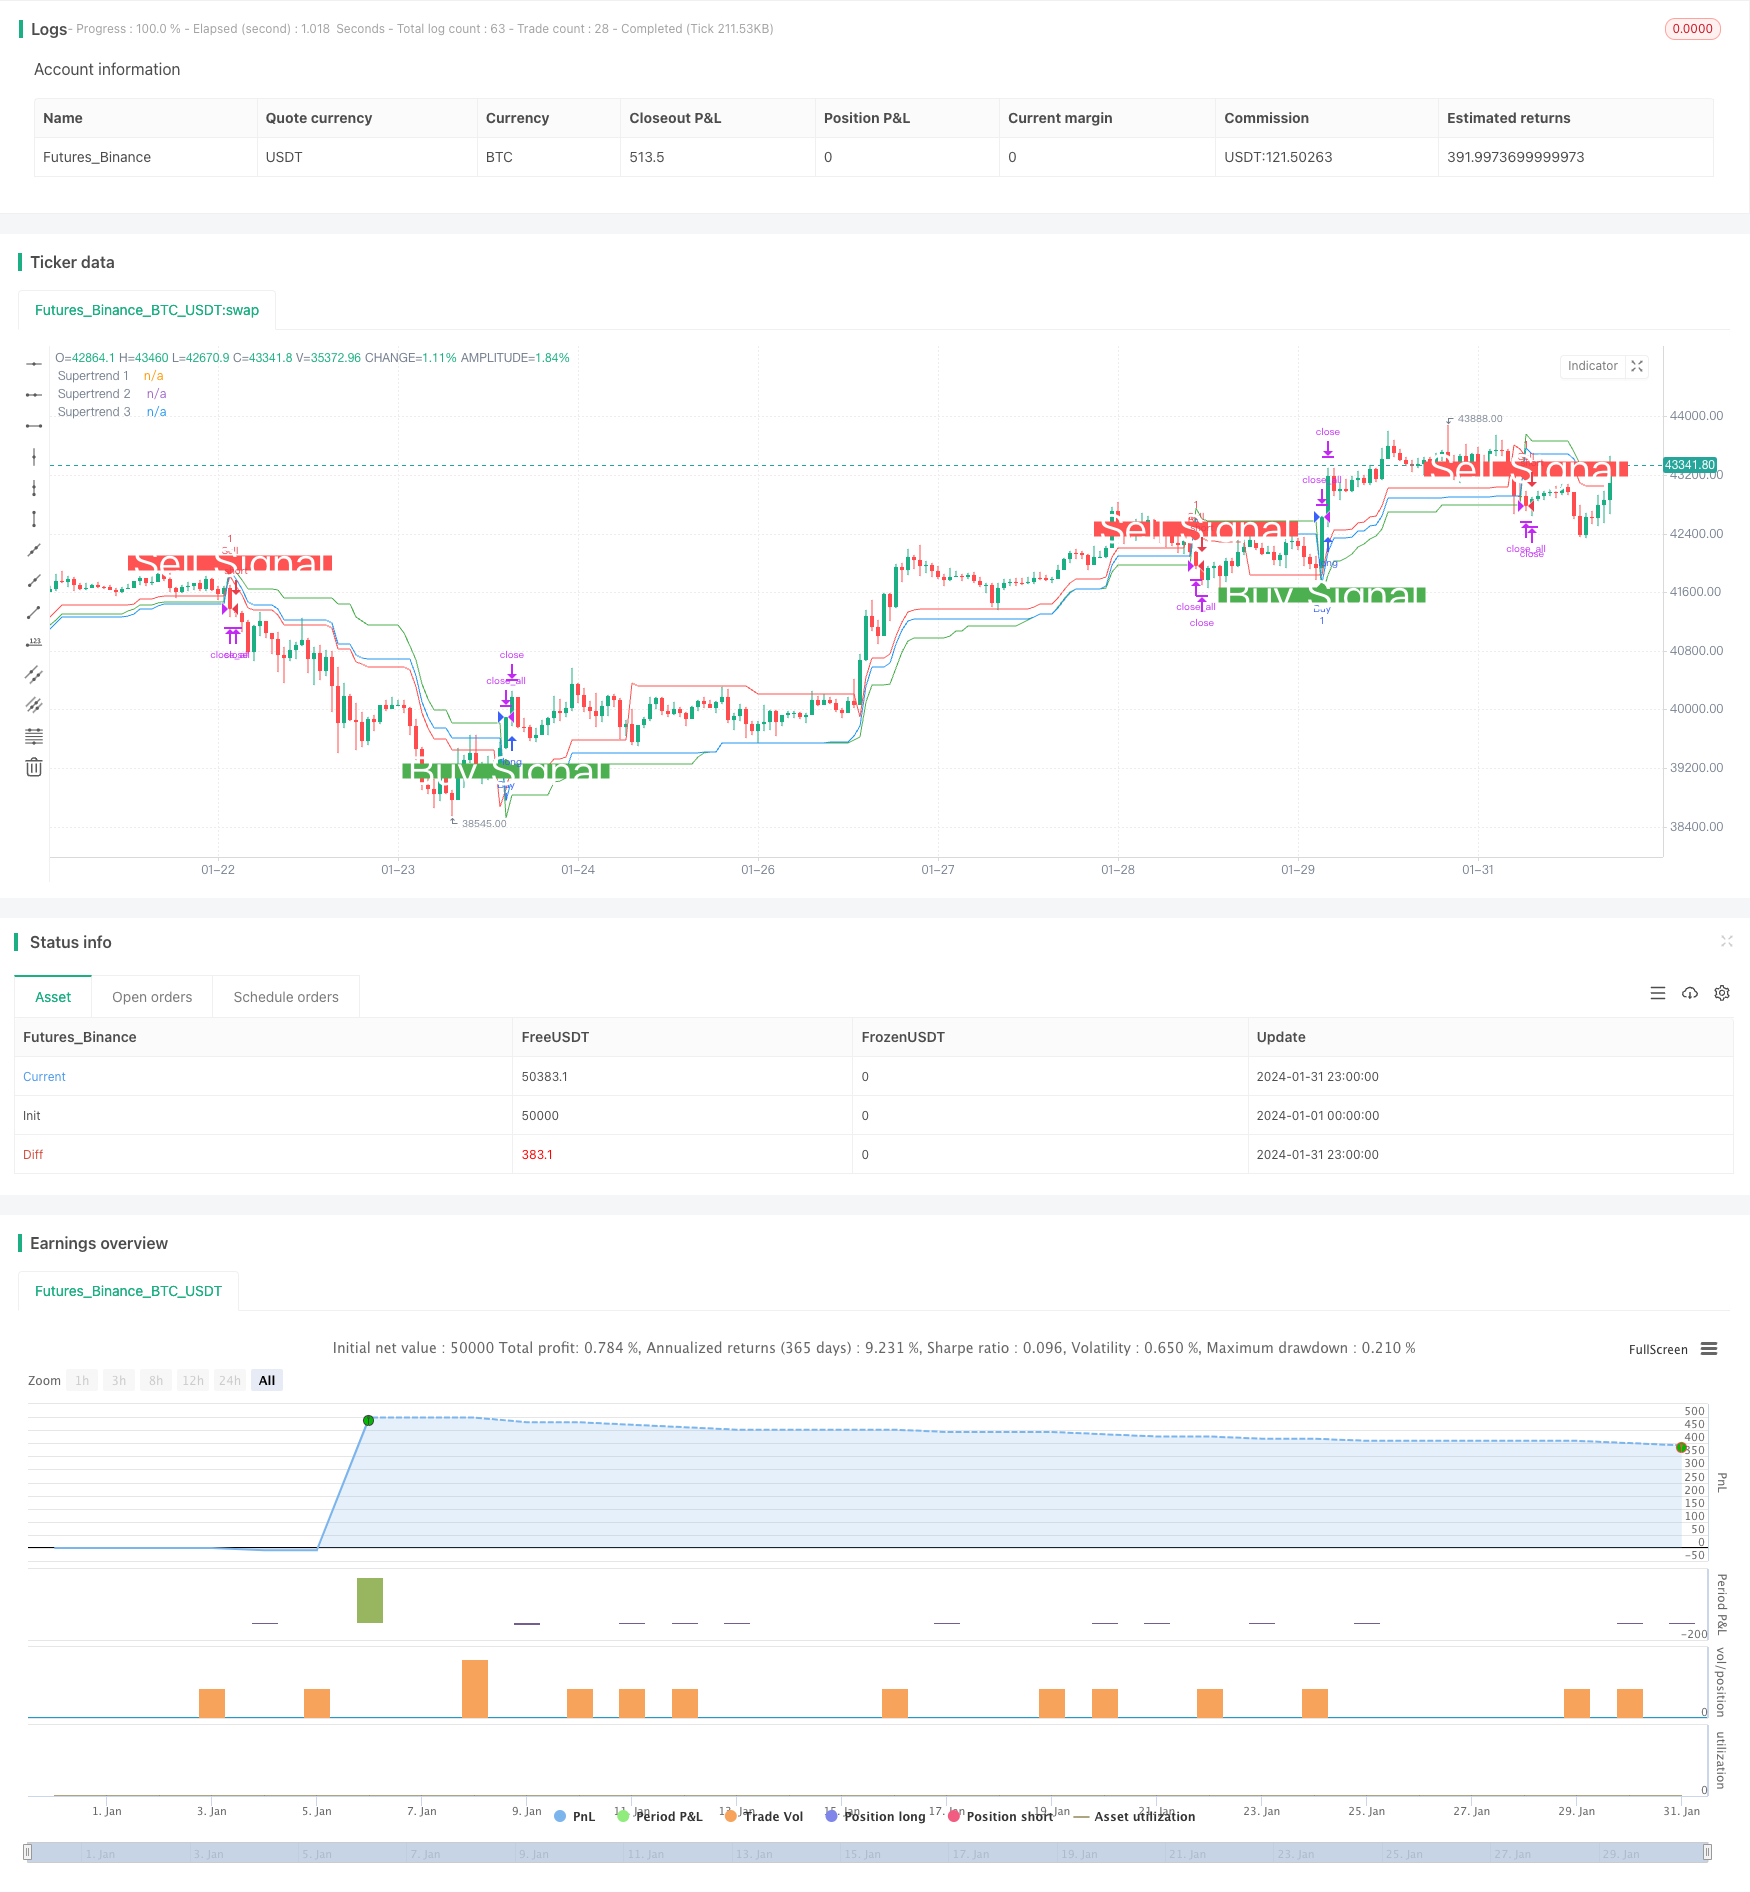
- 역사적인 테스트에서 좋은 성과, 높은 수익과 위험
전략적 위험
- 다중 필터링 신호가 일부 기회를 놓칠 수 있습니다.
- “지난 몇 주 동안, 우리는 매우 불안해하고 있었습니다.
- 3개의 초변의 조합을 최적화해야 합니다.
- 중앙 거래 시간은 갑작스러운 사건에 취약합니다.
위험성을 줄이기 위해 다음과 같은 것들을 고려할 수 있습니다.
- 필터링 조건을 조정하여 1~2개의 초고향을 유지합니다.
- 더 많은 손실을 막는 전략
- 초변수를 최적화하여 승률을 높여라
전략 최적화 방향
- 더 많은 변수 조합을 테스트하여 최적의 초변수를 찾습니다.
- 기계 학습 알고리즘을 추가하고 실시간 최적화 매개 변수를 추가합니다.
- 단편적 손실을 통제하기 위한 전략
- 다른 지표들과 함께, 추세와 흔들림을 식별합니다.
- 거래 시간을 확장하여 단일 시간 노드의 위험을 피하십시오.
요약하다
이 전략은 트리플 중첩 초 트렌드를 통해 의사 결정을 내리고, 트렌드 방향을 효과적으로 식별할 수 있다. 그것은 신호 품질이 높고, 매개 변수가 최적화 될 수 있는 장점이 있다. 또한, 특정 위험이 존재하며, 매개 변수와 퇴출 시기를 다른 시장 환경에 적응하기 위해 조정해야 한다.
전략 소스 코드
/*backtest
start: 2024-01-01 00:00:00
end: 2024-01-31 23:59:59
period: 1h
basePeriod: 15m
exchanges: [{"eid":"Futures_Binance","currency":"BTC_USDT"}]
*/

//@version=5
strategy('Combined Supertrend Strategy - Ajit Prasad', overlay=true)

// Function to calculate Supertrend
supertrendFunc(atrLength, factor) =>
    [supertrend, direction] = ta.supertrend(factor, atrLength)
    [supertrend, direction]

// Input parameters for the first Supertrend
atrPeriod1 = input(10, 'ATR Length 1')
factor1 = input(3, 'Factor 1')

// Calculate the first Supertrend
[supertrend1, direction1] = supertrendFunc(atrPeriod1, factor1)

// Input parameters for the second Supertrend
atrPeriod2 = input(14, 'ATR Length 2') // Change values as needed
factor2 = input(2, 'Factor 2') // Change values as needed

// Calculate the second Supertrend
[supertrend2, direction2] = supertrendFunc(atrPeriod2, factor2)

// Input parameters for the third Supertrend
atrPeriod3 = input(20, 'ATR Length 3') // Change values as needed
factor3 = input(2.5, 'Factor 3') // Change values as needed

// Calculate the third Supertrend
[supertrend3, direction3] = supertrendFunc(atrPeriod3, factor3)

// Define market opening and closing times
marketOpenHour = 9
marketOpenMinute = 15
marketCloseHour = 15
marketCloseMinute = 30
exitTimeHour = 15
exitTimeMinute = 10

// Fetch historical close values using security function
histClose = request.security(syminfo.tickerid, "D", close)

// Buy condition
buyCondition = close > supertrend1 and close > supertrend2 and close > supertrend3 and close[1] <= supertrend1[1]

// Sell condition
sellCondition = close < supertrend1 and close < supertrend2 and close < supertrend3 and close[1] >= supertrend1[1]

// Exit conditions
buyExitCondition = close < supertrend1[1] or close < supertrend2[1] or close < supertrend3[1]
sellExitCondition = close > supertrend1[1] or close > supertrend2[1] or close > supertrend3[1]

// Execute orders with market timing
if true
    // Buy condition without 'and not'
    strategy.entry('Buy', strategy.long, when = buyCondition)

    // Sell condition without 'and not'
    strategy.entry('Sell', strategy.short, when = sellCondition)

    // Close conditions
    strategy.close('Buy', when = buyExitCondition )
    strategy.close('Sell', when = sellExitCondition)

// Close all trades at 3:10 pm IST
if true
    strategy.close_all()

// Plot Supertrends
plot(supertrend1, 'Supertrend 1', color=color.new(color.green, 0), style=plot.style_linebr)
plot(supertrend2, 'Supertrend 2', color=color.new(color.red, 0), style=plot.style_linebr)
plot(supertrend3, 'Supertrend 3', color=color.new(color.blue, 0), style=plot.style_linebr)

// Plot labels
plotshape(buyCondition, style=shape.labelup, location=location.belowbar, color=color.new(color.green, 0), size=size.large, text='Buy Signal', textcolor=color.new(color.white, 0))
plotshape(sellCondition, style=shape.labeldown, location=location.abovebar, color=color.new(color.red, 0), size=size.large, text='Sell Signal', textcolor=color.new(color.white, 0))