듀얼 트렌드 팔로잉 양적 전략

1
Follow
1782
Followers
개요
이 전략의 핵심 아이디어는 123 역전 전략과 무지개 진동기 지표를 결합하여 전략의 성공률을 높이기 위해 이중 트렌드 추적을 구현하는 것입니다. 이 전략은 단기 및 중기 가격 트렌드를 추적하여 포지션을 동적으로 조정하여 대장 이상의 초과 수익을 달성합니다.
전략 원칙
이 전략은 두 부분으로 구성되어 있습니다.
-
123 역전략: 만약 지난 2일 종결값이 하락하고 오늘 종결값이 상승하고 9일 슬로 K 라인이 50보다 낮다면, 더 많은 것을; 만약 지난 2일 종결값이 상승하고 오늘 종결값이 하락하고 9일 패스트 K 라인이 50보다 높다면, 공백을 <unk>다.
-
무지개 진동기 지표: 이 지표는 이동 평균에 대한 가격의 편차를 나타냅니다. 지표가 80 이상이면 시장이 불안정해지는 것을 나타냅니다. 지표가 20 이하이면 시장이 역전되는 것을 나타냅니다.
이 전략은 둘을 결합하고, 동시에 더 많은 코스피 신호가 발생했을 때 포지션을 열고, 그렇지 않으면 포지션을 평정한다.
우위 분석
이 전략은 다음과 같은 장점을 가지고 있습니다.
- 이중 필터링으로 신호 품질을 높이고 오차율을 낮춘다.
- 동적으로 포지션을 조정하여 일방적인 손실을 줄여줍니다.
- 단기 및 중기 지표를 통합하여 전략적 안정성을 높여라.
위험 분석
이 전략에는 다음과 같은 위험도 있습니다.
- 매개 변수 최적화가 잘못되면 과합이 발생할 수 있습니다.
- 이중 포지션은 거래 비용을 증가시킵니다.
- 금고의 가격이 급격하게 변동할 때, 스톱피스 포인트는 쉽게 뚫릴 수 있다.
이러한 위험은 변수 조정, 포지션 관리를 최적화, 합리적인 스톱로스 설정으로 줄일 수 있습니다.
최적화 방향
이 전략은 다음과 같은 측면에서 최적화될 수 있습니다.
- 최적화된 변수를 찾아서 최적의 변수 조합을 찾습니다.
- 포지션 관리 모듈을 추가하여 변동률과 회수 동력에 따라 포지션을 조정합니다.
- 스톱 손실 모듈을 추가하고, 이동 스톱 손실을 합리적으로 설정한다.
- 트렌드 전환점을 판단하는 데 도움이 되는 기계 학습 알고리즘을 추가합니다.
요약하다
이 전략은 123 역전 전략과 무지개 진동기 지표를 통합하여, 두 개의 트렌드 추적을 구현하고, 높은 안정성을 유지하면서도, 약간의 초과 수익의 여지가 있습니다. 지속적인 최적화를 통해, 전략 수익률을 더욱 향상시킬 수 있습니다.
Source
Pine
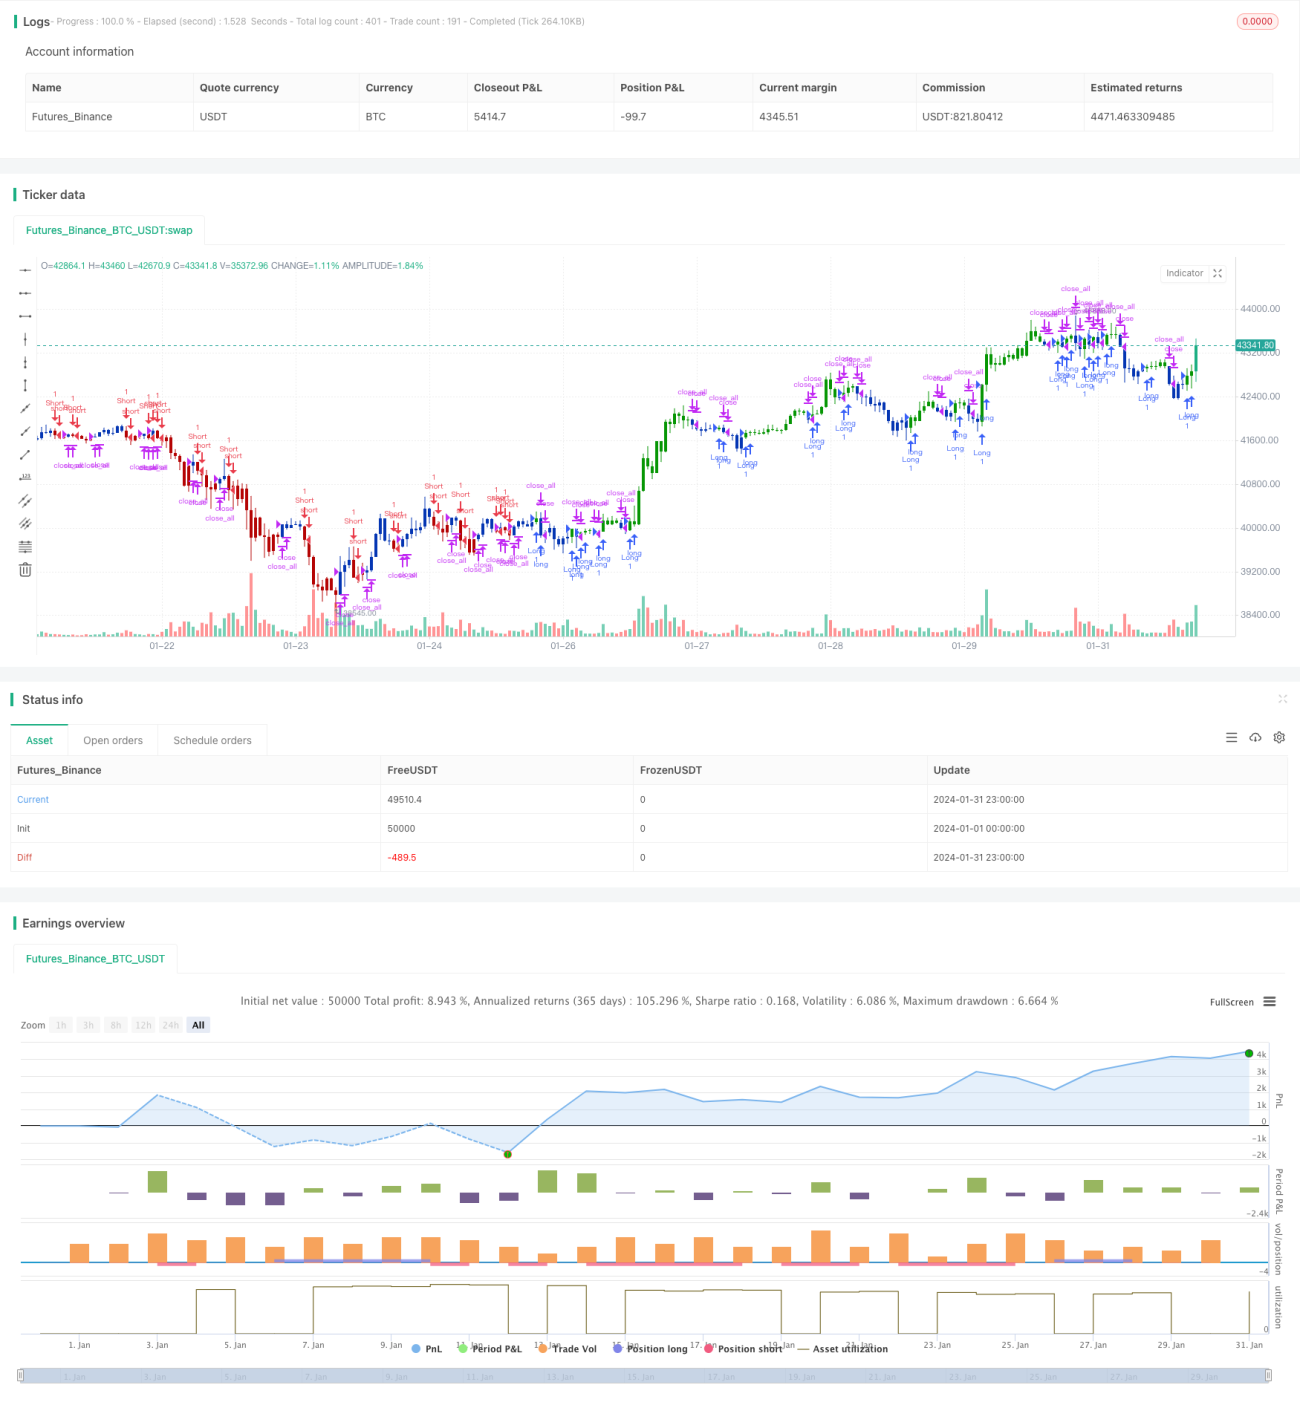
/*backtest
start: 2024-01-01 00:00:00
end: 2024-01-31 23:59:59
period: 1h
basePeriod: 15m
exchanges: [{"eid":"Futures_Binance","currency":"BTC_USDT"}]
*/

//@version=4
////////////////////////////////////////////////////////////
//  Copyright by HPotter v1.0 25/05/2021
// This is combo strategies for get a cumulative signal. Strategy parameters
Related strategies
Comment
All comments (0)
No data
- 1