
1
Follow
1782
Followers
개요
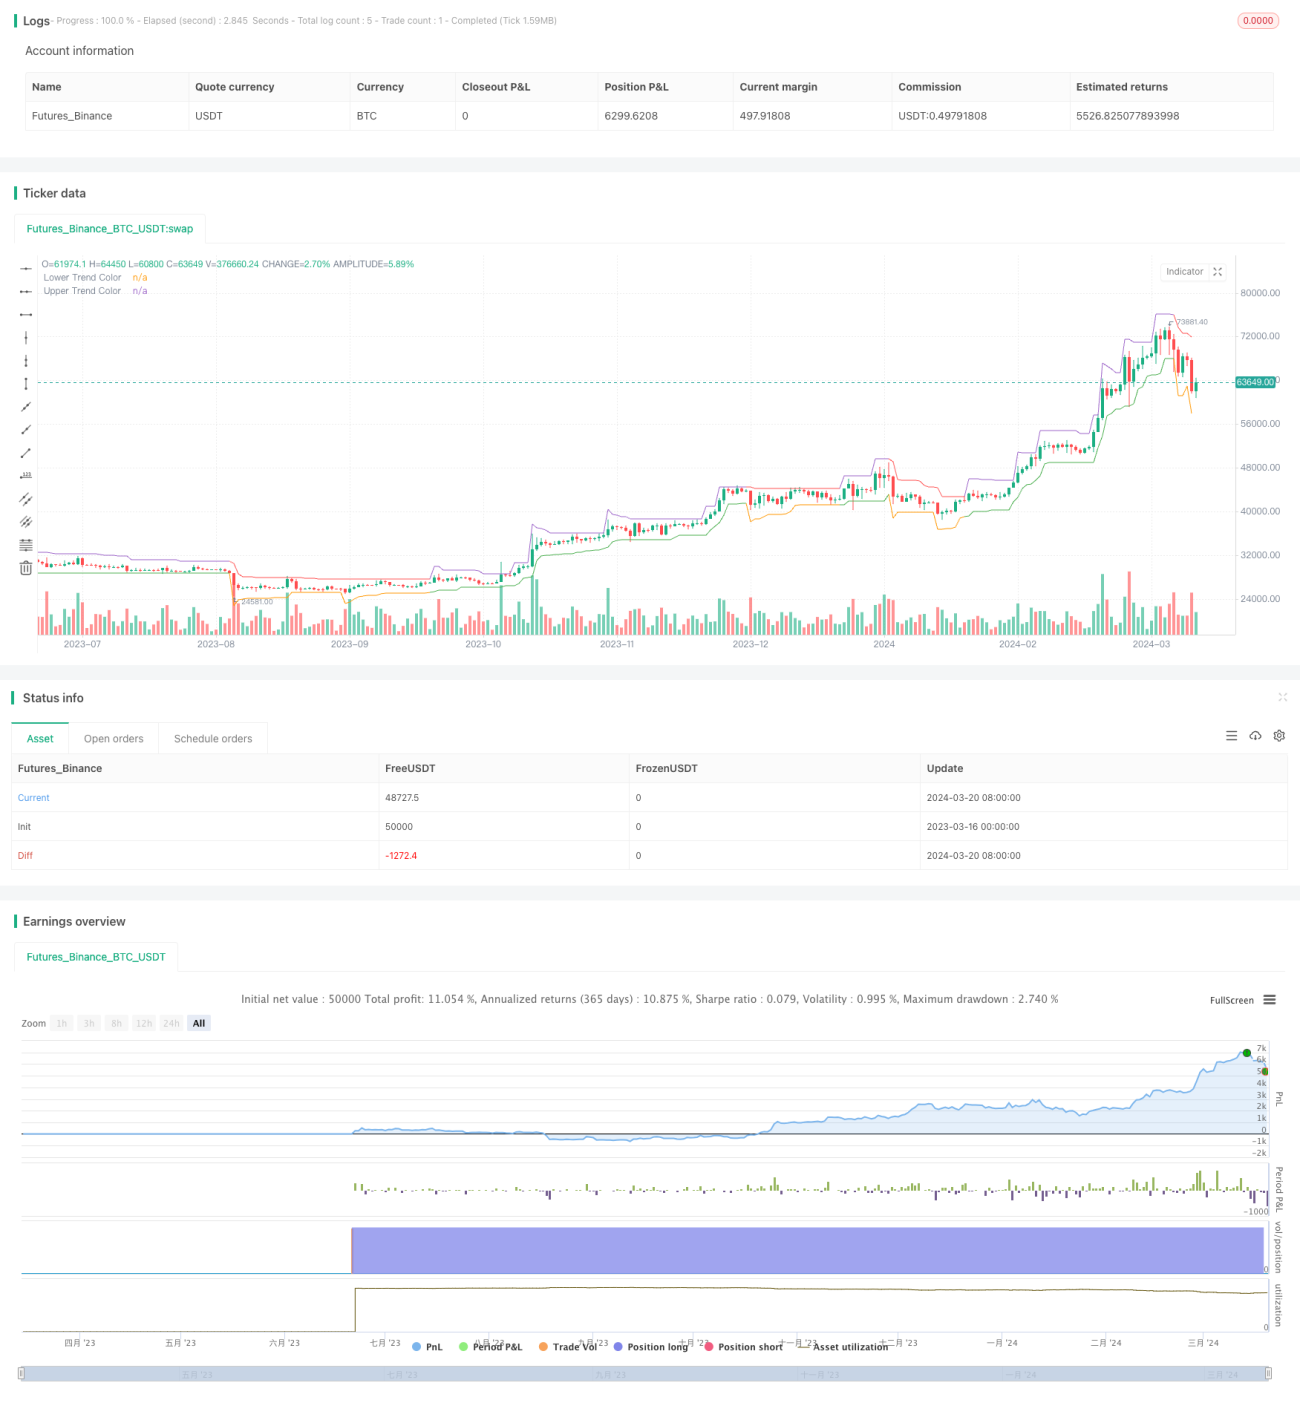
이것은 ATR 지표와 종결 가격을 사용하여 트렌드 브레이크를 포착하는 양적 거래 전략이다. 이 전략은 동적으로 상하 트렌드 라인을 계산하여 트렌드 방향을 판단하고, 종결 가격이 트렌드 라인을 깨면 거래 신호를 발생시킨다. 이 전략은 동시에 중지 손실과 목표 가격을 설정하며, 변동성에 따라 이동 중지 할 수 있습니다.
전략 원칙
- ATR 신호를 계산한다: atr_signal = atr ((atr_period)
- 위아래 트렌드 라인을 계산해 봅시다.
- 아래 트렌드 라인: lower_trend = low - atr_mult*atr_signal
- 상향 트렌드 라인: upper_trend = high + atr_mult*atr_signal
- 동적으로 트렌드 라인을 조정합니다. 트렌드 라인이 깨지면 변하지 않고 최신 값으로 업데이트됩니다.
- 트렌드 라인 색상은 종전 가격과 트렌드 라인의 상대적인 위치에 따라 트렌드 방향을 판단합니다.
- 트레이딩 신호를 생성합니다.
- 더 많은 신호: 현재 포지션이 없으며 종결 가격이 상승 동향선을 돌파했습니다.
- 공백 신호: 현재 포지션이 없으며 종결 가격이 하향 트렌드 라인을 돌파했다.
- 스톱로즈와 타겟 가격을 설정합니다.
- 스톱: 최신 거래 가격 ± ATR 파동폭 factor
- 목표 가격: 최신 거래 가격 ± 스톱로스 마인드 * 수익/손실 비율rr
- 이동 상쇄:
- 다단계 상쇄: 상위 트렌드라인
- 빈 머리 상쇄: 가장 낮은 트렌드 라인
우위 분석
- 변동률에 따라 동적으로 조정되는 트렌드 라인, 시장의 상황에 따라 조정
- 트렌드 라인은 방향을 나타내는 색으로 표시되어 있으며 트렌드를 식별합니다.
- ATR을 변동율의 척도로 사용하여 합리적인 스톱로스 및 목표 가격을 설정합니다.
- 이동식 중지 기능, 수익을 보장하면서 가능한 한 인출을 최소화
- 변수화도 높고, 다양한 품종과 주기에 적응
위험 분석
- 트렌드 브레이크 전략은 흔들리는 시장에서 과도한 신호를 발생시키며 손실을 초래할 수 있습니다.
- ATR 매개 변수를 잘못 선택하면 트렌드 라인이 너무 민감하거나 느려져 신호 품질에 영향을 줄 수 있습니다.
- 고정된 이익/손실 비율은 시장의 특성에 맞지 않을 수 있습니다.
- 이동 상쇄 손실은 추세를 놓칠 수 있습니다.
해결책:
- 트렌드 필터 또는 충격 지표 보조 판단을 도입하여 충격 시장 손실을 피하십시오.
- 품종 및 주기 특성에 따라 각각 ATR 변수를 최적화
- 적당률 최적화 및 이동 중지 논리, 전략 수익 위험 비율을 향상
- 트렌드 인식 방법을 결합하여 이동적 손실을 개선하여 더 많은 트렌드 수익을 잡을 수 있습니다.
최적화 방향
- 다중 시간 주기를 결합하여, 큰 주기로 트렌드를 식별하고, 작은 주기로 신호를 유발합니다.
- 트렌드 라인이 깨지기 전에 수량 지표 검증을 추가하여 신호의 효과를 높인다.
- 포지션 관리를 최적화하고, 대역을 추가합니다.
- 스톱 손실과 수익 손실 비율에 대한 파라미터 최적화
- 이동 상쇄 논리를 개선하여 트렌드 상에서 조기 상쇄를 줄이십시오.
다중 시간 주기는 노이즈를 필터링하는 데 도움이 되며, 트렌드를 파악하는 데 더 안정적이다. <unk>기 전의 양값 지표 검증은 거짓 신호를 제거한다. 포지션 관리의 최적화는 자금 사용 효율성을 향상시킨다. <unk>손실 비율과 <unk>손실 비율의 매개 변수의 최적화는 전략 수익 위험 비율을 개선한다. 이동식 <unk>손실 논리의 개선은 회수 제어와 동시에 더 많은 트렌드 수익을 얻을 수 있다.
요약하다
이 전략은 ATR을 변동률으로 측정하고, 동적으로 트렌드 라인 위치를 조정하여 트렌드 돌파 상황을 포착한다. 합리적으로 중지 손실과 수익 목표를 설정하고, 모바일 중지 손실을 사용하여 수익을 잠금한다. 매개 변수는 조정 가능하며, 적응력이 강하다. 그러나 트렌드 돌파 전략은 변동적인 상황에 영향을 받기 쉽고, 추가 최적화 및 개선이 필요합니다.
Source
Pine
/*backtest
start: 2023-03-16 00:00:00
end: 2024-03-21 00:00:00
period: 1d
basePeriod: 1h
exchanges: [{"eid":"Futures_Binance","currency":"BTC_USDT"}]
*/

//@version=4
strategy(title = "Claw-Pattern", overlay=true, calc_on_every_tick=true, default_qty_type= strategy.percent_of_equity,default_qty_value=10, currency="USD")
//Developer: Trading Strategy Guides
//Creator: Trading Strategy GuidesStrategy parameters
Related strategies
Comment
All comments (0)
No data
- 1