EMA/SMA berwarna purata bergerak
Penulis:ChaoZhang, Tarikh: 2022-05-11 21:03:07Tag:EMA
Amazon Prime Video mempresentasikan Lagu Video Garaj Garaj Jugalbandi dari Bandish Bandits. Lagu rakyat yang dinyanyikan oleh Ritwik Bhowmik dan Atul Kulkarni, dinyanyikan oleh Farid Hasan & Mohammed Aman, muzik diarahkan oleh Shankar Ehsaan Loy dan lirik oleh Sameer Samant.
Ujian belakang
/*backtest
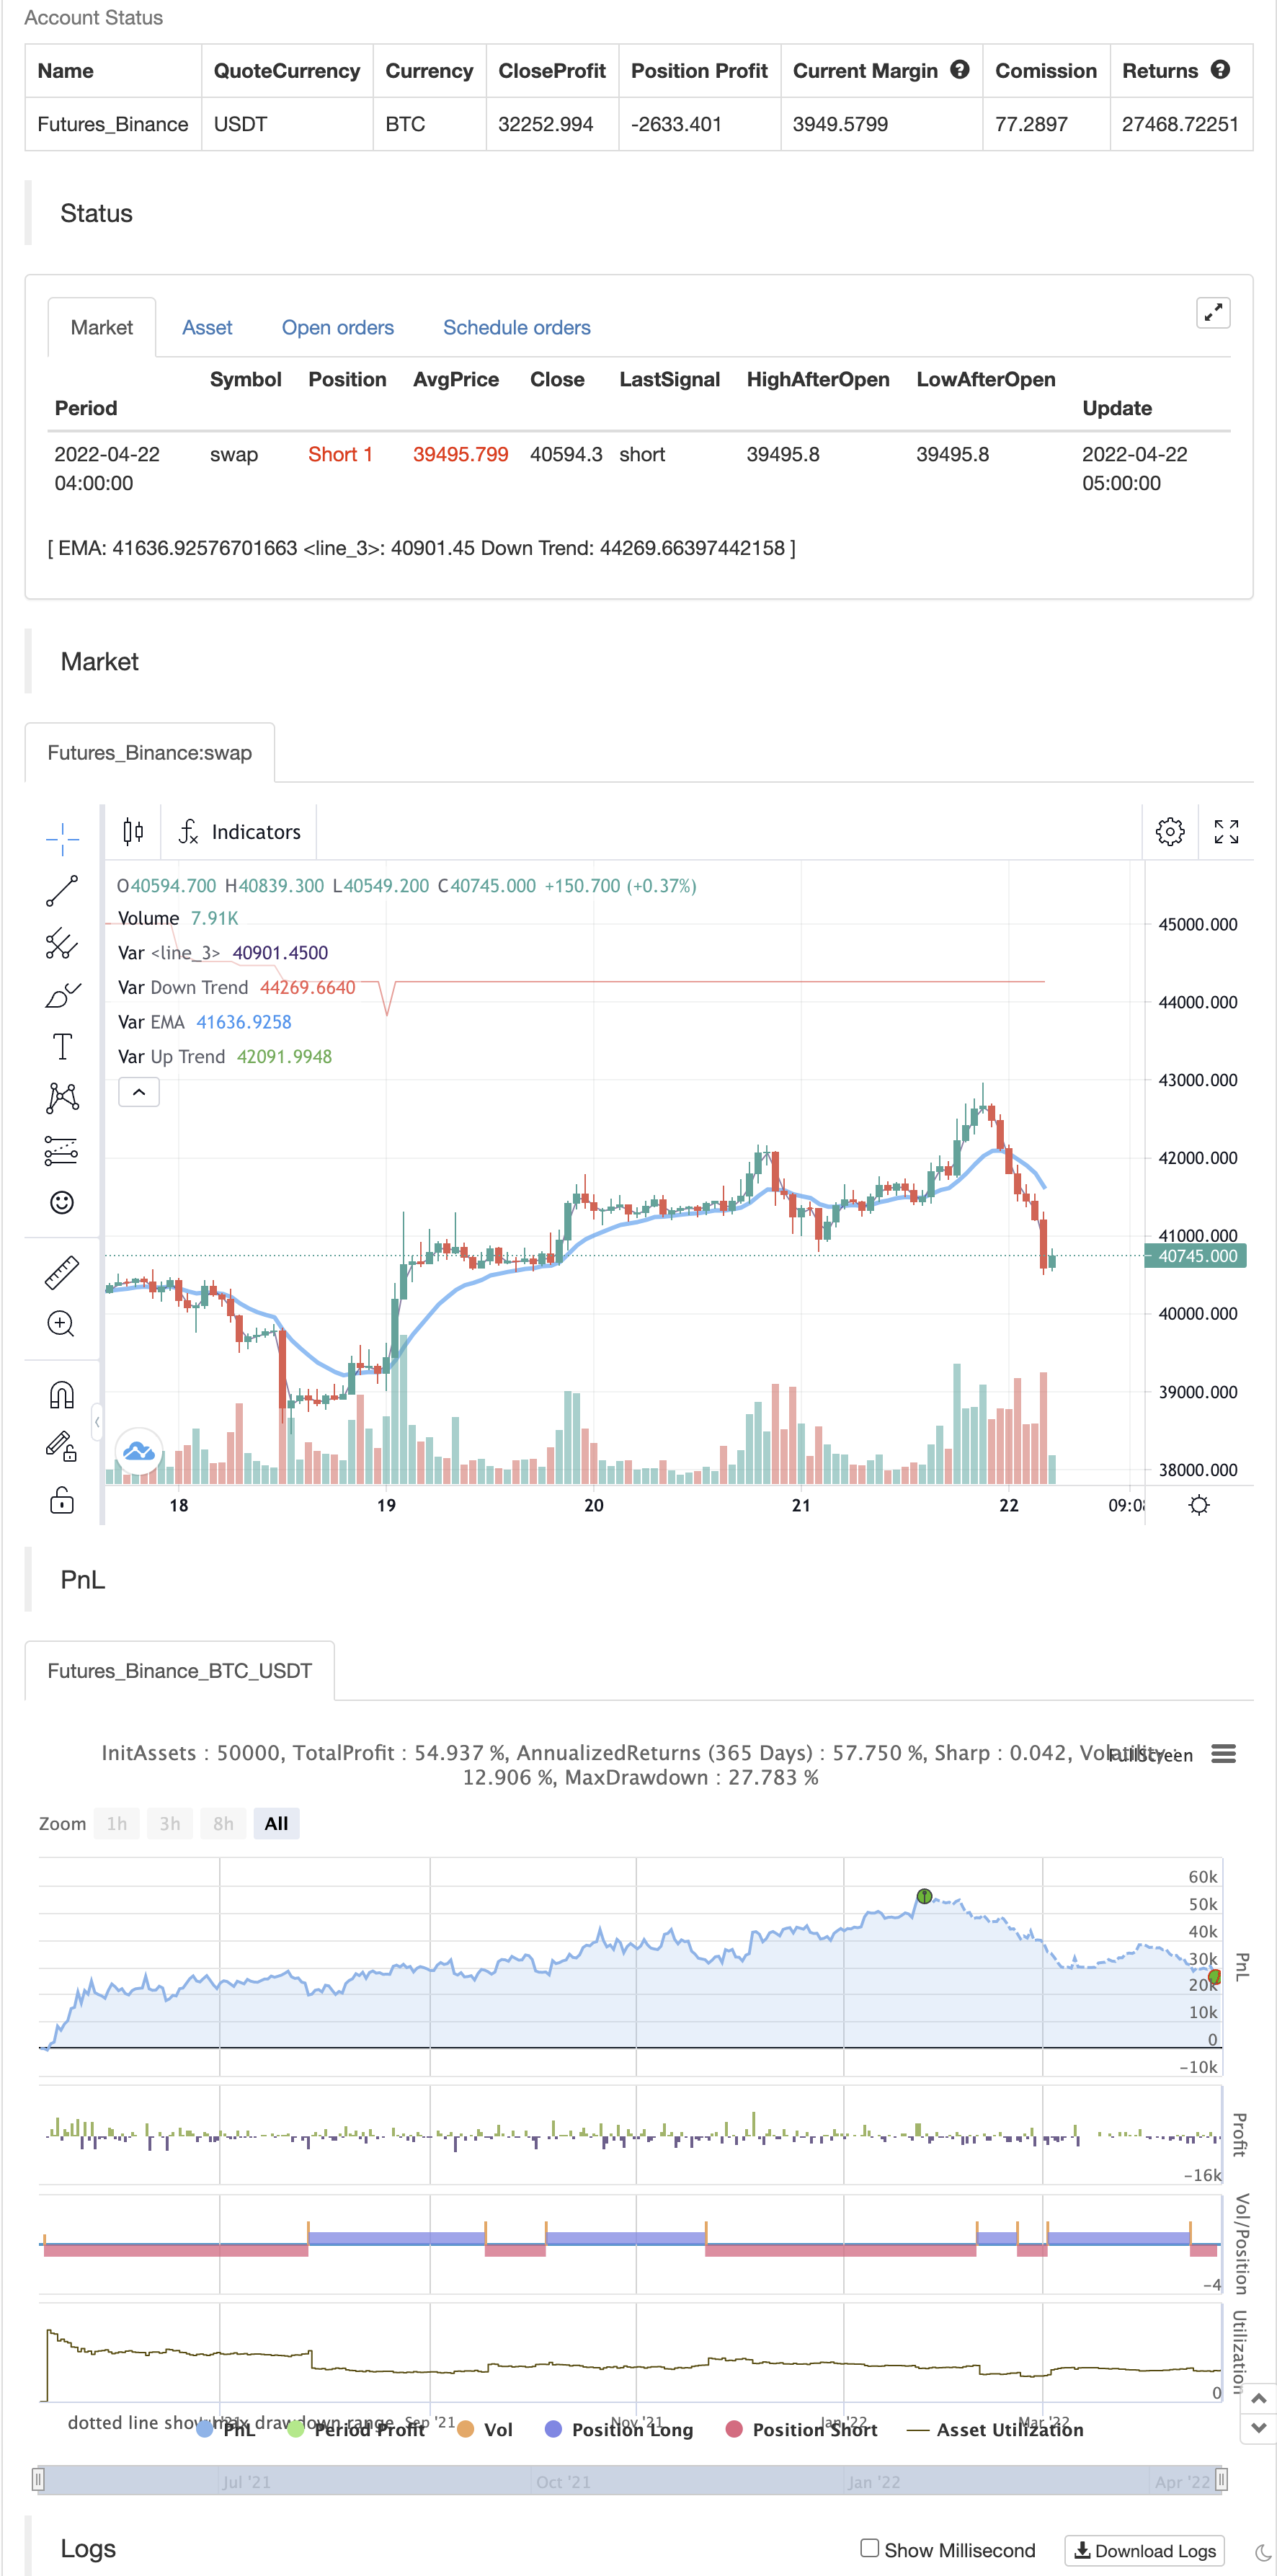
start: 2021-05-10 00:00:00
end: 2022-04-22 05:20:00
period: 1h
basePeriod: 15m
exchanges: [{"eid":"Futures_Binance","currency":"BTC_USDT"}]
*/
// This source code is subject to the terms of the Mozilla Public License 2.0 at https://mozilla.org/MPL/2.0/
// © subhajitbhattacharya
//@version=5
indicator('Moving Average Colored EMA/SMA', overlay=true, precision=2)
gr1 = "Moving Average Colored EMA/SMA"
emaplot = input(true, title='Show EMA on chart',group=gr1)
len = input.int(13, minval=1, title='Ema Length',group=gr1)
src = close
out = ta.ema(src, len)
up = out > out[1]
down = out < out[1]
mycolor = up ? color.green : down ? color.red : color.blue
plot(out and emaplot ? out : na, title='EMA', color=mycolor, linewidth=3)
smaplot = input(false, title='Show SMA on chart',group=gr1)
len2 = input.int(23, minval=1, title='Sma Length',group=gr1)
src2 = close
out2 = ta.sma(src2, len2)
up2 = out2 > out2[1]
down2 = out2 < out2[1]
mycolor2 = up2 ? color.green : down2 ? color.red : color.blue
plot(out2 and smaplot ? out2 : na, title='SMA', color=mycolor2, linewidth=1)
//===================== Holders Sentiment ==================================================
gr2 = 'Holders Sentiment'
length = input.int(50,group=gr2)
src3 = input(close, title='Source',group=gr2)
zeroline = 0
// hzplot = plot(zeroline, color=color.new(color.black, 0))
difabs = (src3[0] - src3[length]) / src3[length] * 100
plotColour = difabs > 0 ? color.green : color.red
// changeplot = plot(difabs, color=plotColour, linewidth=2)
// fill(plot1=changeplot, plot2=hzplot, color=color.new(color.blue, 90))
//================ Supertrend ================================================
gr3 = "Supertrend"
tf = input.timeframe('D', "Resolution",group=gr3)
atrPeriod = input(10, "ATR Length",group=gr3)
factor = input.float(3.0, "Factor", step = 0.01,group=gr3)
[supertrend, direction] = request.security(syminfo.tickerid, tf, ta.supertrend(factor, atrPeriod), barmerge.gaps_off, barmerge.lookahead_off)
bodyMiddle = plot((open + close) / 2, display=display.none)
upTrend = plot(direction < 0 ? supertrend : na, "Up Trend", color = color.green, style=plot.style_linebr)
downTrend = plot(direction < 0? na : supertrend, "Down Trend", color = color.red, style=plot.style_linebr)
//fill(bodyMiddle, upTrend, color.new(color.green, 90), fillgaps=false)
//fill(bodyMiddle, downTrend, color.new(color.red, 90), fillgaps=false)
//=================================================================================
bs1 = ta.crossover(out,out2) ? 1 : ta.crossunder(out,out2) ? -1 : 0
bs2 = difabs > 0 ? 1 : -1
bs3 = direction < 0 ? 1 : -1
bs = 0
bs := bs1 == 1 and bs2 == 1 and bs3 == 1 ? 1 : bs1 == -1 and bs2 == -1 and bs3 == -1 ? -1 : 0
buy = bs == 1 and nz(bs[1]) !=1
sell = bs == -1 and nz(bs[1]) != -1
//bgcolor(buy ? color.new(#00ff00, 50) : na)
//if buy
// label.new(bar_index, low, yloc = yloc.belowbar, text="Buy", textcolor = #00ff00, size = size.large, style=label.style_none)
//
//bgcolor(sell ? color.new(#b92ad8, 80) : na)
//if sell
// label.new(bar_index,high, yloc = yloc.abovebar, text="Sell", textcolor = #b92ad8, size = size.large, style=label.style_none)
alertcondition(buy, title='Buy Alert', message='Buy')
alertcondition(sell, title='sell Alert', message='Sell')
if buy
strategy.entry("Enter Long", strategy.long)
else if sell
strategy.entry("Enter Short", strategy.short)
Berkaitan
- Strategi Dagangan Berdasarkan Persaingan Emas dan Kematian MACD Berturut-turut
- Strategi Perdagangan RSI Bollinger Bands yang Dipertingkatkan
- Strategi Crossover EMA Bertiga
- Strategi Leverage Crossover Purata Bergerak Eksponen
- Strategi purata bergerak berganda GM-8 & ADX
- Strategi silang EMA yang dipertingkatkan dengan RSI/MACD/ATR
- Trend Z-Score Mengikut Strategi
- Pendaftaran panjang pada EMA Bersilang dengan Strategi Pengurusan Risiko
- Strategi Perdagangan VWAP
- Strategi WaveTrend Cross LazyBear
- Strategi Perdagangan AlphaTradingBot
Lebih lanjut
- Templat Isyarat Pelancaran Bulan [Indikator]
- HALFTREND + HEMA + SMA (Strategi Isyarat Palsu)
- RSI Perbezaan dengan Pivot, BB, SMA, EMA, SMMA, WMA, VWMA
- RSI dan BBand oversold pada masa yang sama
- Menggulung Heikin Ashi lilin
- Kombo 2/20 EMA & Penapis Bandpass
- ESSMA
- 3EMA
- Blok Perintah Pivot
- NMVOB-S
- Band MAHL
- 3 Supertrend Tambah Dalam Skrip Tunggal Ini
- Indikator Swing High/Low dengan Pengesahan MACD dan EMA
- Triple EMA + MACD
- Bermain salib
- Fractal yang lebih kecil (+ Ketelusan)
- Titik kemasukan BB-RSI-ADX
- Hull-4ema
- Sudut Serangan Ikuti Indikator Garis
- KijunSen Line Dengan Salib