Aliran dua arah mengikut strategi kuantitatif

Gambaran keseluruhan
Idea teras strategi ini adalah menggabungkan strategi 123 reversal dan indikator pengayun pelangi, untuk mencapai pelacakan trend berganda, untuk meningkatkan peluang strategi. Strategi ini mengesan trend harga jangka pendek dan jangka menengah, secara dinamik menyesuaikan kedudukan, untuk mencapai keuntungan yang lebih tinggi daripada pasaran besar.
Prinsip Strategi
Strategi ini terdiri daripada dua bahagian:
-
123 Strategi pembalikan: Jika harga penutupan turun dua hari sebelumnya dan harga penutupan naik hari ini, dan pada hari ke-9 garis Slow K di bawah 50, buat lebih banyak; Jika harga penutupan naik dua hari sebelumnya dan harga penutupan turun hari ini, dan pada hari ke-9 garis Fast K di atas 50, buat kosong.
-
Penunjuk pengayun pelangi: penunjuk ini mencerminkan sejauh mana harga menyimpang dari purata bergerak, apabila penunjuk lebih tinggi daripada 80, menunjukkan bahawa pasaran cenderung tidak stabil; apabila penunjuk lebih rendah daripada 20, menunjukkan bahawa pasaran cenderung berbalik.
Strategi ini menggabungkan kedua-duanya, dan pada masa yang sama, anda boleh membuka kedudukan apabila isyarat shorting muncul, atau meletakkan posisi kosong.
Analisis kelebihan
Strategi ini mempunyai kelebihan berikut:
- Penapisan berganda, meningkatkan kualiti isyarat, mengurangkan kadar kesalahan penghakiman.
- Peningkatan kedudukan secara dinamik untuk mengurangkan kerugian dalam perdagangan satu arah.
- Mengintegrasikan petunjuk jangka pendek dan jangka menengah untuk meningkatkan kestabilan strategi.
Analisis risiko
Strategi ini juga mempunyai risiko:
- Parameter yang tidak dioptimumkan dengan betul boleh menyebabkan overfit.
- Ia akan meningkatkan kos urus niaga.
- Stop loss mudah ditembusi apabila harga saham bergelombang.
Risiko ini dapat dikurangkan dengan menyesuaikan parameter, mengoptimumkan pengurusan kedudukan, dan menetapkan stop loss yang munasabah.
Arah pengoptimuman
Strategi ini boleh dioptimumkan dengan:
- Untuk mengoptimumkan parameter, cari kombinasi parameter terbaik.
- Tambah modul pengurusan kedudukan untuk menyesuaikan kedudukan mengikut kadar turun naik dan dinamika penarikan balik.
- Tambah modul hentian, set hentian bergerak yang munasabah.
- Menambah algoritma pembelajaran mesin untuk membantu menentukan titik perubahan trend.
ringkaskan
Strategi ini mengintegrasikan 123 strategi pembalikan dan penunjuk pengayun pelangi, mewujudkan trend pemantauan ganda, dan mempunyai ruang untuk keuntungan tambahan, sambil mengekalkan kestabilan yang tinggi. Dengan pengoptimuman berterusan, diharapkan untuk meningkatkan kadar keuntungan strategi.
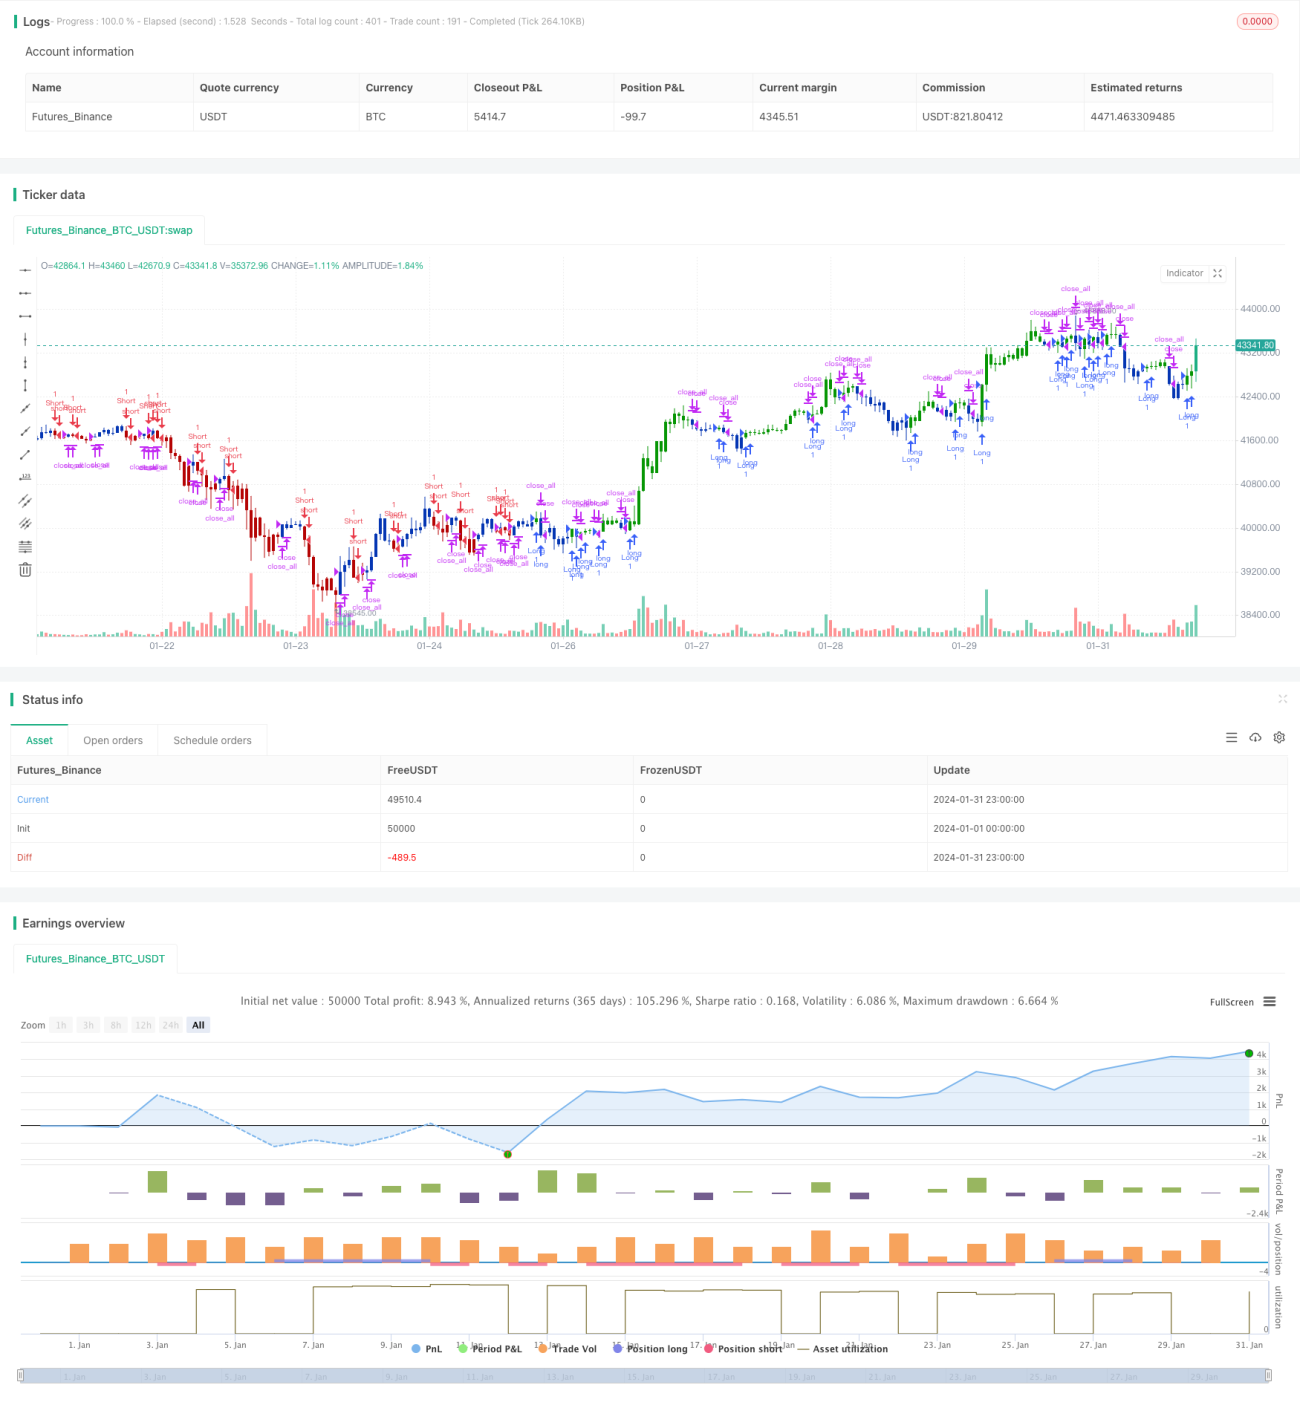
/*backtest
start: 2024-01-01 00:00:00
end: 2024-01-31 23:59:59
period: 1h
basePeriod: 15m
exchanges: [{"eid":"Futures_Binance","currency":"BTC_USDT"}]
*/

//@version=4
////////////////////////////////////////////////////////////
//  Copyright by HPotter v1.0 25/05/2021
// This is combo strategies for get a cumulative signal. - 1