TendênciaScalp-FractalBox-3EMA
Autora:ChaoZhang, Data: 23 de maio de 2022 11:45:02Tags:EMA
Há muitos indicadores com William
Pontos chave:
A fita EMA é criada usando 3 EMA
DISCLAIMER: Este indicador foi criado apenas para referência educacional e não constitui aconselhamento de investimento. Este indicador não deve ser usado como um substituto para uma extensa pesquisa de mercado independente antes de tomar suas decisões de negociação reais. Os dados de mercado ou qualquer outro conteúdo estão sujeitos a alterações a qualquer momento sem aviso prévio. A responsabilidade por qualquer perda ou dano, incluindo, sem limitação, qualquer perda de lucro, que possa surgir direta ou indiretamente do uso deste indicador é da responsabilidade do usuário que o usa.
backtest
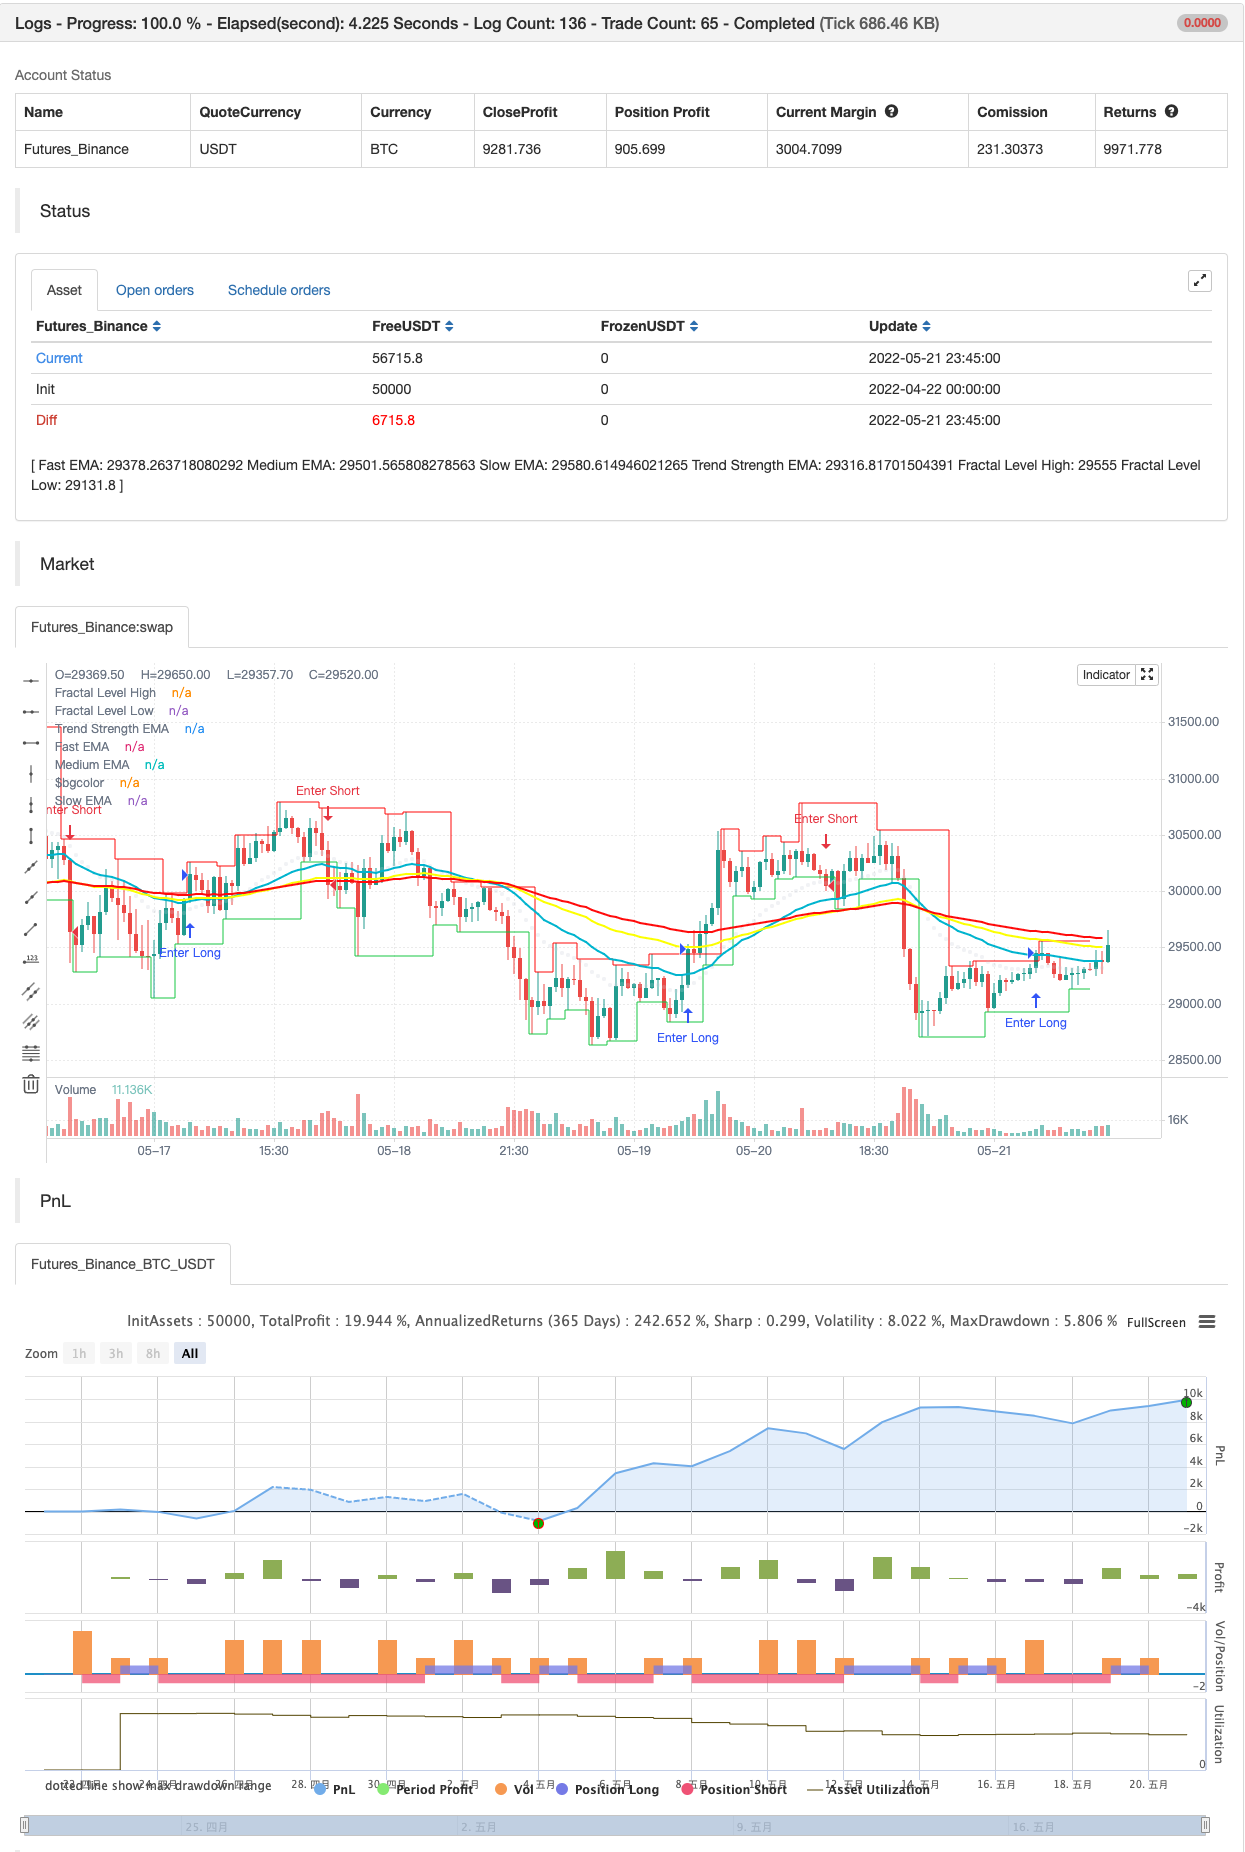
/*backtest
start: 2022-04-22 00:00:00
end: 2022-05-21 23:59:00
period: 45m
basePeriod: 5m
exchanges: [{"eid":"Futures_Binance","currency":"BTC_USDT"}]
*/

//@version=5

indicator('[VDB]TrendScalp-FractalBox-3EMA', shorttitle='[VDB]TS-FB-3EMA', overlay=true, max_lines_count=500)

// By: ©vireshdb/vdb/vdb007
//
//Description:
//          There are many indicators with William’s Fractal and Alligator. As many use EMA’s it may be useful to define an EMA ribbon and
//          combining Fractal levels/box (filling background between top and bottom fractals) for trend scalping. I searched for this kind of indicator in community – some show fractals,
//          some just levels, some with alligator etc.but couldn't find the one needed. Hence thought of this indicator which may be of interest to other users too.
//Key Points:
//          EMA ribbon is created using3 EMA’s 35/70/105. Users can change these as per their preference. This is used for trend identification –
//              1. Bullish bias if Price > EMA1 > EMA2 > EMA3. 2. Bearish bias if Price < EMA1 < EMA2 < EMA3.
//          Background is marked during crossing of EMA1 and EMA2 to alert possible change in trend.
//          5-bar fractals are used to mark the Fractal levels and backgrounds between top and bottom fractals are filled to create the Fractal Box.
//          Fractal levels are marked with offset 2 only when the fractal formation is complete and hence are lagging.
//How to Use:
//          Sloping EMA ribbon is used for identifying the trend.
//          Trend strength ema is enabled. Angle of 30degree and above is strength
//          Fractal box break-out/ break-downs are used to trigger the trade with fractal high/low for entry/stoploss.
//              - Waiting for price contraction towards EMA ribbon resulting in smaller boxes is key to initiate trade.
//              - Avoid bigger boxes as SL’s will be big and price may move within.
//              - To draw the vertical lines of FractalBox change fractal level0 style to stepline.
//          This indicator -
//              - Combined with the cycle/ banded indicators such as CCI/Stochastic/RSI etc can make it a good trend scalping setup
//              - While trading in the direction of momentum in higher timeframe.
// Reference : This indicator was achieved by combing some fractal ideas from "Fractal Framer by brobear"
//
// Copyright 2022 vireshdb
//
// This program is free software: you can redistribute it and/or modify
// it under the terms of the GNU General Public License as published by
// the Free Software Foundation, either version 3 of the License, or
// any later version.
//
// This program is distributed in the hope that it will be useful,
// but WITHOUT ANY WARRANTY; without even the implied warranty of
// MERCHANTABILITY or FITNESS FOR A PARTICULAR PURPOSE.  See the
// GNU General Public License for more details.
//
// The GNU General Public License can be found here
// <http://www.gnu.org/licenses/>.
//
// Start of code *************************************************************************************************

showema = input.bool(true, title='Show EMA Ribbon')
fastema = input.int(35, title='Fast EMA', minval=1)
medema = input.int(70, title='Medium EMA', minval=1)
slowema = input.int(105, title='Slow EMA', minval=1)
trstrema = input.int(20, title='Trend Strength EMA', minval=1)
EMA1 = ta.ema(close, fastema)
EMA2 = ta.ema(close, medema)
EMA3 = ta.ema(close, slowema)
TSEMA = ta.ema(close, trstrema)

plot(showema and fastema ? EMA1 : na, title='Fast EMA', color=color.new(#00bcd4, 0), linewidth=2)
plot(showema and medema ? EMA2 : na, title='Medium EMA', color=color.new(#fcff00, 0), linewidth=2)
plot(showema and slowema ? EMA3 : na, title='Slow EMA', color=color.new(#ff0909, 0), linewidth=2)
plot(showema and trstrema ? TSEMA : na, title='Trend Strength EMA', color=color.new(#d1d4dc, 75), linewidth=1, style=plot.style_circles)

bgcolor(color=ta.crossover(EMA1, EMA2) ? color.new(color.lime, 90) : ta.crossunder(EMA1, EMA2) ? color.new(color.red, 90) : na, title='Trend Marker')

// FRACTAL Levels and Box *******************************************************************************************
PlotFractLevel = input(defval=true, title='Show Fractal Levels and Box')
lnwidth = input.int(defval=1, title='Fractal Line Width', minval=1, maxval=3)

//----- Main ---------------------
fractLevelHigh = float(na)
fractLevelLow = float(na)
fractHigh = bool(na)
fractLow = bool(na)
lag = 0
lag := 2
fractHigh := high[4] <= high[2] and high[3] <= high[2] and high[2] > high[1] and high[2] > high ? true : false
fractLow := low[4] >= low[2] and low[3] >= low[2] and low[2] < low[1] and low[2] < low ? true : false

// Fractal levels
fractLevelHigh := fractHigh ? nz(high[lag], high) : nz(fractLevelHigh[1], high)
fractLevelLow := fractLow ? nz(low[lag], low) : nz(fractLevelLow[1], low)

//---- Plotting Fractal levels ---------------------
p1 = plot(PlotFractLevel ? fractLevelHigh : na, title='Fractal Level High', color=color.new(#ff0909, 0), linewidth=lnwidth, offset=-lag, style=plot.style_stepline)
p2 = plot(PlotFractLevel ? fractLevelLow : na, title='Fractal Level Low', color=color.new(#1bce4e, 0), linewidth=lnwidth, offset=-lag, style=plot.style_stepline)
fill(p1, p2, title='Fill Fractal Box', color=fractLevelHigh >= fractLevelLow ? color.new(#d1d4dc,90) : color.new(#fff59d, 90))

// Alert conditions
alertcondition(close > nz(fractLevelHigh, high), title='Above Fractal Level High', message='Fractal High Breakout')
alertcondition(close < nz(fractLevelLow, low), title='Below Fractal Level Low', message='Fractal Low Breakdown')

// End of FRACTAL Levels and Box ****************************************************************************************
// End of code***********************************************************************************************************

if close > nz(fractLevelHigh, high)
    strategy.entry("Enter Long", strategy.long)
else if close < nz(fractLevelLow, low)
    strategy.entry("Enter Short", strategy.short)
- Estratégia de negociação baseada em cruzes de ouro e morte MACD consecutivas
- Estratégia de negociação RSI de bandas de Bollinger aprimoradas
- Estratégia de cruzamento triplo da EMA
- Estratégia de alavancagem cruzada de média móvel exponencial
- Estratégia de média móvel dupla GM-8 e ADX
- Estratégia reforçada de cruzamento da EMA com o RSI/MACD/ATR
- Tendência do Z-Score Seguindo a Estratégia
- Introdução longa na EMA cruzada com a estratégia de gestão de riscos
- Estratégia de negociação do VWAP
- WaveTrend Cross LazyBear Estratégia
- Estratégia de negociação do AlphaTradingBot
- Estratégia de recarga do MACD
- Média móvel supertrendada
- Comércio ABC
- 15 MIN BTCUSDTPERP BOT
- Entropia de Shannon V2
- Supertrend ATR COM TRAILING STOP LOSS
- Fluxo de volume v3
- Scalping horário de futuros de criptomoedas com ma & rsi - ogcheckers
- ATR suavizado
- Buscador de blocos de ordem
- Sinais QQE
- Filtragem de amplitude de grelha de bits U
- Indicador MACD personalizado CM - Quadro de tempo múltiplo - V2
- LÍNIA HODL
- 2 Detecção da direção da média móvel de cores
- Instrumento de recuperação de scalping R1
- A estratégia de compra e venda depende de AO+Stoch+RSI+ATR
- EMA TREND CLOUD
- RedK Relação volume-aceleração da energia direcional
- Donchian Breakout sem pintura