Estratégia de reversão múltipla com base na média da tendência

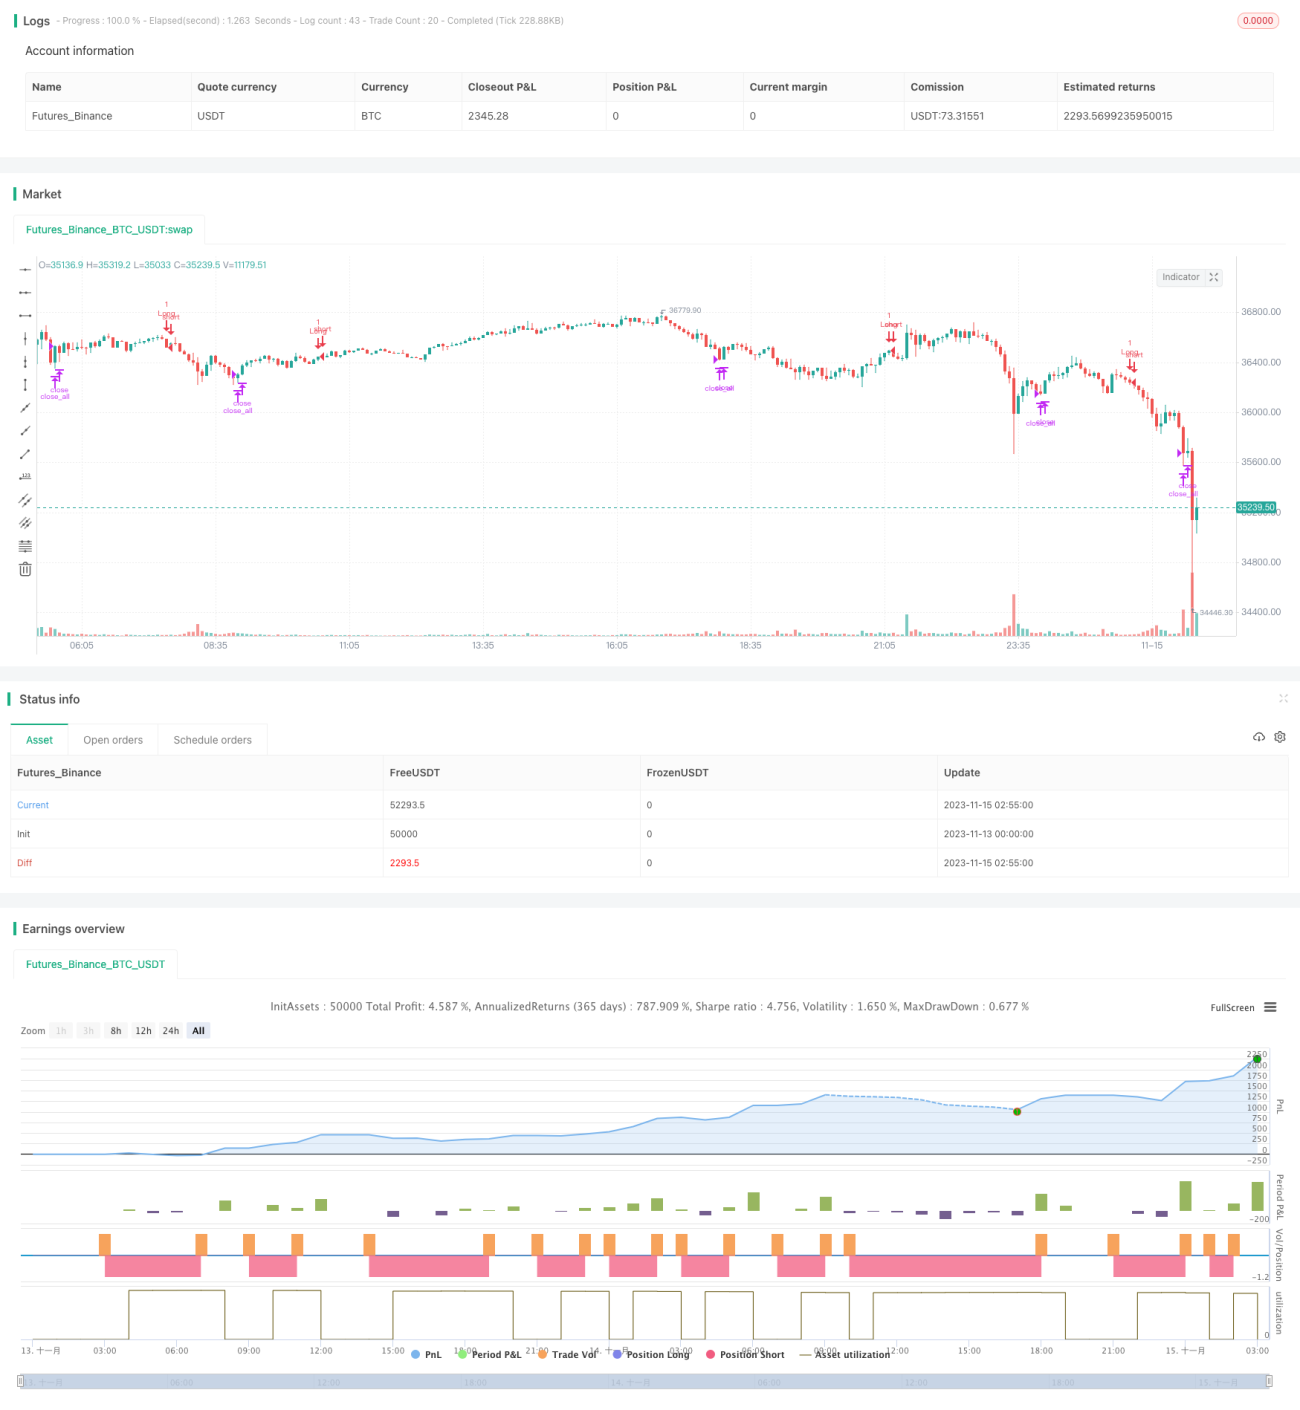
Visão geral
A estratégia calcula vários indicadores de tendência e executa operações de compra e venda quando ocorrem reversões. Os principais indicadores de tendência são TDI, TCF, TTF e TII. A estratégia escolhe em sua configuração qual indicador usar para gerar um sinal de negociação.
Princípio da estratégia
-
Indicadores de TDI
O indicador TDI é baseado na mudança de momentum do preço. É construído através de técnicas de soma e suavização. Quando o indicador de direção TDI cruza a curva TDI, faz mais e limpa a posição.
-
Indicador TCF
O indicador TCF calcula as variações positivas e negativas do preço para avaliar a força de uma posição a mais e a menos. Se a força da variação positiva for maior do que a força da variação negativa, então a posição é liquidada.
-
Índice TTF
O indicador TTF julga a tendência através da comparação da força dos pontos altos e baixos. O sinal de fazer mais é o indicador TTF passar de 100, ao contrário, o liquidar.
-
Indicadores TII
O indicador TII combina a linha média e o intervalo de preços para determinar a reversão de tendência. Ele considera simultaneamente as tendências de curto e longo prazo. Fazer mais sinais é o indicador TII com uma passagem de 80, e limpar a posição é uma passagem de 80 .
Entrando na lógica de fazer várias posições de paz, escolha o sinal de negociação apropriado de acordo com os indicadores da configuração.
Vantagens estratégicas
A estratégia combina vários indicadores de negociação de tendências comumente usados, permitindo a flexibilidade de adaptação ao ambiente de mercado. As vantagens específicas são:
- A utilização de sinais de reversão de tendência permite capturar oportunidades de mudança de tendência em tempo hábil
- Configuração de diferentes indicadores para otimização específica
- Uma rica combinação de indicadores que podem ser usados em combinação para confirmar sinais
Risco estratégico
A estratégia tem como principais riscos:
- Os sinais de negociação gerados pelos indicadores de tendência podem ser mal informados e causar prejuízos
- Indicadores individuais não são capazes de determinar a tendência e são vulneráveis ao ruído do mercado
- Parâmetros de indicadores e parâmetros de negociação mal configurados podem distorcer o mercado e gerar negociações erradas
As seguintes medidas podem ser tomadas para reduzir o risco:
- Optimizar os parâmetros do indicador para encontrar a melhor combinação de parâmetros
- Combinação de vários sinais de indicadores para a negociação, melhorar a qualidade do sinal
- Ajustar estratégias de gestão de posições para controlar perdas individuais
Direção de otimização da estratégia
A estratégia pode ser melhorada em vários aspectos:
- Testar combinações ótimas de indicadores e parâmetros em diferentes ciclos de mercado
- Adicionar ou remover indicadores para encontrar o melhor conjunto de indicadores
- Filtração de sinais de transação para eliminar sinais de falsidade
- Optimizar estratégias de gestão de posições, como posições variáveis, rastreamento de stop loss, etc.
- Aumentar os indicadores de pontuação de aprendizagem de máquina para auxiliar na avaliação da qualidade do sinal
Resumir
A estratégia combina os benefícios de vários indicadores de reversão de tendência, sendo otimizada por meio da configuração de indicadores e parâmetros, que podem ser adaptados a diferentes condições de mercado, operando em pontos de reversão de tendência. A chave é encontrar a combinação ideal de parâmetros e indicadores, controlando o risco.
- 1