Estratégia de negociação quantitativa baseada na decomposição do modo empírico
Data de criação:
2023-12-22 14:41:34
última modificação:
2023-12-22 14:41:34
cópia:
0
Cliques:
1021
1
focar em
1750
Seguidores
Visão geral
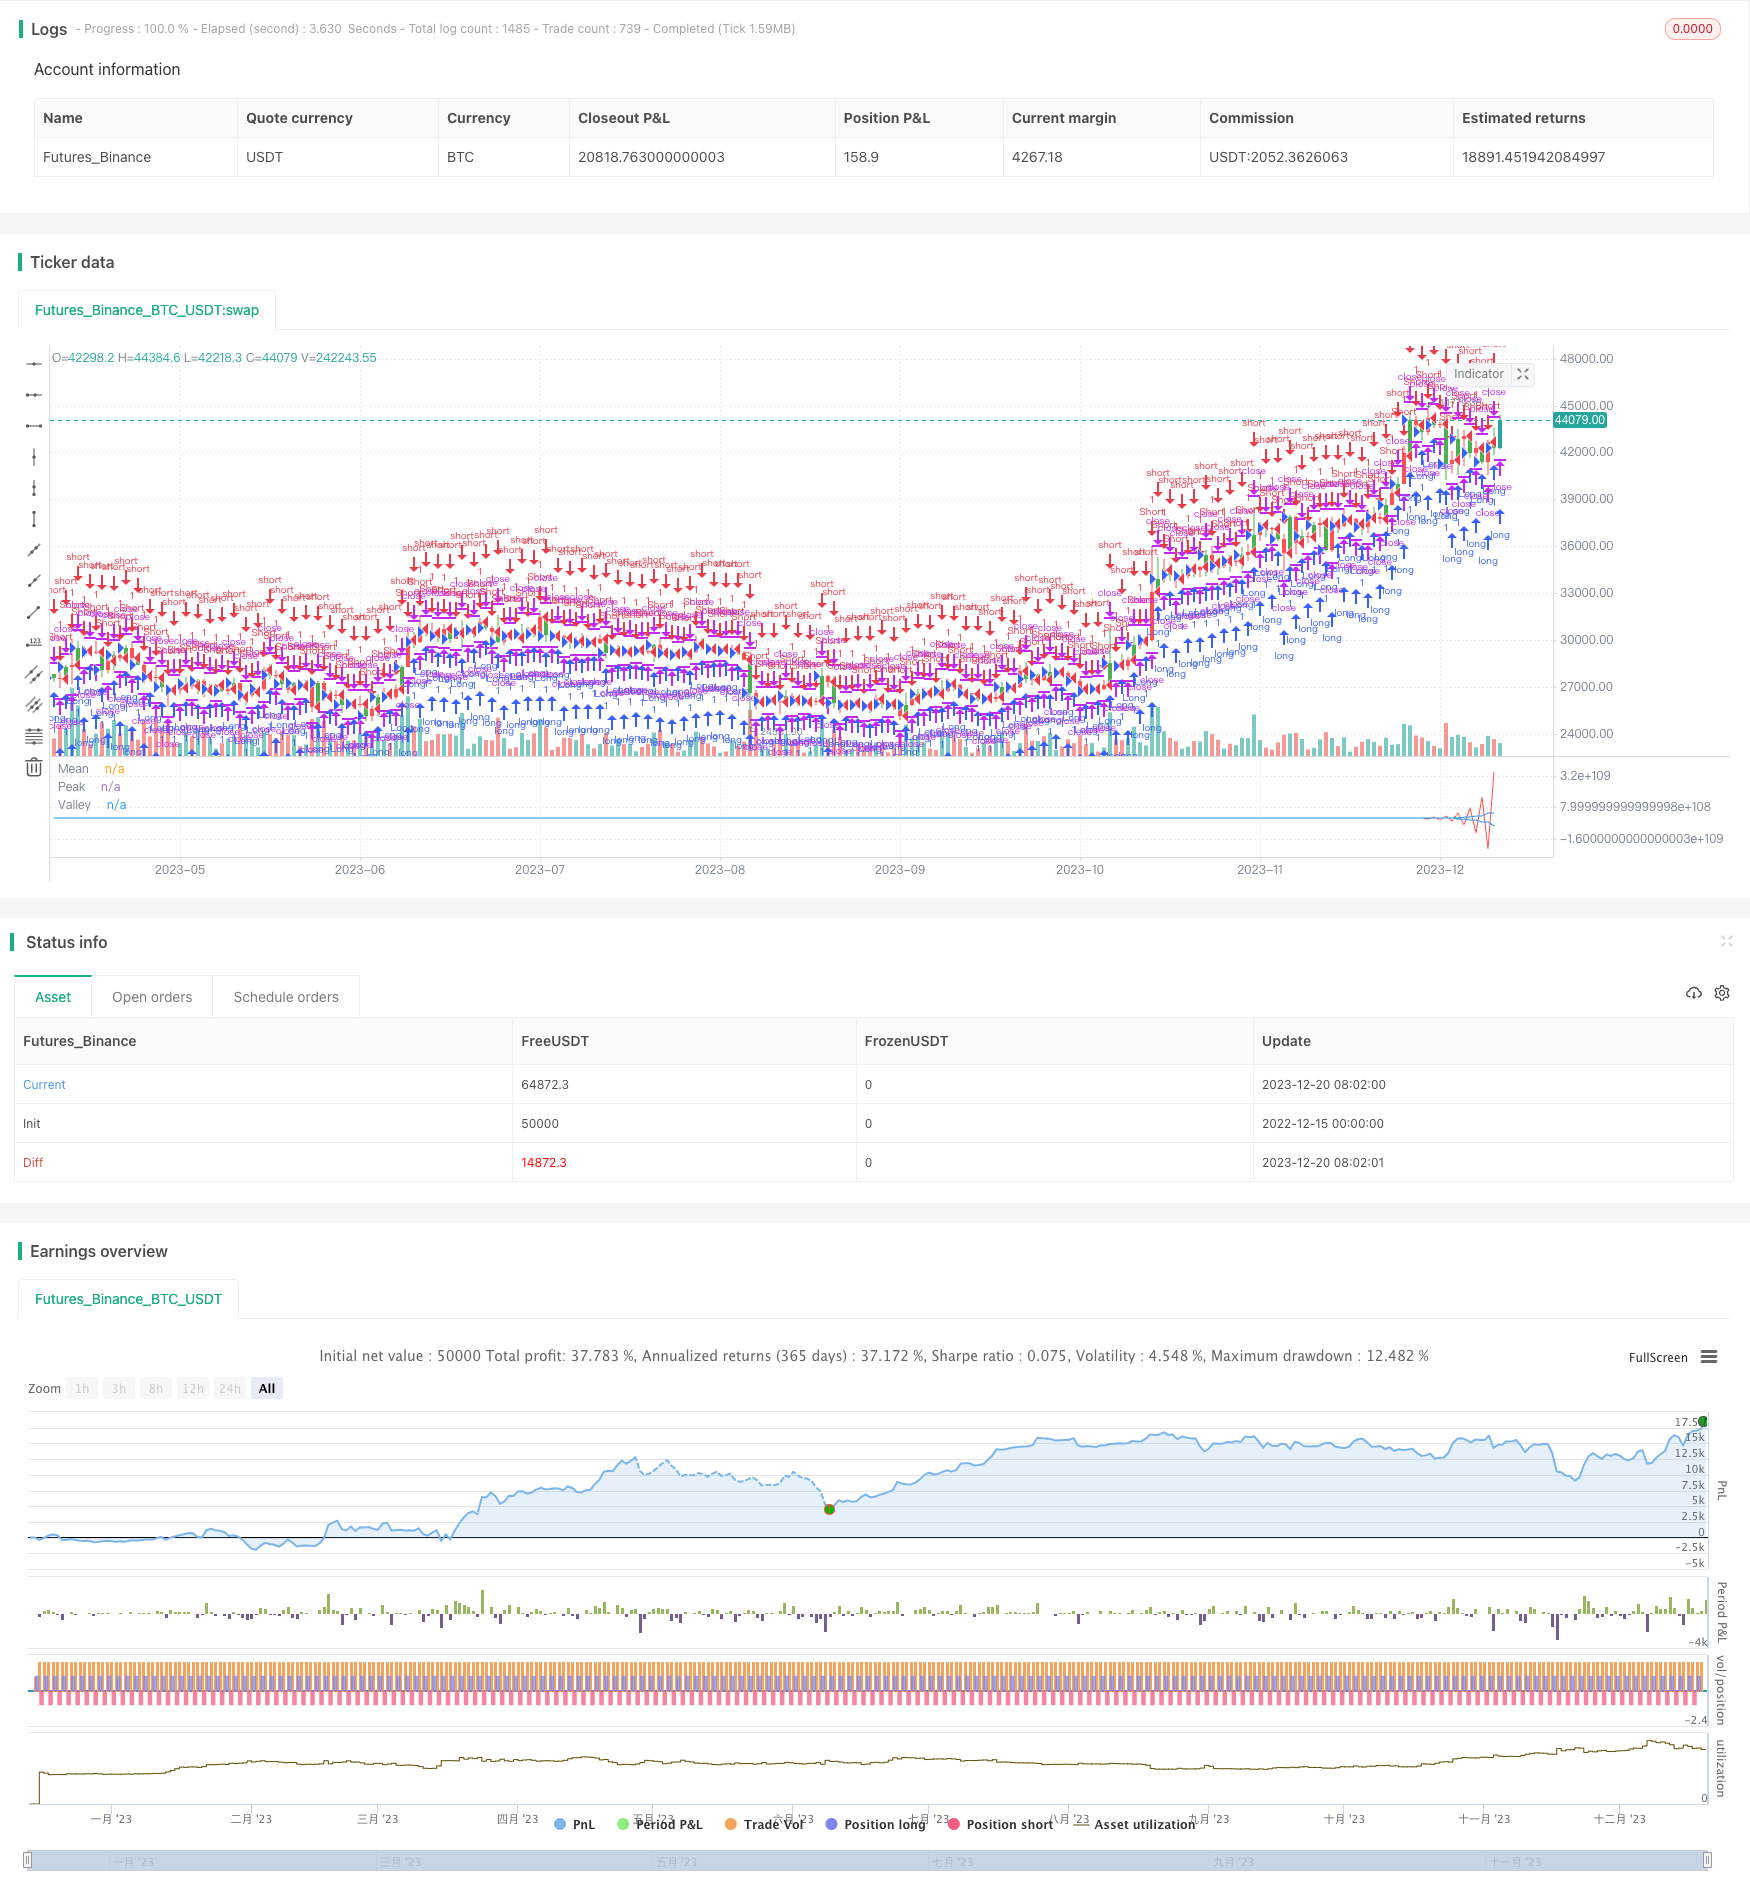
Esta estratégia baseia-se na descomposição em modo empírico (EMD), que decompõe a sequência de preços, extrai as características de diferentes bandas de onda e gera sinais de negociação em combinação com o valor médio. A estratégia se aplica principalmente a posições de linha média e longa.
Princípio da estratégia
- Usar o método EMD para fazer filtragem de banda larga de preços e extrair características de flutuação dos preços
- Calcule a média móvel da sequência de picos e da sequência de vales
- Geração de sinais de transação quando a linha média ultrapassa uma certa proporção da linha de pico e da linha de vale
- De acordo com os sinais de negociação, faça um multi-cabeça ou um cabeça vazia.
Análise de vantagens
- O método EMD pode ser usado para decompor a sequência de preços e extrair características úteis.
- A linha do vale do pico controla a estratégia de negociar apenas quando os preços flutuam acima de um determinado valor
- Combinado com a linha média, pode ser eficaz na eliminação de brechas falsas.
Análise de Riscos
- Seleção incorreta dos parâmetros da Método EMD pode causar sobre-conformidade
- Os sinais de transação necessitam de um ciclo mais longo para se formarem, não sendo adaptados para transações de alta frequência.
- A falta de capacidade para lidar com a forte volatilidade dos preços
Direção de otimização
- Optimizar os parâmetros do modelo EMD para melhorar a adaptabilidade ao mercado
- Combinação de outros indicadores como um sinal de parada de perda
- Tentar diferentes sequências de preços como entrada de estratégia
Resumir
Esta estratégia utiliza o método de decomposição de modelagem de experiência para extrair características de uma sequência de preços e, com base nas características extraídas, gera um sinal de negociação, permitindo uma estratégia de negociação de linha média e longa estável. A vantagem da estratégia reside na capacidade de identificar efetivamente as características periódicas dos preços e emitir instruções de negociação em grandes flutuações.
Código-fonte da estratégia
/*backtest
start: 2022-12-15 00:00:00
end: 2023-12-21 00:00:00
period: 1d
basePeriod: 1h
exchanges: [{"eid":"Futures_Binance","currency":"BTC_USDT"}]
*/

//@version=2
////////////////////////////////////////////////////////////
//  Copyright by HPotter v1.0 12/04/2017
// The related article is copyrighted material from Stocks & Commodities Mar 2010
// You can use in the xPrice any series: Open, High, Low, Close, HL2, HLC3, OHLC4 and ect...
//
// You can change long to short in the Input Settings
// Please, use it only for learning or paper trading. Do not for real trading.
////////////////////////////////////////////////////////////
strategy(title="Empirical Mode Decomposition")
Length = input(20, minval=1)
Delta = input(0.5)
Fraction = input(0.1)
reverse = input(false, title="Trade reverse")
xPrice = hl2
beta = cos(3.1415 * (360 / Length) / 180)
gamma = 1 / cos(3.1415 * (720 * Delta / Length) / 180)
alpha = gamma - sqrt(gamma * gamma - 1)
xBandpassFilter = 0.5 * (1 - alpha) * (xPrice - xPrice[2]) + beta * (1 + alpha) * nz(xBandpassFilter[1]) - alpha * nz(xBandpassFilter[2])
xMean = sma(xBandpassFilter, 2 * Length)
xPeak =  iff (xBandpassFilter[1] > xBandpassFilter and xBandpassFilter[1] > xBandpassFilter[2], xBandpassFilter[1], nz(xPeak[1]))
xValley =  iff (xBandpassFilter[1] < xBandpassFilter and xBandpassFilter[1] < xBandpassFilter[2], xBandpassFilter[1], nz(xValley[1]))
xAvrPeak = sma(xPeak, 50)
xAvrValley = sma(xValley, 50)
nAvrPeak = Fraction * xAvrPeak
nAvrValley = Fraction * xAvrValley
pos = iff(xMean > nAvrPeak and xMean > nAvrValley, 1,
	     iff(xMean < nAvrPeak and xMean < nAvrValley, -1, nz(pos[1], 0)))
possig = iff(reverse and pos == 1, -1,
          iff(reverse and pos == -1, 1, pos))
if (possig == 1)
    strategy.entry("Long", strategy.long)
if (possig == -1)
    strategy.entry("Short", strategy.short)
barcolor(possig == -1 ? red: possig == 1 ? green : blue )
plot(xMean, color=red, title="Mean")
plot(nAvrPeak, color=blue, title="Peak")
plot(nAvrValley, color=blue, title="Valley")