Estratégia de suporte e resistência dinâmica do CCI
Visão geral
Esta estratégia utiliza os pontos de convergência do indicador CCI para calcular os pontos de apoio e resistência dinâmicos, combinados com o discernimento da tendência para encontrar sinais de compra e venda. A estratégia combina as características de reversão do CCI com a capacidade de acompanhamento de tendências, com o objetivo de capturar as reviravoltas na tendência intermédia para obter lucro.
Princípio da estratégia
O indicador CCI é capaz de mostrar se o mercado é muito fraco ou muito forte, 80 e 80 são os dois limites que podem ser usados para determinar se o mercado está entrando em um estado de sobrecompra e sobrevenda. Esta estratégia usa essa característica do CCI para obter um núcleo superior e um núcleo inferior, calculando os pontos centrais de cada linha K de 50 em ambos os lados, e, em seguida, baseando-se nos pontos centrais, constrói linhas de resistência e linhas de suporte para a dinâmica da zona de desaceleração.
Quando o preço de fechamento está acima do preço de abertura e abaixo da linha de suporte superior, gera um sinal de compra; quando o preço de fechamento está abaixo do preço de abertura e acima da resistência inferior, gera um sinal de venda. Para filtrar os sinais de negociação da direção da tendência não-mainstream, a estratégia também combina o EMA e o indicador de inclinação para determinar a direção da tendência atual.
O Stop Loss e o Stop Stop são calculados com base na dinâmica dos indicadores ATR, o que torna o controle de risco da estratégia mais razoável.
Análise de vantagens
- Aproveite as características de reversão do CCI para comprar e vender perto do ponto de reversão, aumentando a probabilidade de lucro.
- Combinando o julgamento de tendências, evitar operações de contra-corrida, reduzir perdas.
- A configuração do stop loss dinâmico torna o controle de risco mais racional.
- Parâmetros personalizáveis, como o ciclo CCI, o tamanho da zona de amortecimento, etc., adaptam-se a mais condições de mercado.
Análise de Riscos
- Os indicadores CCI são suscetíveis a falsos sinais e necessitam de filtragem de tendências.
- A inversão não é necessariamente bem-sucedida, existe um risco de perda com certa probabilidade.
- A configuração inadequada dos parâmetros pode levar a negociações excessivamente frequentes ou a oportunidades perdidas.
Pode-se reduzir o risco através de métodos como a otimização dos parâmetros e a regulação da amplitude de parada. Além disso, a estratégia pode ser usada como uma ferramenta auxiliar para outros indicadores, sem ter que depender exclusivamente de seus sinais de negociação.
Direção de otimização
- Optimizar o tamanho da zona de amortização para adaptar-se a mercados com diferentes taxas de flutuação.
- Otimizar os parâmetros do ciclo ATR para obter um stop loss dinâmico mais preciso.
- Tente diferentes configurações de parâmetros CCI.
- Teste o efeito de outros tipos de indicadores de tendências.
Resumir
Esta estratégia integra a capacidade de seleção de múltiplos espaços do indicador CCI com a confirmação de filtragem do julgamento de tendências, com um certo valor real. O stop loss dinâmico também torna a estratégia de controle de risco em aplicações reais.
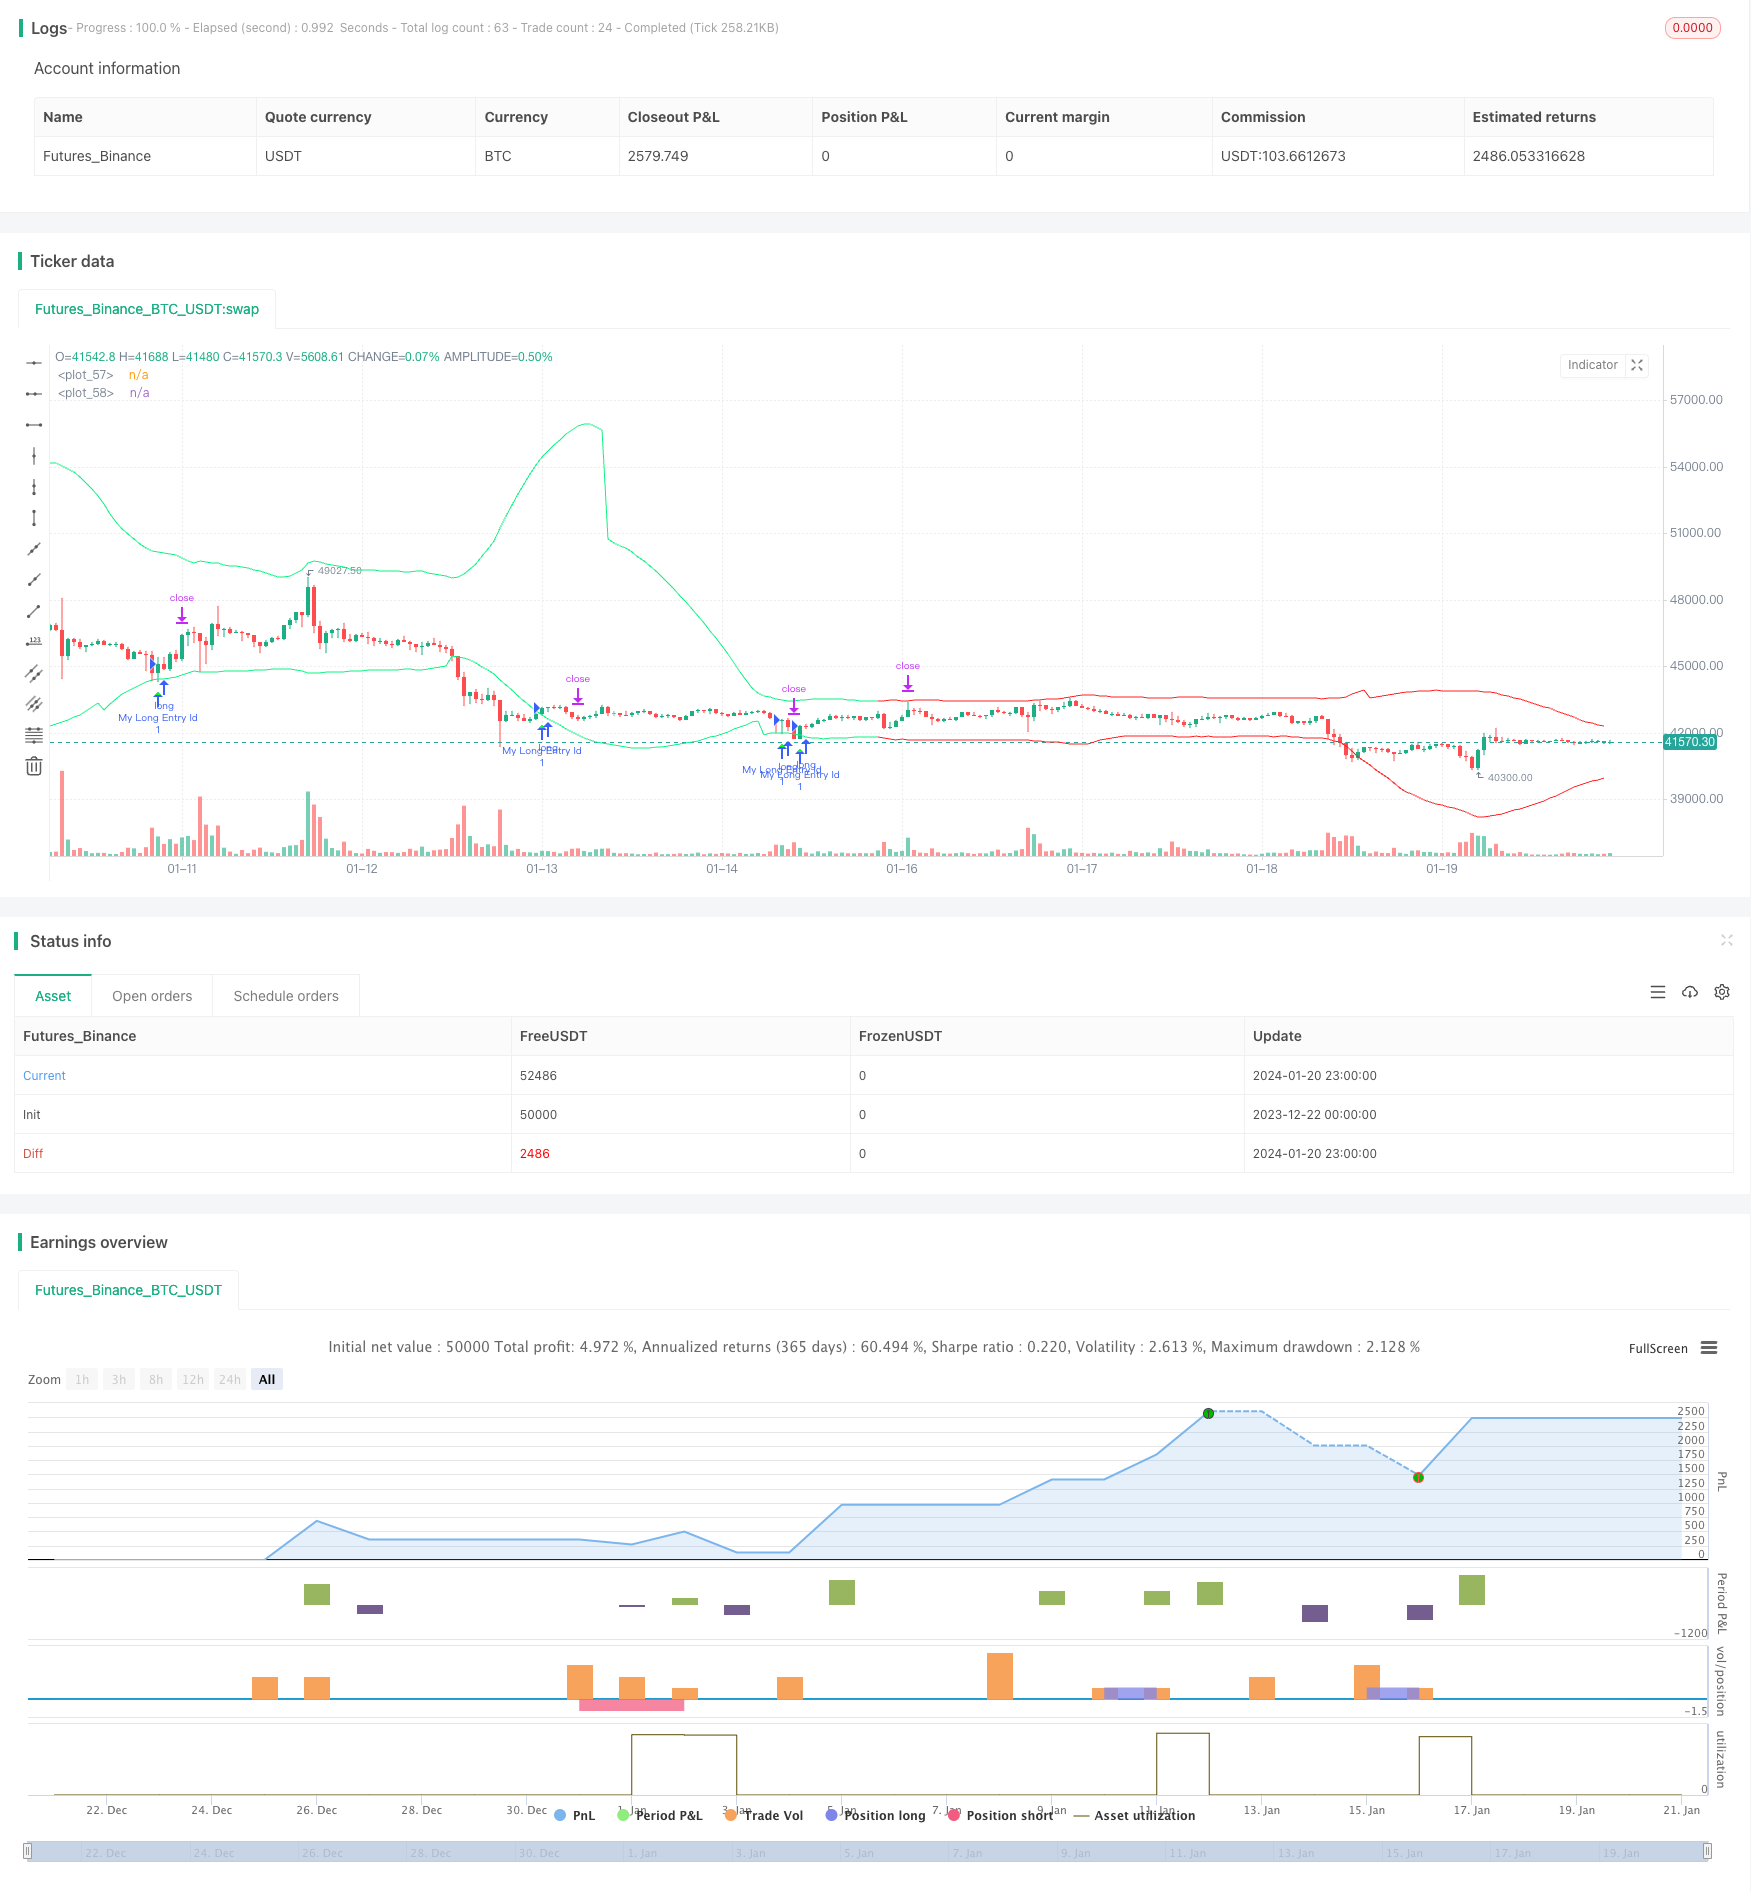
/*backtest
start: 2023-12-22 00:00:00
end: 2024-01-21 00:00:00
period: 1h
basePeriod: 15m
exchanges: [{"eid":"Futures_Binance","currency":"BTC_USDT"}]
*/

// This Pine Script™ code is subject to the terms of the Mozilla Public License 2.0 at https://mozilla.org/MPL/2.0/
// © AliSignals


//@version=5
strategy("CCI based support and resistance strategy", overlay=true  )


cci_length = input.int(50, "cci length")
right_pivot = input.int(50, "right pivot")
left_pivot = input.int(50, "left pivot")
buffer = input.float(10.0, "buffer")
trend_matter = input.bool(true, "trend matter?")
showmid = input.bool ( false , "show mid?")
trend_type = input.string("cross","trend type" ,options = ["cross","slope"])
slowma_l = input.int(100, "slow ma length")
fastma_l = input.int(50, "fast ma length")
slope_l = input.int(5,  "slope's length for trend detection")
ksl = input.float(1.1)
ktp = input.float(2.2)
restf = input.timeframe(title="Time Frame of Last Period for Calculating max" , defval="D")


// Calculating Upper and Lower CCI
cci = ta.cci(hlc3,cci_length)

uppercci = 0.0
lowercci = 0.0

uppercci := fixnan(ta.pivothigh(cci, left_pivot, right_pivot)) - buffer
lowercci := fixnan(ta.pivotlow (cci, left_pivot, right_pivot)) + buffer
midccci  = math.avg(uppercci,lowercci)


// Support and Resistance based on CCI
res = uppercci*(0.015*ta.dev(hlc3,cci_length))+ ta.sma(hlc3,cci_length)
sup = lowercci*(0.015*ta.dev(hlc3,cci_length))+ ta.sma(hlc3,cci_length)
mid =  midccci*(0.015*ta.dev(hlc3,cci_length))+ ta.sma(hlc3,cci_length)


// Calculating trend
t_cross  = 0
t_cross := ta.ema(close,fastma_l) > ta.ema(close,slowma_l) ? 1 : ta.ema(close,fastma_l) < ta.ema(close,slowma_l) ? -1 : t_cross[1]

t_slope  = 0
t_slope := ta.ema(close,slowma_l) > ta.ema(close,slowma_l)[slope_l] ? 1 : ta.ema(close,slowma_l) < ta.ema(close,slowma_l)[slope_l]  ? -1 : t_slope[1]

t  = 0
t := trend_type == "cross" ? t_cross : trend_type == "slope" ? t_slope : na

colort =  trend_matter == false ? color.rgb(201, 251, 0) : t == 1 ? color.rgb(14, 243, 132) :  t == -1 ? color.rgb(255, 34, 34) : na
bull_t = trend_matter == false or t ==  1
bear_t = trend_matter == false or t == -1

plot(res, color = colort)
plot(sup, color = colort)
plot(showmid == true ? mid : na)


// Long and Short enter condition
buy  = bull_t == 1 and ta.lowest (2) < sup and close > open and close > sup
sell = bear_t == 1 and ta.highest(2) > res and close < open and close < res

plotshape( buy , color=color.rgb(6, 255, 23) , location = location.belowbar, style = shape.triangleup  , size = size.normal)
plotshape( sell, color=color.rgb(234, 4, 4) ,  location = location.abovebar, style = shape.triangledown, size = size.normal)


atr = ta.atr(100)


CLOSE=request.security(syminfo.tickerid, restf, close)
max = 0.0
max := CLOSE == CLOSE[1] ? math.max(max[1], atr) : atr
act_atr = 0.0
act_atr := CLOSE == CLOSE[1] ? act_atr[1] : max[1]

atr1 =  math.max(act_atr, atr)

dis_sl = atr1 * ksl
dis_tp = atr1 * ktp


var float longsl  = open[1] - dis_sl
var float shortsl = open[1] + dis_sl
var float longtp =   open[1] + dis_tp
var float shorttp =  open[1] - dis_tp


longCondition = buy
if (longCondition)
    strategy.entry("My Long Entry Id", strategy.long)

shortCondition = sell
if (shortCondition)
    strategy.entry("My Short Entry Id", strategy.short)


longsl  := strategy.position_size > 0  ? longsl[1]  : close - dis_sl
shortsl := strategy.position_size < 0 ? shortsl[1] : close + dis_sl
longtp  := strategy.position_size > 0  ? longtp[1]  : close + dis_tp
shorttp := strategy.position_size < 0 ? shorttp[1] : close - dis_tp


if strategy.position_size > 0
    strategy.exit(id="My Long close Id", from_entry ="My Long Entry Id" , stop=longsl, limit=longtp)
if strategy.position_size < 0
    strategy.exit(id="My Short close Id", from_entry ="My Short Entry Id" , stop=shortsl, limit=shorttp)