Dupla tendência seguindo estratégia quantitativa


Data de criação: 2024-02-27 15:54:24 última modificação: 2024-02-27 15:54:24
cópia: 0 Cliques: 579
1
focar em
1617
Seguidores

Dupla tendência seguindo estratégia quantitativa

Visão geral

A ideia central da estratégia é combinar a estratégia de inversão 123 com o indicador do oscilador do arco-íris para realizar o rastreamento de tendências duplas, a fim de aumentar a probabilidade de sucesso da estratégia. A estratégia segue as tendências de preços de curto e médio prazo, ajusta dinamicamente as posições e obtém ganhos excedentários acima do mercado principal.

Princípio da estratégia

A estratégia consiste em duas partes:

  1. 123 estratégia de reversão: Se o preço de fechamento dos dois dias anteriores caiu e o preço de fechamento aumentou hoje, e a linha Slow K está abaixo de 50, faça mais; Se o preço de fechamento dos dois dias anteriores aumentou e o preço de fechamento caiu hoje, e a linha Fast K está acima de 50, faça a vaga.

  2. Indicador do oscilador do arco-íris: O indicador reflete o grau de desvio do preço em relação à média móvel. Quando o indicador é superior a 80, indica que o mercado tende a ser instável; Quando o indicador é inferior a 20, indica que o mercado tende a se inverter.

Esta estratégia combina os dois e, ao mesmo tempo, abre uma posição quando um sinal de curto-circuito aparece e, caso contrário, é eliminada.

Análise de vantagens

A estratégia tem as seguintes vantagens:

  1. Filtragem dupla, melhor qualidade do sinal, menor taxa de erro.
  2. A partir de agora, os investidores poderão se posicionar de forma dinâmica e reduzir os prejuízos de um mercado unidirecional.
  3. Integrar indicadores de curto e médio prazo para aumentar a estabilidade estratégica.

Análise de Riscos

A estratégia também apresenta os seguintes riscos:

  1. A otimização inadequada dos parâmetros pode ter levado a um excesso de compatibilidade.
  2. A dupla abertura de posições aumenta os custos de transação.
  3. O ponto de parada pode ser ultrapassado quando o preço da moeda flutua muito.

Estes riscos podem ser reduzidos por meio de ajustes de parâmetros, otimização de gestão de posições e de um stop loss razoavelmente ajustado.

Direção de otimização

A estratégia pode ser otimizada em:

  1. Otimizar os parâmetros para encontrar a melhor combinação.
  2. Adição de módulo de gerenciamento de posições para ajustar as posições de acordo com a volatilidade e a dinâmica de retração.
  3. Aumentar o módulo de stop loss e ajustar o stop loss móvel de forma racional.
  4. Adição de algoritmos de aprendizagem de máquina para auxiliar na determinação de pontos de inflexão de tendências.

Resumir

Esta estratégia integra 123 estratégias de reversão e indicadores de osciladores de arco-íris, permitindo o rastreamento de tendências duplas, mantendo uma alta estabilidade e com um certo espaço de lucro extra. Com a otimização contínua, espera-se aumentar ainda mais a taxa de lucro da estratégia.
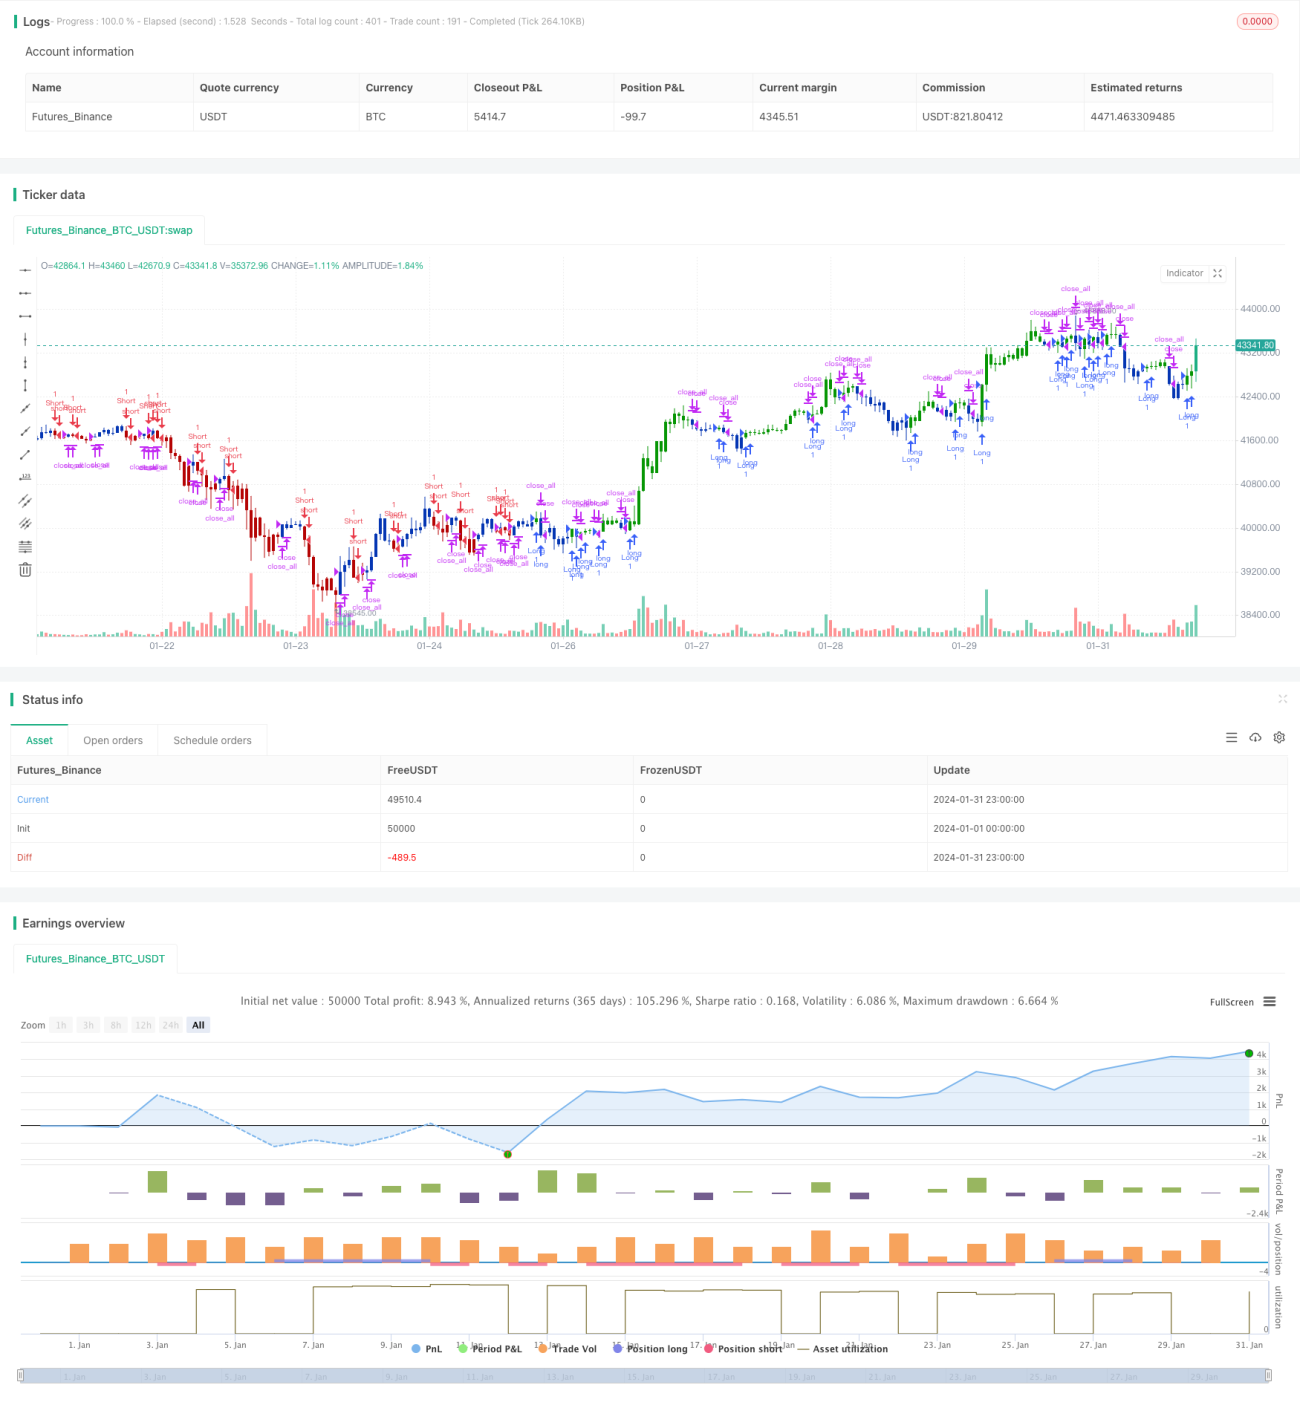
Código-fonte da estratégia
/*backtest
start: 2024-01-01 00:00:00
end: 2024-01-31 23:59:59
period: 1h
basePeriod: 15m
exchanges: [{"eid":"Futures_Binance","currency":"BTC_USDT"}]
*/

//@version=4
////////////////////////////////////////////////////////////
//  Copyright by HPotter v1.0 25/05/2021
// This is combo strategies for get a cumulative signal. 
//
// First strategy
// This System was created from the Book "How I Tripled My Money In The 
// Futures Market" by Ulf Jensen, Page 183. This is reverse type of strategies.
// The strategy buys at market, if close price is higher than the previous close 
// during 2 days and the meaning of 9-days Stochastic Slow Oscillator is lower than 50. 
// The strategy sells at market, if close price is lower than the previous close price 
// during 2 days and the meaning of 9-days Stochastic Fast Oscillator is higher than 50.
//
// Second strategy
// Ever since the people concluded that stock market price movements are not 
// random or chaotic, but follow specific trends that can be forecasted, they 
// tried to develop different tools or procedures that could help them identify 
// those trends. And one of those financial indicators is the Rainbow Oscillator 
// Indicator. The Rainbow Oscillator Indicator is relatively new, originally 
// introduced in 1997, and it is used to forecast the changes of trend direction.
// As market prices go up and down, the oscillator appears as a direction of the 
// trend, but also as the safety of the market and the depth of that trend. As 
// the rainbow grows in width, the current trend gives signs of continuity, and 
// if the value of the oscillator goes beyond 80, the market becomes more and more 
// unstable, being prone to a sudden reversal. When prices move towards the rainbow 
// and the oscillator becomes more and more flat, the market tends to remain more 
// stable and the bandwidth decreases. Still, if the oscillator value goes below 20, 
// the market is again, prone to sudden reversals. The safest bandwidth value where 
// the market is stable is between 20 and 80, in the Rainbow Oscillator indicator value. 
// The depth a certain price has on a chart and into the rainbow can be used to judge 
// the strength of the move.
//
// WARNING:
// - For purpose educate only
// - This script to change bars colors.
////////////////////////////////////////////////////////////
Reversal123(Length, KSmoothing, DLength, Level) =>
    vFast = sma(stoch(close, high, low, Length), KSmoothing) 
    vSlow = sma(vFast, DLength)
    pos = 0.0
    pos := iff(close[2] < close[1] and close > close[1] and vFast < vSlow and vFast > Level, 1,
	         iff(close[2] > close[1] and close < close[1] and vFast > vSlow and vFast < Level, -1, nz(pos[1], 0))) 
	pos


RO(Length, LengthHHLL) =>
    pos = 0.0
    xMA1 = sma(close, Length)
    xMA2 = sma(xMA1, Length)
    xMA3 = sma(xMA2, Length)
    xMA4 = sma(xMA3, Length)
    xMA5 = sma(xMA4, Length)
    xMA6 = sma(xMA5, Length)
    xMA7 = sma(xMA6, Length)
    xMA8 = sma(xMA7, Length)
    xMA9 = sma(xMA8, Length)
    xMA10 = sma(xMA9, Length)
    xHH = highest(close, LengthHHLL)
    xLL = lowest(close, LengthHHLL)
    xHHMAs = max(xMA1,max(xMA2,max(xMA3,max(xMA4,max(xMA5,max(xMA6,max(xMA7,max(xMA8,max(xMA9,xMA10)))))))))
    xLLMAs = min(xMA1,min(xMA2,min(xMA3,min(xMA4,min(xMA5,min(xMA6,min(xMA7,min(xMA8,min(xMA9,xMA10)))))))))
    xRBO = 100 * ((close - ((xMA1+xMA2+xMA3+xMA4+xMA5+xMA6+xMA7+xMA8+xMA9+xMA10) / 10)) / (xHH - xLL))
    xRB = 100 * ((xHHMAs - xLLMAs) / (xHH - xLL))
    pos:= iff(xRBO > 0, 1,
           iff(xRBO < 0, -1, nz(pos[1], 0))) 
    pos

strategy(title="Combo Backtest 123 Reversal & Rainbow Oscillator", shorttitle="Combo", overlay = true)
line1 = input(true, "---- 123 Reversal ----")
Length = input(14, minval=1)
KSmoothing = input(1, minval=1)
DLength = input(3, minval=1)
Level = input(50, minval=1)
//-------------------------
line2 = input(true, "---- Rainbow Oscillator ----")
LengthRO = input(2, minval=1)
LengthHHLL = input(10, minval=2, title="HHV/LLV Lookback")
reverse = input(false, title="Trade reverse")
posReversal123 = Reversal123(Length, KSmoothing, DLength, Level)
posRO = RO(LengthRO, LengthHHLL)
pos = iff(posReversal123 == 1 and posRO == 1 , 1,
	   iff(posReversal123 == -1 and posRO == -1, -1, 0)) 
possig = iff(reverse and pos == 1, -1,
          iff(reverse and pos == -1 , 1, pos))	   
if (possig == 1 ) 
    strategy.entry("Long", strategy.long)
if (possig == -1 )
    strategy.entry("Short", strategy.short)	 
if (possig == 0) 
    strategy.close_all()
barcolor(possig == -1 ? #b50404: possig == 1 ? #079605 : #0536b3 )