
Эта стратегия использует три открытых общедоступных индикатора: волшебный индикатор тренда, индикатор сжатого количества движений и индикатор сжатого количества движений, чтобы выявить резкие изменения на рынке. Эти три индикатора взаимно проверяются, что позволяет эффективно идентифицировать рыночные поворотные точки. Эта стратегия пытается открыть позиции, когда эти три индикатора одновременно посылают сигналы покупки / продажи, чтобы достичь низкого риска.
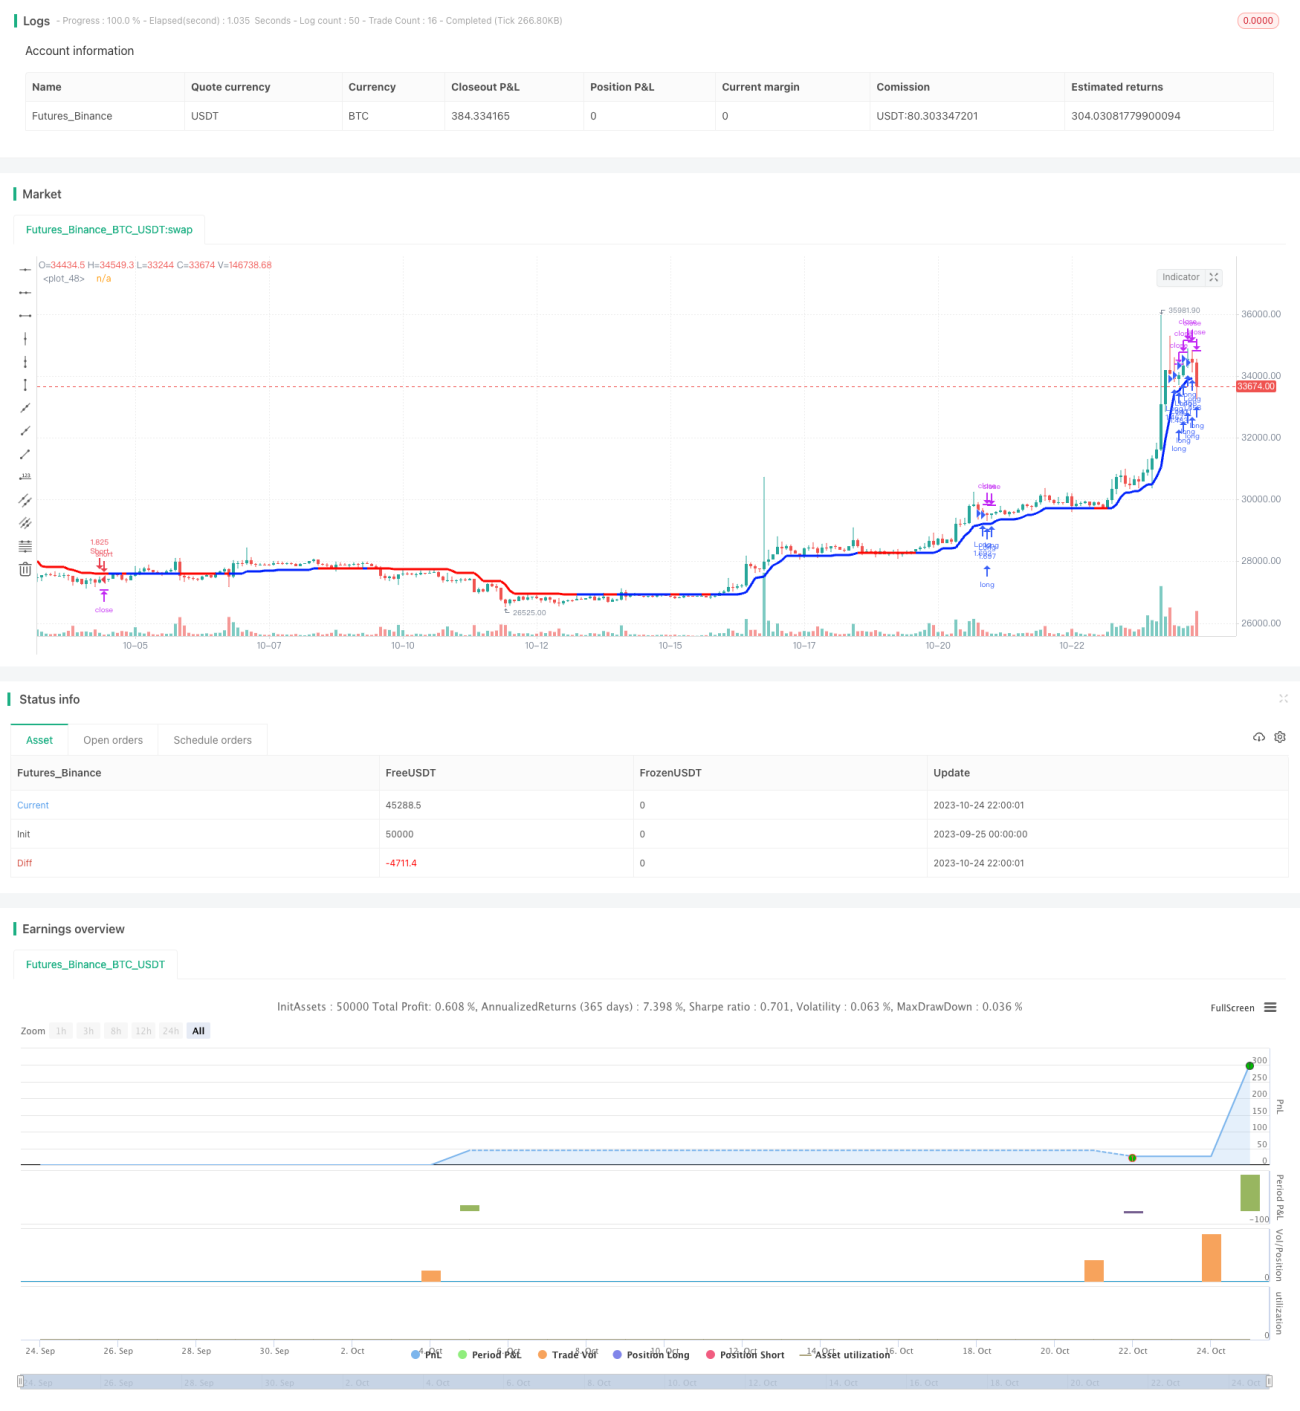
Эта стратегия использует 1-минутную или 3-минутную K-линию с установкой стоп-лоста в 1,5 раза выше ATR.
Во-первых, тренд-магический индикатор в сочетании с ATR-индикатором определяет тенденцию и волатильность рынка. CCI-индикатор больше 0 означает, что происходит волатильность, в то время как если ATR-индикатор находится выше цены, это означает тенденцию вверх, а наоборот - тенденцию вниз.
Во-вторых, динамика сжатия показывает, когда волатильность уменьшается. Когда сжатие Буринского пояса происходит в пределах Кильтового канала, это означает, что рынок становится менее волатильным. После некоторого времени сжатия Буринский пояс непременно прорвет Кильтовый канал, что приведет к резкому падению цен.
Наконец, накопленный прирост объема сделок позволяет вывести рыночную силу, рассчитывая разницу в объеме сделок между покупателями и продавцами. Количество сделок увеличивается, когда покупатель является многосторонним.
Когда три индикатора сигнализируют одновременно, подтверждая, что рынок находится вблизи обратной точки, открывается позиция для обратной операции.
Эта стратегия использует несколько индикаторов, чтобы оценить движение рынка, и открывает позиции, когда несколько индикаторов посылают согласованные сигналы. По сравнению с одним индикатором, она может отфильтровывать больше ложных сигналов. Однако, поскольку она работает только в одном временном цикле, она все еще может быть заперта в тренде. Следующий шаг может повысить эффективность путем внедрения более продвинутых технологий, таких как машинное обучение, или в сочетании с более длительными индикаторами, чтобы избежать обратной операции, что делает стратегию применимой на большем количестве рынков.
/*backtest
start: 2023-09-25 00:00:00
end: 2023-10-25 00:00:00
period: 2h
basePeriod: 15m
exchanges: [{"eid":"Futures_Binance","currency":"BTC_USDT"}]
*/
// This source code is subject to the terms of the Mozilla Public License 2.0 at https://mozilla.org/MPL/2.0/
// © myn
//@version=5
strategy('Strategy Myth-Busting #11 - TrendMagic+SqzMom+CDV - [MYN]', max_bars_back=5000, overlay=true, pyramiding=0, initial_capital=1000, currency='USD', default_qty_type=strategy.percent_of_equity, default_qty_value=1, commission_value=0.075, use_bar_magnifier = false)
// HA to Regular Candlestick resolover
useHA = input.bool(true, "Use Heiken Ashi")
CLOSE = close
OPEN = open
HIGH = high
LOW = low
CLOSE := useHA ? (OPEN + CLOSE + HIGH + LOW) / 4 : CLOSE
OPEN := useHA ? na(OPEN[1]) ? (OPEN + CLOSE) / 2: (OPEN[1] + CLOSE[1]) / 2 : OPEN
HIGH := useHA ? math.max(HIGH, math.max(OPEN, CLOSE)) : HIGH
LOW := useHA ? math.min(LOW, math.min(OPEN, CLOSE)) : LOW
isCrypto = input.bool(true, "Is Crypto?")
// Functions
f_priorBarsSatisfied(_objectToEval, _numOfBarsToLookBack) =>
returnVal = false
for i = 0 to _numOfBarsToLookBack
if (_objectToEval[i] == true)
returnVal = true
/////////////////////////////////////
//* Put your strategy logic below *//
/////////////////////////////////////
// Trend Magic by KivancOzbilgic
//░░░░░░░░░░░░░░░░░░░░░░░░░░░░░░░░░░░░░░░░░░░░░░░░░░░░░░░░░░░░░░░░░░░░░░░░░░░░░░░░░░░░░░░░░░░░░░░░░░░░░░░░░░░░░░░░░░░░░░░░░░░░░░░░░░░░░░░░░░░░░░░░░░
period = input(20, 'CCI period')
coeff = input(2, 'ATR Multiplier')
AP = input(5, 'ATR Period')
ATR = ta.sma(ta.tr, AP)
src = CLOSE
upT = LOW - ATR * coeff
downT = HIGH + ATR * coeff
MagicTrend = 0.0
MagicTrend := ta.cci(src, period) >= 0 ? upT < nz(MagicTrend[1]) ? nz(MagicTrend[1]) : upT : downT > nz(MagicTrend[1]) ? nz(MagicTrend[1]) : downT
color1 = ta.cci(src, period) >= 0 ? #0022FC : #FC0400
plot(MagicTrend, color=color1, linewidth=3)
alertcondition(ta.cross(CLOSE, MagicTrend), title='Cross Alert', message='Price - MagicTrend Crossing!')
alertcondition(ta.crossover(LOW, MagicTrend), title='CrossOver Alarm', message='BUY SIGNAL!')
alertcondition(ta.crossunder(HIGH, MagicTrend), title='CrossUnder Alarm', message='SELL SIGNAL!')
i_numLookbackBarsTM = input(17,title="Number of bars to look back to validate Trend Magic trend")
//trendMagicEntryLong = trendMagicEntryConditionLong and f_priorBarsSatisfied(trendMagicEntryConditionLong,i_numLookbackBarsTM)
//trendMagicEntryShort = trendMagicEntryConditionShort and f_priorBarsSatisfied(trendMagicEntryConditionShort,i_numLookbackBarsTM)
trendMagicEntryConditionLong = ta.cci(src, period) >= 0 and src > MagicTrend + (isCrypto ? 5 : 0 )
trendMagicEntryConditionShort = ta.cci(src, period) < 0 and src < MagicTrend - (isCrypto ? 5 : 0)
trendMagicEntryLong = trendMagicEntryConditionLong and ta.barssince(trendMagicEntryConditionShort) > i_numLookbackBarsTM
trendMagicEntryShort = trendMagicEntryConditionShort and ta.barssince(trendMagicEntryConditionLong) > i_numLookbackBarsTM
// Squeeze Momentum by LazyBear
//░░░░░░░░░░░░░░░░░░░░░░░░░░░░░░░░░░░░░░░░░░░░░░░░░░░░░░░░░░░░░░░░░░░░░░░░░░░░░░░░░░░░░░░░░░░░░░░░░░░░░░░░░░░░░░░░░░░░░░░░░░░░░░░░░░░░░░░░░░░░░░░░░░
length = input(10, title='BB Length', group="Squeeze Momentum")
mult = input(2.0, title='BB MultFactor')
lengthKC = input(10, title='KC Length')
multKC = input(1.5, title='KC MultFactor')
useTrueRange = input(true, title='Use TrueRange (KC)')
// Calculate BB
source = CLOSE
basis = ta.sma(source, length)
dev = multKC * ta.stdev(source, length)
upperBB = basis + dev
lowerBB = basis - dev
// Calculate KC
ma = ta.sma(source, lengthKC)
range_1 = useTrueRange ? ta.tr : HIGH - LOW
rangema = ta.sma(range_1, lengthKC)
upperKC = ma + rangema * multKC
lowerKC = ma - rangema * multKC
sqzOn = lowerBB > lowerKC and upperBB < upperKC
sqzOff = lowerBB < lowerKC and upperBB > upperKC
noSqz = sqzOn == false and sqzOff == false
val = ta.linreg(source - math.avg(math.avg(ta.highest(HIGH, lengthKC), ta.lowest(LOW, lengthKC)), ta.sma(CLOSE, lengthKC)), lengthKC, 0)
iff_1 = val > nz(val[1]) ? color.lime : color.green
iff_2 = val < nz(val[1]) ? color.red : color.maroon
bcolor = val > 0 ? iff_1 : iff_2
scolor = noSqz ? color.blue : sqzOn ? color.black : color.gray
//plot(val, color=bcolor, style=plot.style_histogram, linewidth=4)
//plot(0, color=scolor, style=plot.style_cross, linewidth=2)
i_numLookbackBarsSM = input(14,title="Number of bars to look back to validate Sqz Mom trend")
//sqzmomEntryLong = val > 0 and f_priorBarsSatisfied(val > 0,i_numLookbackBarsSM)
//sqzmomEntryShort = val < 0 and f_priorBarsSatisfied(val < 0,i_numLookbackBarsSM)
sqzmomEntryConditionLong = val > 0
sqzmomEntryConditionShort = val < 0
sqzmomEntryLong = sqzmomEntryConditionLong and ta.barssince(sqzmomEntryConditionShort) > i_numLookbackBarsSM
sqzmomEntryShort = sqzmomEntryConditionShort and ta.barssince(sqzmomEntryConditionLong) > i_numLookbackBarsSM
// Cumulative Delta Volume by LonesomeTheBlue
//░░░░░░░░░░░░░░░░░░░░░░░░░░░░░░░░░░░░░░░░░░░░░░░░░░░░░░░░░░░░░░░░░░░░░░░░░░░░░░░░░░░░░░░░░░░░░░░░░░░░░░░░░░░░░░░░░░░░░░░░░░░░░░░░░░░░░░░░░░░░░░░░░░
linestyle = input.string(defval='Candle', title='Style', options=['Candle', 'Line'], group="Cumlative Delta Volume")
hacandle = input(defval=true, title='Heikin Ashi Candles?')
showma1 = input.bool(defval=false, title='SMA 1', inline='ma1')
ma1len = input.int(defval=50, title='', minval=1, inline='ma1')
ma1col = input.color(defval=color.lime, title='', inline='ma1')
showma2 = input.bool(defval=false, title='SMA 2', inline='ma2')
ma2len = input.int(defval=200, title='', minval=1, inline='ma2')
ma2col = input.color(defval=color.red, title='', inline='ma2')
showema1 = input.bool(defval=false, title='EMA 1', inline='ema1')
ema1len = input.int(defval=50, title='', minval=1, inline='ema1')
ema1col = input.color(defval=color.lime, title='', inline='ema1')
showema2 = input.bool(defval=false, title='EMA 2', inline='ema2')
ema2len = input.int(defval=200, title='', minval=1, inline='ema2')
ema2col = input.color(defval=color.red, title='', inline='ema2')
colorup = input.color(defval=color.lime, title='Body', inline='bcol')
colordown = input.color(defval=color.red, title='', inline='bcol')
bcolup = input.color(defval=#74e05e, title='Border', inline='bocol')
bcoldown = input.color(defval=#ffad7d, title='', inline='bocol')
wcolup = input.color(defval=#b5b5b8, title='Wicks', inline='wcol')
wcoldown = input.color(defval=#b5b5b8, title='', inline='wcol')
tw = HIGH - math.max(OPEN, CLOSE)
bw = math.min(OPEN, CLOSE) - LOW
body = math.abs(CLOSE - OPEN)
_rate(cond) =>
ret = 0.5 * (tw + bw + (cond ? 2 * body : 0)) / (tw + bw + body)
ret := nz(ret) == 0 ? 0.5 : ret
ret
deltaup = volume * _rate(OPEN <= CLOSE)
deltadown = volume * _rate(OPEN > CLOSE)
delta = CLOSE >= OPEN ? deltaup : -deltadown
cumdelta = ta.cum(delta)
float ctl = na
float o = na
float h = na
float l = na
float c = na
if linestyle == 'Candle'
o := cumdelta[1]
h := math.max(cumdelta, cumdelta[1])
l := math.min(cumdelta, cumdelta[1])
c := cumdelta
ctl
else
ctl := cumdelta
ctl
plot(ctl, title='CDV Line', color=color.new(color.blue, 0), linewidth=2)
float haclose = na
float haopen = na
float hahigh = na
float halow = na
haclose := (o + h + l + c) / 4
haopen := na(haopen[1]) ? (o + c) / 2 : (haopen[1] + haclose[1]) / 2
hahigh := math.max(h, math.max(haopen, haclose))
halow := math.min(l, math.min(haopen, haclose))
c_ = hacandle ? haclose : c
o_ = hacandle ? haopen : o
h_ = hacandle ? hahigh : h
l_ = hacandle ? halow : l
//plotcandle(o_, h_, l_, c_, title='CDV Candles', color=o_ <= c_ ? colorup : colordown, bordercolor=o_ <= c_ ? bcolup : bcoldown, wickcolor=o_ <= c_ ? bcolup : bcoldown)
//plot(showma1 and linestyle == 'Candle' ? ta.sma(c_, ma1len) : na, title='SMA 1', color=ma1col)
//plot(showma2 and linestyle == 'Candle' ? ta.sma(c_, ma2len) : na, title='SMA 2', color=ma2col)
//plot(showema1 and linestyle == 'Candle' ? ta.ema(c_, ema1len) : na, title='EMA 1', color=ema1col)
//plot(showema2 and linestyle == 'Candle' ? ta.ema(c_, ema2len) : na, title='EMA 2', color=ema2col)
i_numLookbackBarsCDV = input(14,title="Number of bars to look back to validate CDV trend")
//cdvEntryLong = o_ < c_ and f_priorBarsSatisfied(o_ < c_,i_numLookbackBarsCDV)
//cdvEntryShort = o_ > c_ and f_priorBarsSatisfied(o_ > c_,i_numLookbackBarsCDV)
cdvEntryConditionLong = o_ <= c_
cdvEntryConditionShort = o_ > c_
cdvEntryLong = cdvEntryConditionLong and ta.barssince(cdvEntryConditionShort) > i_numLookbackBarsCDV
cdvEntryShort = cdvEntryConditionShort and ta.barssince(cdvEntryConditionLong) > i_numLookbackBarsCDV
//////////////////////////////////////
//* Put your strategy rules below *//
/////////////////////////////////////
longCondition = trendMagicEntryLong and sqzmomEntryLong and cdvEntryLong
shortCondition = trendMagicEntryShort and sqzmomEntryShort and cdvEntryShort
//define as 0 if do not want to use
closeLongCondition = 0
closeShortCondition = 0
// ADX
//░░░░░░░░░░░░░░░░░░░░░░░░░░░░░░░░░░░░░░░░░░░░░░░░░░░░░░░░░░░░░░░░░░░░░░░░░░░░░░░░░░░░░░░░░░░░░░░░░░░░░░░░░░░░░░░░░░░░░░░░░░░░░░░░░░░░░░░░░░░░░░░░░░
adxEnabled = input.bool(defval = false , title = "Average Directional Index (ADX)", tooltip = "", group ="ADX" )
adxlen = input(14, title="ADX Smoothing", group="ADX")
adxdilen = input(14, title="DI Length", group="ADX")
adxabove = input(25, title="ADX Threshold", group="ADX")
adxdirmov(len) =>
adxup = ta.change(HIGH)
adxdown = -ta.change(LOW)
adxplusDM = na(adxup) ? na : (adxup > adxdown and adxup > 0 ? adxup : 0)
adxminusDM = na(adxdown) ? na : (adxdown > adxup and adxdown > 0 ? adxdown : 0)
adxtruerange = ta.rma(ta.tr, len)
adxplus = fixnan(100 * ta.rma(adxplusDM, len) / adxtruerange)
adxminus = fixnan(100 * ta.rma(adxminusDM, len) / adxtruerange)
[adxplus, adxminus]
adx(adxdilen, adxlen) =>
[adxplus, adxminus] = adxdirmov(adxdilen)
adxsum = adxplus + adxminus
adx = 100 * ta.rma(math.abs(adxplus - adxminus) / (adxsum == 0 ? 1 : adxsum), adxlen)
adxsig = adxEnabled ? adx(adxdilen, adxlen) : na
isADXEnabledAndAboveThreshold = adxEnabled ? (adxsig > adxabove) : true
//Backtesting Time Period (Input.time not working as expected as of 03/30/2021. Giving odd start/end dates
//░░░░░░░░░░░░░░░░░░░░░░░░░░░░░░░░░░░░░░░░░░░░░░░░░░░░░░░░░░░░░░░░░░░░░░░░░░░░░░░░░░░░░░░░░░░░░░░░░░░░░░░░░░░░░░░░░░░░░░░░░░░░░░░░░░░░░░░░░░░░░░░░░░
useStartPeriodTime = input.bool(true, 'Start', group='Date Range', inline='Start Period')
startPeriodTime = input(timestamp('1 Jan 2019'), '', group='Date Range', inline='Start Period')
useEndPeriodTime = input.bool(true, 'End', group='Date Range', inline='End Period')
endPeriodTime = input(timestamp('31 Dec 2030'), '', group='Date Range', inline='End Period')
start = useStartPeriodTime ? startPeriodTime >= time : false
end = useEndPeriodTime ? endPeriodTime <= time : false
calcPeriod = true
// Trade Direction
// ░░░░░░░░░░░░░░░░░░░░░░░░░░░░░░░░░░░░░░░░░░░░░░░░░░░░░░░░░░░░░░░░░░░░░░░░░░░░░░░░░░░░░░░░░░░░░░░░░░░░░░░░░░░░░░░░░░░░░░░░░░░░░░░░░░░░░░░░░░░░░░░░░░
tradeDirection = input.string('Long and Short', title='Trade Direction', options=['Long and Short', 'Long Only', 'Short Only'], group='Trade Direction')
// Percent as Points
// ░░░░░░░░░░░░░░░░░░░░░░░░░░░░░░░░░░░░░░░░░░░░░░░░░░░░░░░░░░░░░░░░░░░░░░░░░░░░░░░░░░░░░░░░░░░░░░░░░░░░░░░░░░░░░░░░░░░░░░░░░░░░░░░░░░░░░░░░░░░░░░░░░░
per(pcnt) =>
strategy.position_size != 0 ? math.round(pcnt / 100 * strategy.position_avg_price / syminfo.mintick) : float(na)
// Take profit 1
// ░░░░░░░░░░░░░░░░░░░░░░░░░░░░░░░░░░░░░░░░░░░░░░░░░░░░░░░░░░░░░░░░░░░░░░░░░░░░░░░░░░░░░░░░░░░░░░░░░░░░░░░░░░░░░░░░░░░░░░░░░░░░░░░░░░░░░░░░░░░░░░░░░░
tp1 = input.float(title='Take Profit 1 - Target %', defval=2, minval=0.0, step=0.5, group='Take Profit', inline='Take Profit 1')
q1 = input.int(title='% Of Position', defval=100, minval=0, group='Take Profit', inline='Take Profit 1')
// Take profit 2
// ░░░░░░░░░░░░░░░░░░░░░░░░░░░░░░░░░░░░░░░░░░░░░░░░░░░░░░░░░░░░░░░░░░░░░░░░░░░░░░░░░░░░░░░░░░░░░░░░░░░░░░░░░░░░░░░░░░░░░░░░░░░░░░░░░░░░░░░░░░░░░░░░░░
tp2 = input.float(title='Take Profit 2 - Target %', defval=100, minval=0.0, step=0.5, group='Take Profit', inline='Take Profit 2')
q2 = input.int(title='% Of Position', defval=100, minval=0, group='Take Profit', inline='Take Profit 2')
// Take profit 3
// ░░░░░░░░░░░░░░░░░░░░░░░░░░░░░░░░░░░░░░░░░░░░░░░░░░░░░░░░░░░░░░░░░░░░░░░░░░░░░░░░░░░░░░░░░░░░░░░░░░░░░░░░░░░░░░░░░░░░░░░░░░░░░░░░░░░░░░░░░░░░░░░░░░
tp3 = input.float(title='Take Profit 3 - Target %', defval=100, minval=0.0, step=0.5, group='Take Profit', inline='Take Profit 3')
q3 = input.int(title='% Of Position', defval=100, minval=0, group='Take Profit', inline='Take Profit 3')
// Take profit 4
// ░░░░░░░░░░░░░░░░░░░░░░░░░░░░░░░░░░░░░░░░░░░░░░░░░░░░░░░░░░░░░░░░░░░░░░░░░░░░░░░░░░░░░░░░░░░░░░░░░░░░░░░░░░░░░░░░░░░░░░░░░░░░░░░░░░░░░░░░░░░░░░░░░░
tp4 = input.float(title='Take Profit 4 - Target %', defval=100, minval=0.0, step=0.5, group='Take Profit')
/// Stop Loss
// ░░░░░░░░░░░░░░░░░░░░░░░░░░░░░░░░░░░░░░░░░░░░░░░░░░░░░░░░░░░░░░░░░░░░░░░░░░░░░░░░░░░░░░░░░░░░░░░░░░░░░░░░░░░░░░░░░░░░░░░░░░░░░░░░░░░░░░░░░░░░░░░░░░
stoplossPercent = input.float(title='Stop Loss (%)', defval=6, minval=0.01, group='Stop Loss') * 0.01
slLongClose = CLOSE < strategy.position_avg_price * (1 - stoplossPercent)
slShortClose = CLOSE > strategy.position_avg_price * (1 + stoplossPercent)
/// Leverage
// ░░░░░░░░░░░░░░░░░░░░░░░░░░░░░░░░░░░░░░░░░░░░░░░░░░░░░░░░░░░░░░░░░░░░░░░░░░░░░░░░░░░░░░░░░░░░░░░░░░░░░░░░░░░░░░░░░░░░░░░░░░░░░░░░░░░░░░░░░░░░░░░░░░
leverage = input.float(1, 'Leverage', step=.5, group='Leverage')
contracts = math.min(math.max(.000001, strategy.equity / CLOSE * leverage), 1000000000)
/// Trade State Management
// ░░░░░░░░░░░░░░░░░░░░░░░░░░░░░░░░░░░░░░░░░░░░░░░░░░░░░░░░░░░░░░░░░░░░░░░░░░░░░░░░░░░░░░░░░░░░░░░░░░░░░░░░░░░░░░░░░░░░░░░░░░░░░░░░░░░░░░░░░░░░░░░░░░
isInLongPosition = strategy.position_size > 0
isInShortPosition = strategy.position_size < 0
/// ProfitView Alert Syntax String Generation
// ░░░░░░░░░░░░░░░░░░░░░░░░░░░░░░░░░░░░░░░░░░░░░░░░░░░░░░░░░░░░░░░░░░░░░░░░░░░░░░░░░░░░░░░░░░░░░░░░░░░░░░░░░░░░░░░░░░░░░░░░░░░░░░░░░░░░░░░░░░░░░░░░░░
alertSyntaxPrefix = input.string(defval='CRYPTANEX_99FTX_Strategy-Name-Here', title='Alert Syntax Prefix', group='ProfitView Alert Syntax')
alertSyntaxBase = alertSyntaxPrefix + '\n#' + str.tostring(OPEN) + ',' + str.tostring(HIGH) + ',' + str.tostring(LOW) + ',' + str.tostring(CLOSE) + ',' + str.tostring(volume) + ','
/// Trade Execution
// ░░░░░░░░░░░░░░░░░░░░░░░░░░░░░░░░░░░░░░░░░░░░░░░░░░░░░░░░░░░░░░░░░░░░░░░░░░░░░░░░░░░░░░░░░░░░░░░░░░░░░░░░░░░░░░░░░░░░░░░░░░░░░░░░░░░░░░░░░░░░░░░░░░
longConditionCalc = (longCondition and isADXEnabledAndAboveThreshold)
shortConditionCalc = (shortCondition and isADXEnabledAndAboveThreshold)
if calcPeriod
if longConditionCalc and tradeDirection != 'Short Only' and isInLongPosition == false
strategy.entry('Long', strategy.long, qty=contracts)
alert(message=alertSyntaxBase + 'side:long', freq=alert.freq_once_per_bar_close)
if shortConditionCalc and tradeDirection != 'Long Only' and isInShortPosition == false
strategy.entry('Short', strategy.short, qty=contracts)
alert(message=alertSyntaxBase + 'side:short', freq=alert.freq_once_per_bar_close)
//Inspired from Multiple %% profit exits example by adolgo https://www.tradingview.com/script/kHhCik9f-Multiple-profit-exits-example/
strategy.exit('TP1', qty_percent=q1, profit=per(tp1))
strategy.exit('TP2', qty_percent=q2, profit=per(tp2))
strategy.exit('TP3', qty_percent=q3, profit=per(tp3))
strategy.exit('TP4', profit=per(tp4))
strategy.close('Long', qty_percent=100, comment='SL Long', when=slLongClose)
strategy.close('Short', qty_percent=100, comment='SL Short', when=slShortClose)
strategy.close_all(when=closeLongCondition or closeShortCondition, comment='Close Postion')
/// Dashboard
// ░░░░░░░░░░░░░░░░░░░░░░░░░░░░░░░░░░░░░░░░░░░░░░░░░░░░░░░░░░░░░░░░░░░░░░░░░░░░░░░░░░░░░░░░░░░░░░░░░░░░░░░░░░░░░░░░░░░░░░░░░░░░░░░░░░░░░░░░░░░░░░░░░░
// Inspired by https://www.tradingview.com/script/uWqKX6A2/ - Thanks VertMT
showDashboard = input.bool(group="Dashboard", title="Show Dashboard", defval=false)
f_fillCell(_table, _column, _row, _title, _value, _bgcolor, _txtcolor) =>
_cellText = _title + "\n" + _value
table.cell(_table, _column, _row, _cellText, bgcolor=_bgcolor, text_color=_txtcolor, text_size=size.auto)
// Draw dashboard table
if showDashboard
var bgcolor = color.new(color.black,0)
// Keep track of Wins/Losses streaks
newWin = (strategy.wintrades > strategy.wintrades[1]) and (strategy.losstrades == strategy.losstrades[1]) and (strategy.eventrades == strategy.eventrades[1])
newLoss = (strategy.wintrades == strategy.wintrades[1]) and (strategy.losstrades > strategy.losstrades[1]) and (strategy.eventrades == strategy.eventrades[1])
varip int winRow = 0
varip int lossRow = 0
varip int maxWinRow = 0
varip int maxLossRow = 0
if newWin
lossRow := 0
winRow := winRow + 1
if winRow > maxWinRow
maxWinRow := winRow
if newLoss
winRow := 0
lossRow := lossRow + 1
if lossRow > maxLossRow
maxLossRow := lossRow
// Prepare stats table
var table dashTable = table.new(position.bottom_right, 1, 15, border_width=1)
if barstate.islastconfirmedhistory
// Update table
dollarReturn = strategy.netprofit
f_fillCell(dashTable, 0, 0, "Start:", str.format("{0,date,long}", strategy.closedtrades.entry_time(0)) , bgcolor, color.white) // + str.format(" {0,time,HH:mm}", strategy.closedtrades.entry_time(0))
f_fillCell(dashTable, 0, 1, "End:", str.format("{0,date,long}", strategy.opentrades.entry_time(0)) , bgcolor, color.white) // + str.format(" {0,time,HH:mm}", strategy.opentrades.entry_time(0))
_profit = (strategy.netprofit / strategy.initial_capital) * 100
f_fillCell(dashTable, 0, 2, "Net Profit:", str.tostring(_profit, '##.##') + "%", _profit > 0 ? color.green : color.red, color.white)
_numOfDaysInStrategy = (strategy.opentrades.entry_time(0) - strategy.closedtrades.entry_time(0)) / (1000 * 3600 * 24)
f_fillCell(dashTable, 0, 3, "Percent Per Day", str.tostring(_profit / _numOfDaysInStrategy, '#########################.#####')+"%", _profit > 0 ? color.green : color.red, color.white)
_winRate = ( strategy.wintrades / strategy.closedtrades ) * 100
f_fillCell(dashTable, 0, 4, "Percent Profitable:", str.tostring(_winRate, '##.##') + "%", _winRate < 50 ? color.red : _winRate < 75 ? #999900 : color.green, color.white)
f_fillCell(dashTable, 0, 5, "Profit Factor:", str.tostring(strategy.grossprofit / strategy.grossloss, '##.###'), strategy.grossprofit > strategy.grossloss ? color.green : color.red, color.white)
f_fillCell(dashTable, 0, 6, "Total Trades:", str.tostring(strategy.closedtrades), bgcolor, color.white)
f_fillCell(dashTable, 0, 8, "Max Wins In A Row:", str.tostring(maxWinRow, '######') , bgcolor, color.white)
f_fillCell(dashTable, 0, 9, "Max Losses In A Row:", str.tostring(maxLossRow, '######') , bgcolor, color.white)