Двойная тенденция, следующая количественной стратегии

Обзор
Основная идея этой стратегии заключается в том, чтобы использовать двойной тренд-трекер в сочетании с 123 обратной стратегией и индикатором радужного колебателя для повышения вероятности успеха стратегии. Стратегия динамически корректирует позиции, отслеживая краткосрочные и среднесрочные ценовые тенденции, чтобы достичь избыточной прибыли за пределами большого рынка.
Стратегический принцип
Стратегия состоит из двух частей:
-
123 обратная стратегия: если цена закрытия упала за два дня до закрытия, а цена закрытия поднялась сегодня, и на 9 день линия Slow K была ниже 50, сделайте больше; если цена закрытия поднялась за два дня до закрытия, а цена закрытия упала сегодня, и на 9 день линия Fast K была выше 50, сделайте пробел.
-
Индекс радужного колебателя: этот показатель отражает степень отклонения цены от движущейся средней, когда показатель выше 80, показывает, что рынок склонен к нестабильности; когда показатель ниже 20, показывает, что рынок склонен к обратному движению.
Эта стратегия объединяет эти два метода, одновременно открывая позиции при появлении сигнала о позиции, а в противном случае - истребляя позиции.
Анализ преимуществ
Эта стратегия имеет следующие преимущества:
- Двойная фильтрация улучшает качество сигнала и снижает погрешность.
- Динамическая коррекция позиций, снижение убытков в одностороннем движении.
- Интеграция краткосрочных и среднесрочных показателей для повышения стратегической стабильности.
Анализ рисков
Также существуют следующие риски:
- Недостаточная оптимизация параметров может привести к пересчёту.
- Двойные позиции увеличивают стоимость сделки.
- Стоп-порог может быть пробитым, когда цена на бирже сильно колеблется.
Эти риски могут быть снижены путем корректировки параметров, оптимизации управления позициями и разумной установки стоп-лосс.
Направление оптимизации
Эта стратегия может быть оптимизирована в следующих аспектах:
- Оптимизация параметров, чтобы найти оптимальную комбинацию параметров.
- Добавление модуля управления позициями, который позволяет корректировать позиции в зависимости от динамики волатильности и вывода.
- Добавление модуля Stop Loss, разумная настройка мобильного Stop Loss.
- Добавление алгоритмов машинного обучения, помогающих определить переломные моменты тренда.
Подвести итог
Эта стратегия объединяет 123 стратегии обратного отсчета и индикатор радужного колебателя, обеспечивает двойной отслеживание тенденций, сохраняет высокую стабильность и имеет определенный объем дополнительной прибыли.
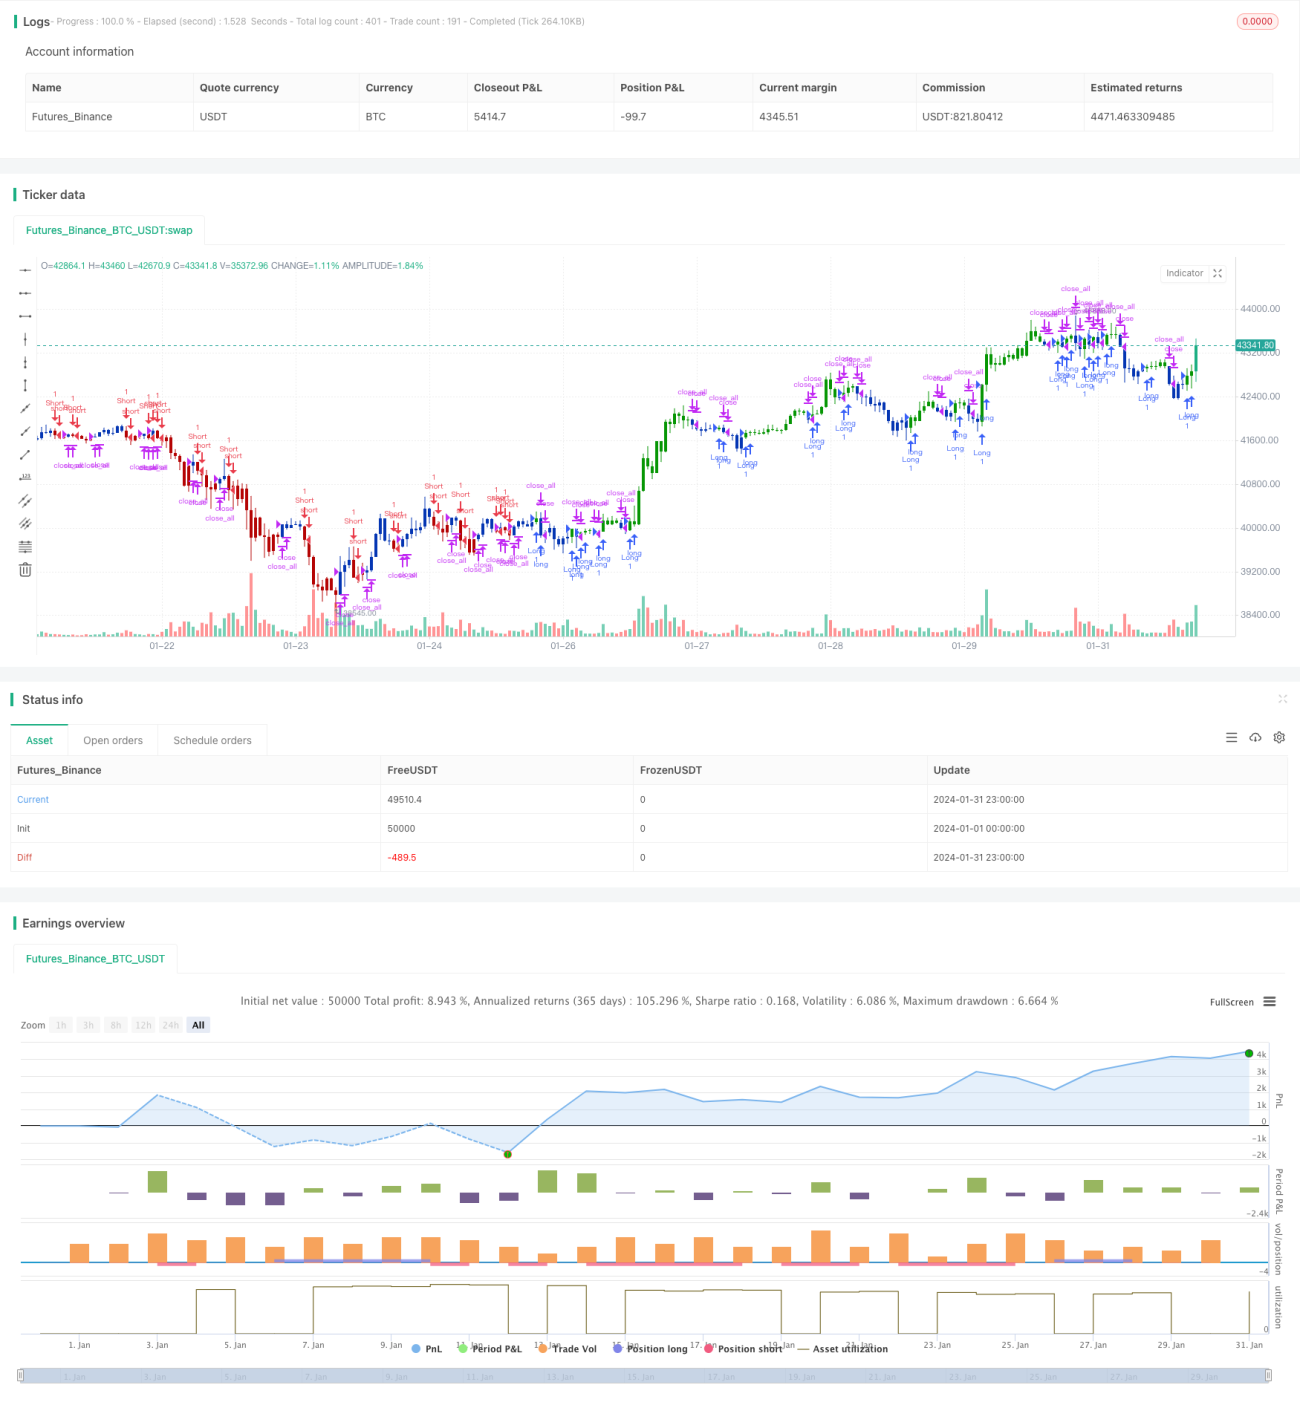
/*backtest
start: 2024-01-01 00:00:00
end: 2024-01-31 23:59:59
period: 1h
basePeriod: 15m
exchanges: [{"eid":"Futures_Binance","currency":"BTC_USDT"}]
*/

//@version=4
////////////////////////////////////////////////////////////
//  Copyright by HPotter v1.0 25/05/2021
// This is combo strategies for get a cumulative signal. - 1