حرکت پذیر اوسط رنگین EMA/SMA
مصنف:چاؤ ژانگ، تاریخ: 2022-05-11 21:03:07ٹیگز:ای ایم اے
ایمیزون پرائم ویڈیو نے بندش بینڈٹس سے گراج گراج جوگالبندی ویڈیو گانا پیش کیا۔ ریتوک بھومیک اور اٹل کُلکرنی نے ایک لوک گانا ادا کیا ، فرید حسن اور محمد امان نے گایا ، شنکر احسان لوئی نے موسیقی کی ہدایت کی اور سمیع سمنت نے گیت لکھے۔ سیزن کے اختتام میں راجہ اور دگویج نے اس گانے کو اپنے مشترکہ استاد پنڈت جی کے لئے ایک غزل کے طور پر دہرایا۔
بیک ٹسٹ
/*backtest
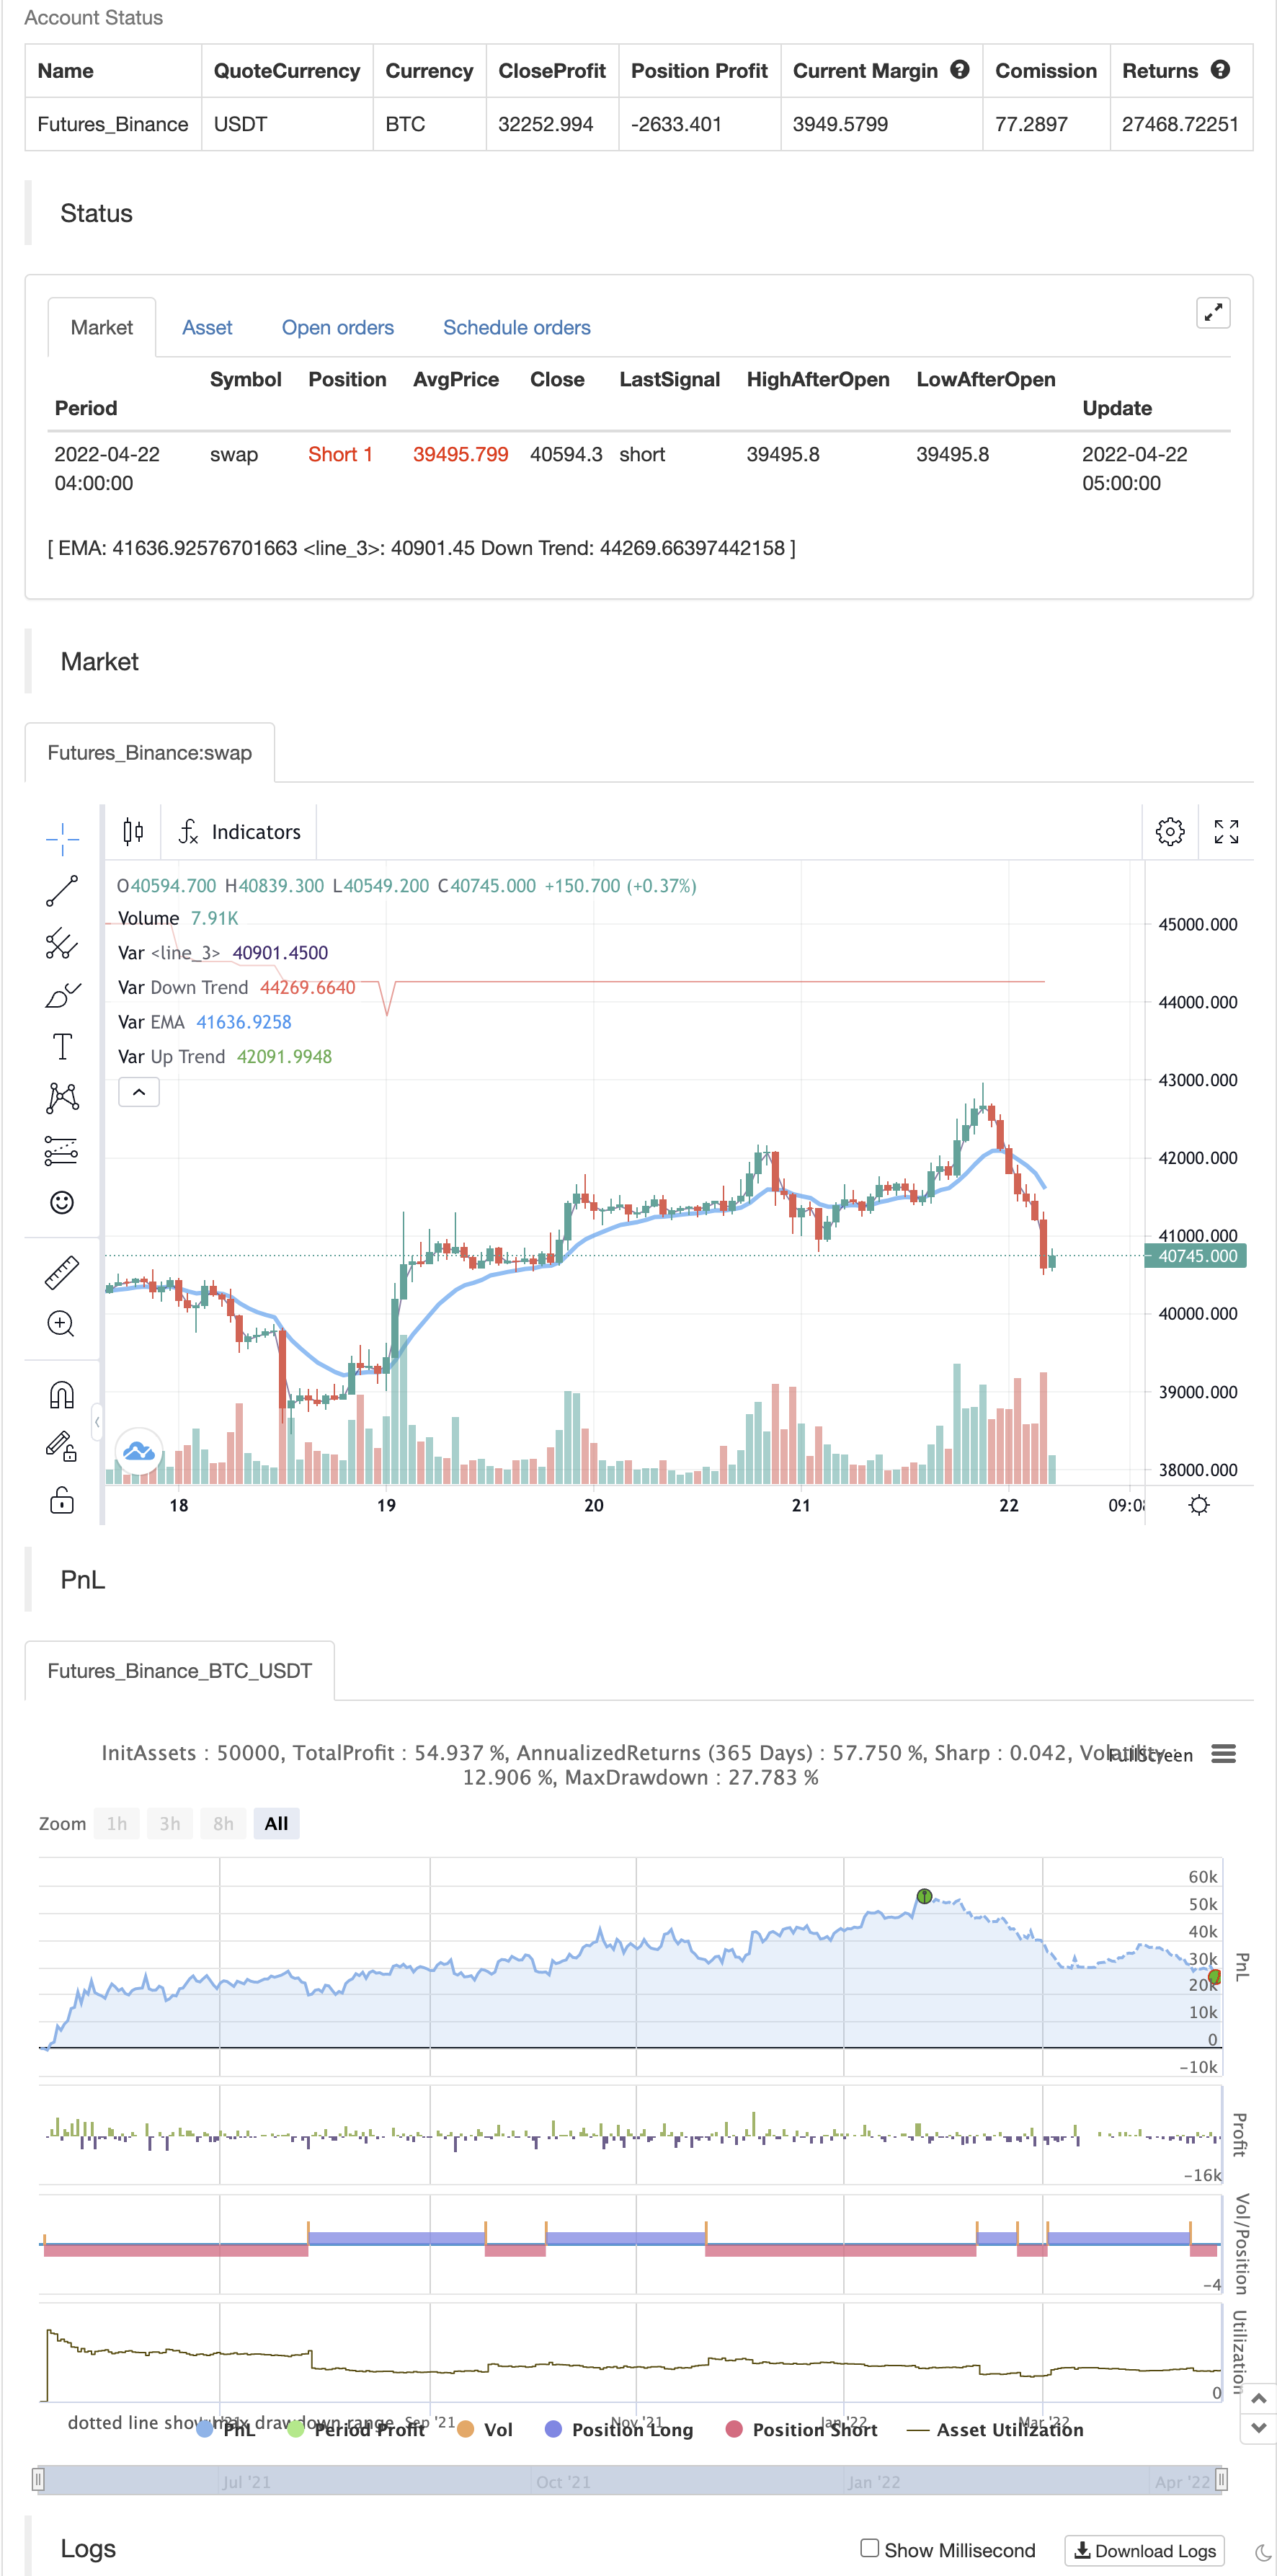
start: 2021-05-10 00:00:00
end: 2022-04-22 05:20:00
period: 1h
basePeriod: 15m
exchanges: [{"eid":"Futures_Binance","currency":"BTC_USDT"}]
*/
// This source code is subject to the terms of the Mozilla Public License 2.0 at https://mozilla.org/MPL/2.0/
// © subhajitbhattacharya
//@version=5
indicator('Moving Average Colored EMA/SMA', overlay=true, precision=2)
gr1 = "Moving Average Colored EMA/SMA"
emaplot = input(true, title='Show EMA on chart',group=gr1)
len = input.int(13, minval=1, title='Ema Length',group=gr1)
src = close
out = ta.ema(src, len)
up = out > out[1]
down = out < out[1]
mycolor = up ? color.green : down ? color.red : color.blue
plot(out and emaplot ? out : na, title='EMA', color=mycolor, linewidth=3)
smaplot = input(false, title='Show SMA on chart',group=gr1)
len2 = input.int(23, minval=1, title='Sma Length',group=gr1)
src2 = close
out2 = ta.sma(src2, len2)
up2 = out2 > out2[1]
down2 = out2 < out2[1]
mycolor2 = up2 ? color.green : down2 ? color.red : color.blue
plot(out2 and smaplot ? out2 : na, title='SMA', color=mycolor2, linewidth=1)
//===================== Holders Sentiment ==================================================
gr2 = 'Holders Sentiment'
length = input.int(50,group=gr2)
src3 = input(close, title='Source',group=gr2)
zeroline = 0
// hzplot = plot(zeroline, color=color.new(color.black, 0))
difabs = (src3[0] - src3[length]) / src3[length] * 100
plotColour = difabs > 0 ? color.green : color.red
// changeplot = plot(difabs, color=plotColour, linewidth=2)
// fill(plot1=changeplot, plot2=hzplot, color=color.new(color.blue, 90))
//================ Supertrend ================================================
gr3 = "Supertrend"
tf = input.timeframe('D', "Resolution",group=gr3)
atrPeriod = input(10, "ATR Length",group=gr3)
factor = input.float(3.0, "Factor", step = 0.01,group=gr3)
[supertrend, direction] = request.security(syminfo.tickerid, tf, ta.supertrend(factor, atrPeriod), barmerge.gaps_off, barmerge.lookahead_off)
bodyMiddle = plot((open + close) / 2, display=display.none)
upTrend = plot(direction < 0 ? supertrend : na, "Up Trend", color = color.green, style=plot.style_linebr)
downTrend = plot(direction < 0? na : supertrend, "Down Trend", color = color.red, style=plot.style_linebr)
//fill(bodyMiddle, upTrend, color.new(color.green, 90), fillgaps=false)
//fill(bodyMiddle, downTrend, color.new(color.red, 90), fillgaps=false)
//=================================================================================
bs1 = ta.crossover(out,out2) ? 1 : ta.crossunder(out,out2) ? -1 : 0
bs2 = difabs > 0 ? 1 : -1
bs3 = direction < 0 ? 1 : -1
bs = 0
bs := bs1 == 1 and bs2 == 1 and bs3 == 1 ? 1 : bs1 == -1 and bs2 == -1 and bs3 == -1 ? -1 : 0
buy = bs == 1 and nz(bs[1]) !=1
sell = bs == -1 and nz(bs[1]) != -1
//bgcolor(buy ? color.new(#00ff00, 50) : na)
//if buy
// label.new(bar_index, low, yloc = yloc.belowbar, text="Buy", textcolor = #00ff00, size = size.large, style=label.style_none)
//
//bgcolor(sell ? color.new(#b92ad8, 80) : na)
//if sell
// label.new(bar_index,high, yloc = yloc.abovebar, text="Sell", textcolor = #b92ad8, size = size.large, style=label.style_none)
alertcondition(buy, title='Buy Alert', message='Buy')
alertcondition(sell, title='sell Alert', message='Sell')
if buy
strategy.entry("Enter Long", strategy.long)
else if sell
strategy.entry("Enter Short", strategy.short)
متعلقہ
- مسلسل MACD گولڈن اور ڈیتھ کراس پر مبنی ٹریڈنگ حکمت عملی
- بہتر بولنگر بینڈس آر ایس آئی ٹریڈنگ حکمت عملی
- ٹرپل ای ایم اے کراس اوور حکمت عملی
- ایکسپونینشل حرکت پذیر اوسط کراس اوور لیورج کی حکمت عملی
- GM-8 اور ADX ڈبل حرکت پذیر اوسط حکمت عملی
- RSI/MACD/ATR کے ساتھ EMA کراس اوور کی بہتر حکمت عملی
- Z- اسکور رجحان کی پیروی کی حکمت عملی
- ای ایم اے پر طویل اندراج خطرے کے انتظام کی حکمت عملی کے ساتھ کراس
- وی ڈبلیو اے پی ٹریڈنگ حکمت عملی
- ویو ٹرینڈ کراس لیزیبیئر حکمت عملی
- الفا ٹریڈنگ بوٹ ٹریڈنگ کی حکمت عملی
مزید
- چاند لانچ الرٹس ٹیمپلیٹ [شاندار]
- HALFTREND + HEMA + SMA (غلط سگنل کی حکمت عملی)
- RSI Pivot، BB، SMA، EMA، SMMA، WMA، VWMA کے ساتھ اختلاف
- آر ایس آئی اور بی بی اور بیک وقت اوور سیلڈ
- رولنگ ہائکن آشی موم بتیاں
- کمبو 2/20 ای ایم اے اور بینڈ پاس فلٹر
- ای ایس ایس ایم اے
- 3EMA
- محور آرڈر بلاکس
- NMVOB-S
- ایم اے ایچ ایل بینڈ
- اس واحد اسکرپٹ میں 3 سپر رجحان شامل کریں
- سوئنگ ہائی/لو انڈیکیٹر w/ MACD اور EMA تصدیق
- ٹرپل ای ایم اے + ایم اے سی ڈی
- کراس کھیل
- چھوٹے فریکٹلز (+ شفافیت)
- BB-RSI-ADX اندراج پوائنٹس
- ہیل-4 ایما
- زاویہ حملہ لائن کے بعد اشارے
- کِجُن سِن لائن کراس کے ساتھ