ٹرپل سپر ٹرینڈ مقداری تجارتی حکمت عملی


تخلیق کی تاریخ: 2023-12-01 16:43:02 آخر میں ترمیم کریں: 2023-12-01 16:43:02
کاپی: 0 کلکس کی تعداد: 936
1
پر توجہ دیں
1619
پیروکار

ٹرپل سپر ٹرینڈ مقداری تجارتی حکمت عملی

جائزہ

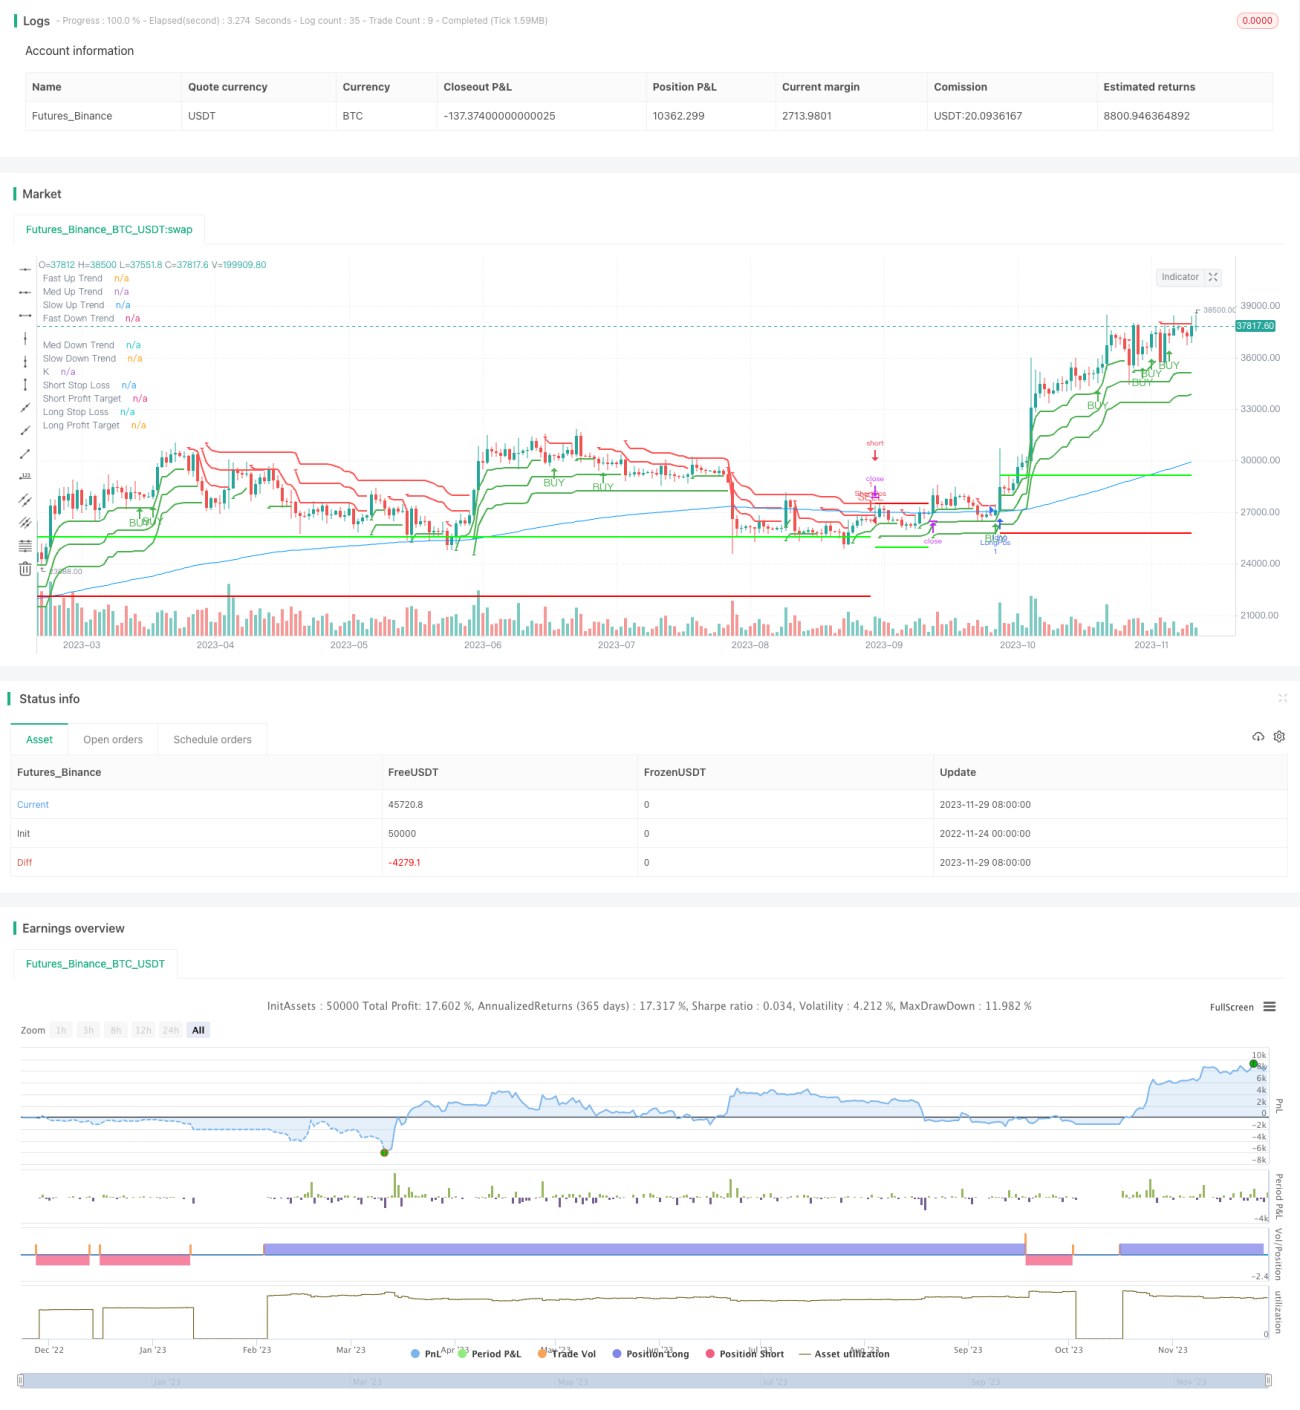
ٹرپل سپر ٹرینڈ کوانٹم ٹریڈنگ حکمت عملی ایک مختصر لائن ٹریڈنگ حکمت عملی ہے جس میں تین ٹرپل سپر ٹرینڈ اشارے شامل ہیں۔ یہ حکمت عملی کریپٹوکرنسی ، فاریکس اور دیگر اعلی تعدد ٹریڈنگ مارکیٹوں میں دن کے اندر تجارت اور مختصر لائن سودے بازی کے لئے موزوں ہے۔

حکمت عملی کا اصول

  • 200 دن کی متحرک اوسط کا استعمال کرتے ہوئے مجموعی طور پر مارکیٹ کے رجحان کی سمت کا اندازہ لگائیں۔ جب قیمت زیادہ ہو تو زیادہ کریں ، جب قیمت کم ہو تو کم کریں۔
  • ٹرپل سپر ٹرینڈ اشارے کا استعمال کرکے طبقاتی مارکیٹ کے رجحان کی سمت کا تعین کریں۔ سپر ٹرینڈ اشارے طبقاتی مارکیٹ کے زیادہ فاصلے والے رجحان کا درست اندازہ لگاسکتے ہیں۔
  • اسٹوک آر ایس آئی کے اشارے کا استعمال کرتے ہوئے جو برن بینڈ کے فیصلے سے زیادہ خریدنے اور فروخت کرنے کے لئے استعمال کیا جاتا ہے ، اس میں داخل ہونے کا اشارہ بنایا گیا ہے۔ اسٹوک آر ایس آئی الٹ جانے کے مواقع کی نشاندہی کرسکتا ہے۔
  • اس کے نتیجے میں ، اسٹریٹجک اسٹاپ کا تعین کیا گیا ہے کہ اسٹریٹجک اسٹاپ کا خطرہ 1.5 گنا زیادہ ہے۔

اسٹریٹجک فوائد

  • متعدد رجحانات کے اشارے کی توثیق ، فیصلہ سازی کی درستگی کو بہتر بناتی ہے۔
  • اوور بیئر اوور سیل اشارے واپسی کے مواقع کی نشاندہی کرتے ہیں ، اور واپسی کا آغاز کرتے ہیں۔
  • سٹاپ نقصان روکنے کا طریقہ کار کنٹرول خطرے اور منافع کا تناسب
  • ہائی فریکوئنسی شارٹ لائن تجارت کے لئے موزوں ، منافع بخش جگہ بڑی ہے۔

اسٹریٹجک رسک

  • بڑے دورانیے کے حالات خراب ہونے پر ، مختصر لائنوں میں تجارت میں نقصان کا خطرہ زیادہ ہوتا ہے۔
  • اس کے علاوہ، اس کے نتیجے میں غلط فیصلے کرنے کا امکان موجود ہے.
  • اس کے علاوہ، یہ بھی کہا گیا ہے کہ اس کی وجہ سے اس کی مارکیٹنگ کی ضرورت ہوتی ہے، اور اس کی وجہ سے اس کے لئے مناسب نہیں ہے.

حکمت عملی کی اصلاح

  • زیادہ سے زیادہ مدت کے لئے متحرک اوسط پیرامیٹرز کو بہتر بنائیں۔
  • Stoch RSI پیرامیٹرز کو بہتر بنائیں ، غلط سگنل کی شرح کو کم کریں۔
  • اسٹاپ نقصان کو بہتر بنانے کے لئے اوور ٹرینڈ اے ٹی آر سائیکل پیرامیٹرز کو بہتر بنائیں۔
  • پوزیشن مینجمنٹ میں اضافہ کریں اور واپسی کی شرح کے مطابق پوزیشن میں اضافہ کریں۔

خلاصہ کریں۔

ٹرپل سپر ٹرینڈ کوانٹم ٹریڈنگ حکمت عملی ، متعدد رجحان اشارے کی توثیق کا استعمال کرتے ہوئے فیصلہ سازی کی درستگی کو بہتر بناتا ہے ، اسٹاپ نقصانات کو روکنے کے لئے خطرہ منافع کی شرح کو کنٹرول کرتا ہے ، جو اعلی تعدد شارٹ لائن ٹریڈنگ کے لئے موزوں ہے۔ اصلاحی پیرامیٹرز کو طویل تجارتی دورانیے کے مطابق ڈھال لیا جاسکتا ہے ، غلط سگنل کے امکان کو کم کیا جاسکتا ہے ، اور اسٹاپ نقصانات کو روکنے کے اثر کو بہتر بنایا جاسکتا ہے۔ پوزیشن مینجمنٹ کو شامل کیا جاسکتا ہے جب پوزیشن کو ایڈجسٹ کیا جاسکتا ہے ، منافع کی گنجائش کو بڑھا دیا جاسکتا ہے۔

حکمت عملی کا ماخذ کوڈ
/*backtest
start: 2022-11-24 00:00:00
end: 2023-11-30 00:00:00
period: 1d
basePeriod: 1h
exchanges: [{"eid":"Futures_Binance","currency":"BTC_USDT"}]
*/

//@version=4
strategy("3x SuperTrend Strategy (Mel0nTek) V1", calc_on_every_tick=true, overlay=true)

// ***************************************************
//  A Mel0nTek Project
//  Author: mel0n
//  Revision: 1.0 - Initial Release
// ***************************************************

// ***************************************************
//              Strategy & Rules
// ***************************************************
// === Sources ===
// Strategy Idea:
// Trade Pro - HIGHEST PROFIT Triple Supertrend Trading Strategy Proven 100 Trade Results
// https://www.youtube.com/watch?v=HpNZ2VpZzSE
//
// Combining SuperTrend with StochRSI is not a new idea by any means.
// However the method/criteria used in his video to apply them caught my interest.
// So I decided to code it up for myself to do some backtesting.
// The default values are the ones he uses in his video, however I found some tuning beneficial. YMMV
// Trade Pro makes some great content, the video is a good watch to get a better understanding of this strategy.
//
// Improved SuperTrend Calculation Method:
// SuperTrend by KivancOzbilgic

// === Indicators ===
// EMA 
// @ 200
// Stoch RSI (default)
// @ 3, 3, 14, 14, close
// Supertrend slow
// @ 12, hl2, 3, change = true
// Supertrend med
// @ 11, hl2, 2, change = true
// Supertrend fast
// @ 10, hl2, 1, change = true

// === Rules ===
// long only 
// - price above EMA200
// short only 
// - price below EMA200
// Stop Loss = 2nd SuperTrend line above (short) or below(long) entry candle
// Profit = 1.5x SL/risk (Profit Ratio x Max Loss)

// === Entries ===
// LONG
// - long entry (Typical): 
// - Stoch RSI below 20, cross up
// - 2nd SuperTrend line below close

// SHORT
// - short entry (Typical): 
// - Stoch RSI above 80, cross down
// - 2nd SuperTrend line above close


// ***************************************************
// Backtest Parameters
// ***************************************************
testStartYear = input(2020, "Backtest Start Year")
testStartMonth = input(1, "Backtest Start Month")
testStartDay = input(1, "Backtest Start Day")
testPeriodStart = timestamp(testStartYear, testStartMonth, testStartDay, 0, 0)
timeCondition = time >= testPeriodStart
direction = input(0, title = "Strategy Direction", type=input.integer, minval=-1, maxval=1)
strategy.risk.allow_entry_in(direction == 0 ? strategy.direction.all : (direction < 0 ? strategy.direction.short : strategy.direction.long))

// ***************************************************
// Inputs
// ***************************************************
// P/L Ratio
plInput = input(1.5, title="P/L Ratio", step=0.1, minval=0.1)
// EMA
EMAInputlength = input(200, "EMA Length",step=100, minval=1)
// Stoch RSI
srsiInputSmoothK = input(3, "K", minval=1)
srsiInputSmoothD = input(3, "D", minval=1)
srsiInputLengthRSI = input(14, "Stoch RSI Length", minval=1)
srsiInputLengthStoch = input(14, "Stochastic Length", minval=1)
srsiInputSrc = input(close, title="Stoch RSI Source")
srsiInputThresh = input(20, title="Stoch RSI Entry Thresh", minval=1)
// SuperTrends
stInputSrc = input(hl2, title="SuperTrend Source")
stSlowInputLength = input(12, "Slow SuperTrend Length", minval=1)
stSlowInputMult = input(3, "Slow SuperTrend Multiplier", minval=1)
stMedInputLength = input(11, "Med SuperTrend Length", minval=1)
stMedInputMult = input(2, "Med SuperTrend Multiplier", minval=1)
stFastInputLength = input(10, "Fast SuperTrend Length", minval=1)
stFastInputMult = input(1, "Fast SuperTrend Multiplier", minval=1)
stInputchangeATR= input(title="Alternate SuperTrend ATR Calculation?", type=input.bool, defval=true)
// Toggles
showPLTargets = input(true, title="Show Open Profit/Loss Targets?")
showBuySell = input(true, title="Show Buy/Sell Indicators?")


// ***************************************************
// Indicator Functions
// ***************************************************
// SuperTrend Function
superTrend(period, src, mult, chgATR) =>
    stATRSmooth = sma(tr, period)                       // tr = true range
    stATR = chgATR ? atr(period) : stATRSmooth          // select ATR to use
    stUP = src - (mult * stATR)                         // up value
    stUP1 = nz(stUP[1], stUP)                           // prev candle value if not 0
    stUP := close[1] > stUP1 ? max(stUP,stUP1) : stUP   // select the larger up value if close is higher than previous up value
    stDN = src  + (mult * stATR)
    stDN1 = nz(stDN[1], stDN)
    stDN := close[1] < stDN1 ? min(stDN, stDN1) : stDN
    stTrend = 1
    stTrend := nz(stTrend[1], stTrend)
    stTrend := stTrend == -1 and close > stDN1 ? 1 : stTrend == 1 and close < stUP1 ? -1 : stTrend
    stBuySignal = stTrend == 1 and stTrend[1] == -1
    stSellSignal = stTrend == -1 and stTrend[1] == 1
    stChangeCond = stTrend != stTrend[1]
    [stUP, stDN, stTrend, stBuySignal, stSellSignal, stChangeCond]

// Stochastic RSI Function
stochRSI(smoothK, smoothD, lengthRSI, lengthStoch, src) =>
    rsiVal = rsi(src, lengthRSI)
    k = sma(stoch(rsiVal, rsiVal, rsiVal, lengthStoch), smoothK)
    d = sma(k, smoothD)
    [k, d]

// ***************************************************
// Data Calculation
// ***************************************************
// SuperTrend Slow
[stSlowUP, stSlowDN, stSlowTrend, stSlowBuy, stSlowSell, stSlowChanged] = superTrend(stSlowInputLength, stInputSrc, stSlowInputMult, stInputchangeATR)

// SuperTrend Medium
[stMedUP, stMedDN, stMedTrend, stMedBuy, stMedSell, stMedChanged] = superTrend(stMedInputLength, stInputSrc, stMedInputMult, stInputchangeATR)

// SuperTrend Fast
[stFastUP, stFastDN, stFastTrend, stFastBuy, stFastSell, stFastChanged] = superTrend(stFastInputLength, stInputSrc, stFastInputMult, stInputchangeATR)

// Stoch RSI
[srsiK, srsiD] = stochRSI(srsiInputSmoothK,srsiInputSmoothD,srsiInputLengthRSI,srsiInputLengthStoch,srsiInputSrc)

// EMA
emaVal = ema(close,EMAInputlength)

// ***************************************************
// Indicator Plots
// ***************************************************
// EMA
plot(emaVal, "K", color=#0094FF)

// SuperTrend Slow
plot(stSlowTrend == 1 ? stSlowUP : na, title="Slow Up Trend", style=plot.style_linebr, linewidth=2, color=color.green)
plotshape(stSlowBuy ? stSlowUP : na, title="Slow UpTrend Begins", location=location.absolute, style=shape.triangleup, size=size.tiny, color=color.green, transp=0)
plot(stSlowTrend == 1 ? na : stSlowDN, title="Slow Down Trend", style=plot.style_linebr, linewidth=2, color=color.red)
plotshape(stSlowSell ? stSlowDN : na, title="Slow DownTrend Begins", location=location.absolute, style=shape.triangledown, size=size.tiny, color=color.red, transp=0)

// SuperTrend Medium
plot(stMedTrend == 1 ? stMedUP : na, title="Med Up Trend", style=plot.style_linebr, linewidth=2, color=color.green)
plotshape(stMedBuy ? stMedUP : na, title="Med UpTrend Begins", location=location.absolute, style=shape.triangleup, size=size.tiny, color=color.green, transp=0)
plot(stMedTrend == 1 ? na : stMedDN, title="Med Down Trend", style=plot.style_linebr, linewidth=2, color=color.red)
plotshape(stMedSell ? stMedDN : na, title="Med DownTrend Begins", location=location.absolute, style=shape.triangledown, size=size.tiny, color=color.red, transp=0)

// SuperTrend Fast
plot(stFastTrend == 1 ? stFastUP : na, title="Fast Up Trend", style=plot.style_linebr, linewidth=2, color=color.green)
plotshape(stFastBuy ? stFastUP : na, title="Fast UpTrend Begins", location=location.absolute, style=shape.triangleup, size=size.tiny, color=color.green, transp=0)
plot(stFastTrend == 1 ? na : stFastDN, title="Fast Down Trend", style=plot.style_linebr, linewidth=2, color=color.red)
plotshape(stFastSell ? stFastDN : na, title="Fast DownTrend Begins", location=location.absolute, style=shape.triangledown, size=size.tiny, color=color.red, transp=0)

// Stoch RSI
// plot(srsiK, "K", color=#0094FF)
// plot(srsiD, "D", color=#FF6A00)
// h0 = hline(80, "Upper Band", color=#606060)
// h1 = hline(20, "Lower Band", color=#606060)
// fill(h0, h1, color=#9915FF, transp=80, title="Background")

// ***************************************************
// Conditional Logic
// ***************************************************
// common vars
float longStop = na
float longProfit = na
float shortStop = na
float shortProfit = na

// check EMA to determine long/short side trading
emaTrend = emaVal < close ? 1 : -1

// count how many supertrends are above/below
stCount = 0
stCount := stFastTrend + stMedTrend + stSlowTrend

// LONG
// - long entry (Typical): 
// - Stoch RSI below 20, cross up
// - 2 ST's below close
stochLongCond = srsiK < srsiInputThresh and crossover(srsiK, srsiD)
stLongCond = stCount >= 1
longCondition = emaTrend > 0 and stochLongCond and stLongCond

tempStopLong = longCondition ? stCount == 3 ? stMedUP : stSlowUP : longStop
longStopDelta = abs(close - tempStopLong)
tempProfitLong = longCondition ? close + (plInput * longStopDelta) : longProfit

longStop := strategy.position_size <= 0 ? longCondition ? tempStopLong : na : longStop[1]
longProfit := strategy.position_size <= 0 ? longCondition ? tempProfitLong : na : longProfit[1]

// SHORT
// - short entry (Typical): 
// - Stoch RSI above 80, cross down
// - 2 ST's above close
stochShortCond = srsiK > 100 - srsiInputThresh and crossunder(srsiK, srsiD)
stShortCond = stCount <= -1
shortCondition = emaTrend < 0 and stochShortCond and stShortCond

tempStopShort = shortCondition ? stCount == -3 ? stMedDN : stSlowDN : shortStop
shortStopDelta = abs(close - tempStopShort)
tempProfitShort = shortCondition ? close - (plInput * shortStopDelta) : shortProfit

shortStop := strategy.position_size >= 0 ? shortCondition ? tempStopShort : na : shortStop[1]
shortProfit := strategy.position_size >= 0 ? shortCondition ? tempProfitShort : na : shortProfit[1]

// ***************************************************
// Strategy Execution
// ***************************************************
strategy.exit("TP/SL", "LongPos", stop=longStop, limit=longProfit) 
strategy.exit("TP/SL", "ShortPos", stop=shortStop, limit=shortProfit) 

if (longCondition)
	strategy.entry("LongPos", strategy.long, stop=longStop, oca_name="3xST", comment="Long")
else
	strategy.cancel(id="LongPos")
if (shortCondition)
	strategy.entry("ShortPos", strategy.short, stop=shortStop, oca_name="3xST", comment="Short")
else
	strategy.cancel(id="ShortPos")

// ***************************************************
// Strategy Plotting
// ***************************************************
// profit/loss target lines
plot(showPLTargets ? strategy.position_size <= 0 ? na : longStop : na, title="Long Stop Loss", color=color.new(#ff0000, 0), style=plot.style_linebr, linewidth=2)
plot(showPLTargets ? strategy.position_size <= 0 ? na : longProfit : na, title="Long Profit Target", color=color.new(#00ff00, 0), style=plot.style_linebr, linewidth=2)
plot(showPLTargets ? strategy.position_size >= 0 ? na : shortStop : na, title="Short Stop Loss", color=color.new(#ff0000, 0), style=plot.style_linebr, linewidth=2)
plot(showPLTargets ? strategy.position_size >= 0 ? na : shortProfit : na, title="Short Profit Target", color=color.new(#00ff00, 0), style=plot.style_linebr, linewidth=2)
// buy/sell arrows
plotshape(showBuySell and longCondition ? true : na, title='Buy Arrow',  location=location.belowbar, color=color.green,   style=shape.arrowup,   text="BUY",  textcolor=color.green, transp=0, size=size.small)
plotshape(showBuySell and shortCondition ? true : na, title='Sell Arrow', location=location.abovebar, color=color.red,     style=shape.arrowdown, text="SELL", textcolor=color.red,   transp=0, size=size.small)

// ***************************************************
// Alerts (for use in a study)
// ***************************************************
alertcondition(longCondition, title="3xST Buy alert", message="Buy")
alertcondition(shortCondition, title="3xST SELL alert", message="Sell")
alertcondition(stSlowChanged, title="3xST Slow Trend alert", message="Slow Trend Changed")