ڈبل بینڈ پر مبنی مضبوط انڈیکس ٹریڈنگ حکمت عملی
تخلیق کی تاریخ:
2023-12-12 17:12:35
آخر میں ترمیم کریں:
2023-12-12 17:47:33
کاپی:
1
کلکس کی تعداد:
1068
1
پر توجہ دیں
1750
پیروکار
جائزہ
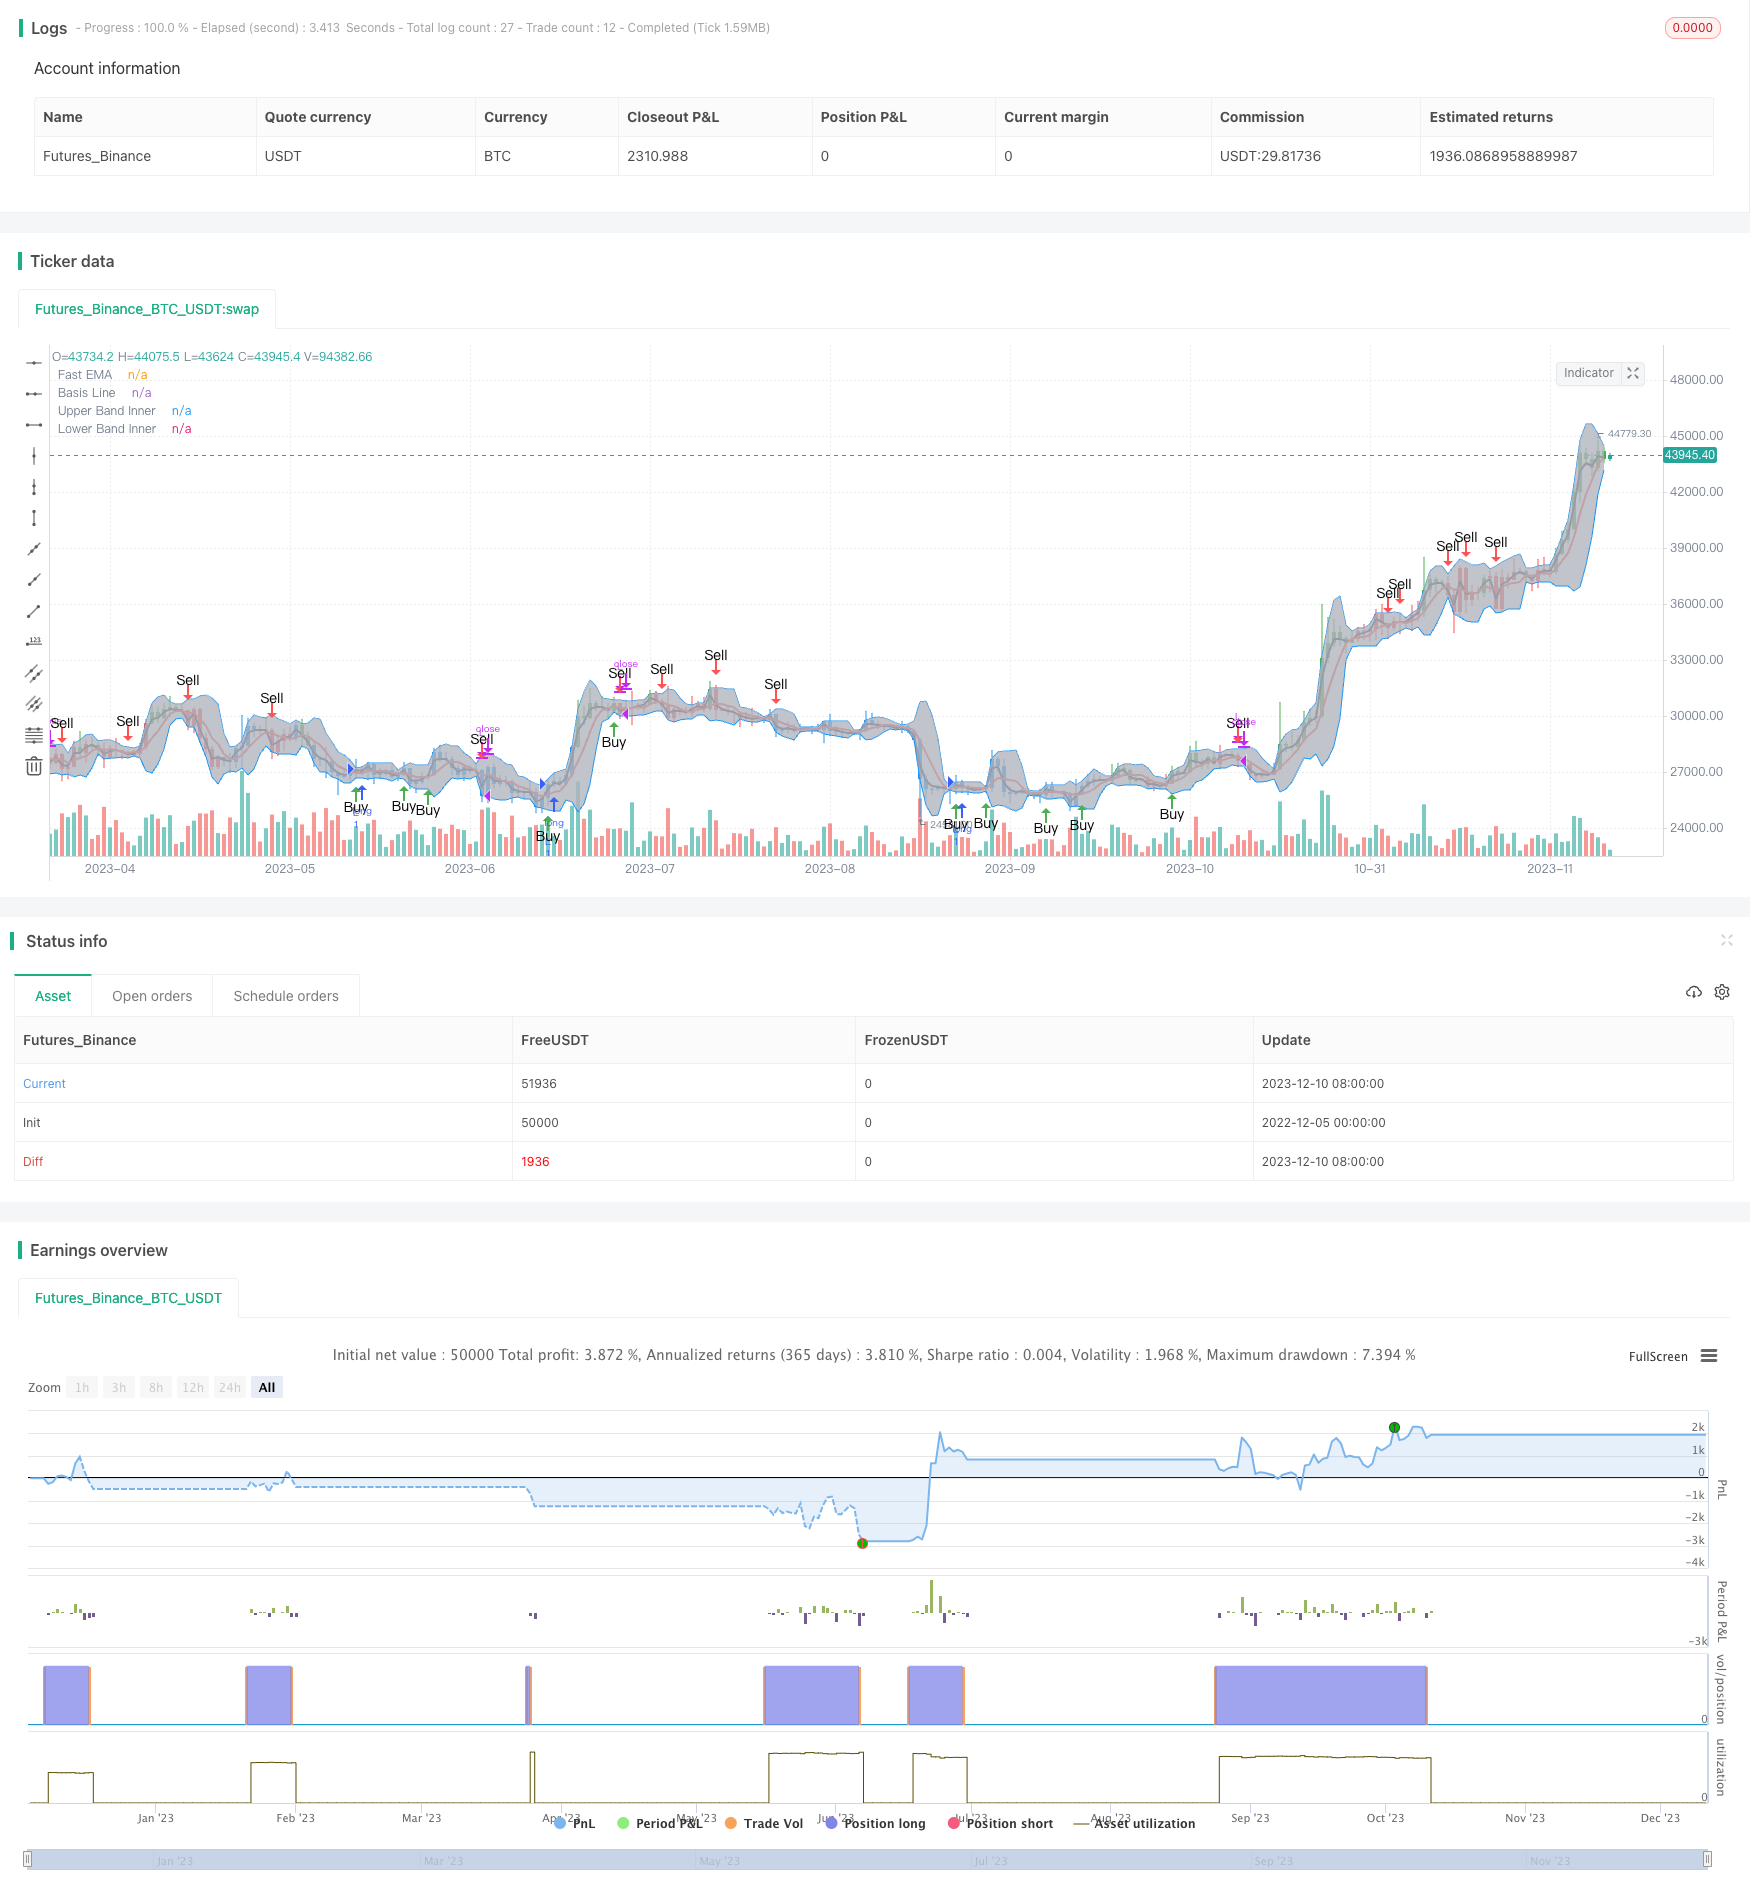
اس حکمت عملی میں ڈبل ویو بینڈ اشارے اور مضبوط اشاریہ اشارے شامل ہیں ، جس سے بریک ٹریڈنگ موڈ حاصل ہوتا ہے۔ جب فاسٹ ای ایم اے نے ویو بینڈ چینل کو توڑ دیا تو ، اے او اشارے کے ملٹی بائیڈ اشارے کے ساتھ مل کر ، خرید اور فروخت کے اشارے پیدا کیے گئے۔
حکمت عملی کا اصول
- قیمتوں کا تعین کرنے کے لئے برن بینڈ کا استعمال کرتے ہوئے درمیانی ریل ، اوپری ریل اور نچلی ریل چینل۔
- تیز رفتار ای ایم اے نے درمیانی مدار کو عبور کیا ، جس کا فیصلہ چینل توڑنے کے طور پر کیا گیا۔
- طاقت انڈیکس اے او اشارے کثیر سر اور خالی سر کی سمت کا فیصلہ کرتی ہے۔
- جب فاسٹ ای ایم اے اوپر کی طرف وسط ٹریک کو توڑتا ہے اور اے او مثبت ہوتا ہے تو ، خریدنے کا اشارہ پیدا ہوتا ہے۔
- جب تیز EMA نیچے کی طرف وسط ٹریک کو توڑتا ہے اور AO منفی ہوتا ہے تو ، فروخت کا اشارہ ہوتا ہے۔
طاقت کا تجزیہ
- ڈبل ویو بینڈ اشارے قیمت چینل کا تعین کرتے ہیں تاکہ غلط سگنل سے بچا جاسکے۔
- AO اشارے رجحان کی سمت کا تعین کرتے ہیں اور ٹریڈنگ سگنل کو زیادہ درست بناتے ہیں۔
- چینل بریک ٹریڈنگ کے ساتھ مل کر ، رجحانات کے ابتدائی مراحل میں زیادہ منافع بخش ٹریڈنگ کی جا سکتی ہے۔
خطرے کا تجزیہ
- غلط برن بینڈ پیرامیٹرز کی وجہ سے کوریج بہت وسیع یا بہت تنگ ہوسکتی ہے۔
- AO اشارے پیرامیٹرز کی ترتیب فیصلے کی درستگی کو متاثر کرتی ہے۔
- یہ ممکن ہے کہ یہ سگنل جعلی ہے اور اس بات کو یقینی بنانا ضروری ہے کہ اس میں کافی طاقت موجود ہو۔
حل
- برن بینڈ اور اے او اشارے کے پیرامیٹرز کو بہتر بنائیں تاکہ بہترین مجموعہ تلاش کیا جاسکے۔
- جعلی دراندازیوں سے بچنے کے لئے دراندازی کی طاقت کی شرائط میں اضافہ کریں۔
- دوسرے اشارے کے ساتھ استعمال کیا جاتا ہے تاکہ ٹریڈنگ سگنل کی وشوسنییتا کو یقینی بنایا جاسکے۔
اصلاح کی سمت
- برین بینڈ کے پیرامیٹرز کو بہتر بنانے کے لئے، سب سے زیادہ موزوں کوریج کی حد تلاش کریں.
- اے او اشارے کی طویل مدتی اوسط لائن پیرامیٹرز کو بہتر بنانا ، فیصلہ کی درستگی کو بہتر بنانا
- حجم یا دیگر اشارے کے فلٹر کو بڑھانا ، اس بات کا یقین کرنے کے لئے کہ کامیابی کی وشوسنییتا کو یقینی بنایا جائے
- توڑنے کی طاقت کے پیرامیٹرز کو بہتر بنائیں ، جعلی توڑنے کی شرح کو کم کریں۔
خلاصہ کریں۔
اس حکمت عملی میں قیمت کے راستے ، رجحان کی سمت اور ٹوٹ پھوٹ کے انداز کو مدنظر رکھا گیا ہے۔ یہ ایک زیادہ مستحکم اور موثر تجارتی حکمت عملی ہے۔ پیرامیٹرز کی اصلاح اور مجموعی اشارے کے فلٹرنگ کے ذریعہ حکمت عملی کی استحکام اور منافع کی شرح کو مزید بڑھایا جاسکتا ہے۔ اس کا ٹوٹ پھوٹ کا تجارتی انداز رجحان کے ابتدائی مواقع کو پکڑ سکتا ہے ، جس کی بڑی عملی قدر ہے۔
حکمت عملی کا ماخذ کوڈ
/*backtest
start: 2022-12-05 00:00:00
end: 2023-12-11 00:00:00
period: 1d
basePeriod: 1h
exchanges: [{"eid":"Futures_Binance","currency":"BTC_USDT"}]
*/

//@version=3

strategy(shorttitle="BB+AO STRAT", title="BB+AO STRAT", overlay=true)


// === BACKTEST RANGE ===
FromMonth = input(defval = 6, title = "From Month", minval = 1)
FromDay   = input(defval = 1, title = "From Day", minval = 1)
FromYear  = input(defval = 2018, title = "From Year", minval = 2014)
ToMonth   = input(defval = 1, title = "To Month", minval = 1)
ToDay     = input(defval = 1, title = "To Day", minval = 1)
ToYear    = input(defval = 9999, title = "To Year", minval = 2014)

// Bollinger Bands Inputs
bb_use_ema = input(false, title="Use EMA for Bollinger Band")
bb_length = input(5, minval=1, title="Bollinger Length")
bb_source = input(close, title="Bollinger Source")
bb_mult = input(2.0, title="Base Multiplier", minval=0.5, maxval=10)
// EMA inputs
fast_ma_len = input(2, title="Fast EMA length", minval=2)
// Awesome Inputs
nLengthSlow = input(34, minval=1, title="Awesome Length Slow")
nLengthFast = input(5, minval=1, title="Awesome Length Fast")


// Breakout Indicator Inputs
bb_basis = bb_use_ema ? ema(bb_source, bb_length) : sma(bb_source, bb_length)
fast_ma  = ema(bb_source, fast_ma_len)

// Deviation

dev = stdev(bb_source, bb_length)
bb_dev_inner = bb_mult * dev

// Upper bands
inner_high = bb_basis + bb_dev_inner
// Lower Bands
inner_low = bb_basis - bb_dev_inner

// Calculate Awesome Oscillator
xSMA1_hl2 = sma(hl2, nLengthFast)
xSMA2_hl2 = sma(hl2, nLengthSlow)
xSMA1_SMA2 = xSMA1_hl2 - xSMA2_hl2
// Calculate direction of AO
AO = xSMA1_SMA2>=0? xSMA1_SMA2 > xSMA1_SMA2[1] ? 1 : 2 : xSMA1_SMA2 > xSMA1_SMA2[1] ? -1 : -2


// === PLOTTING ===

// plot BB basis
plot(bb_basis, title="Basis Line", color=red, transp=10, linewidth=2)
// plot BB upper and lower bands
ubi = plot(inner_high, title="Upper Band Inner", color=blue, transp=10, linewidth=1)
lbi = plot(inner_low, title="Lower Band Inner", color=blue, transp=10, linewidth=1)
// center BB channel fill
fill(ubi, lbi, title="Center Channel Fill", color=silver, transp=90)

// plot fast ma
plot(fast_ma, title="Fast EMA", color=black, transp=10, linewidth=2)

// Calc breakouts
break_down =   crossunder(fast_ma, bb_basis) and close < bb_basis and abs(AO)==2
break_up   =  crossover(fast_ma, bb_basis) and close > bb_basis and abs(AO)==1

// Show Break Alerts
plotshape(break_down, title="Breakout Down", style=shape.arrowdown, location=location.abovebar, size=size.auto, text="Sell", color=red, transp=0)
plotshape(break_up, title="Breakout Up", style=shape.arrowup, location=location.belowbar, size=size.auto, text="Buy", color=green, transp=0)
// === ALERTS ===


strategy.entry("L", strategy.long, when=(break_up and (time > timestamp(FromYear, FromMonth, FromDay, 00, 00)) and (time < timestamp(ToYear, ToMonth, ToDay, 23, 59))))


strategy.close("L", when=(break_down and (time < timestamp(ToYear, ToMonth, ToDay, 23, 59))))

// === /PLOTTING ===
barcolor(AO == 2 ? red: AO == 1 ? green : blue )


// eof