BTC تجارتی حکمت عملی EMA موونگ ایوریج اور MACD اشارے پر مبنی ہے۔
جائزہ
یہ حکمت عملی ای ایم اے کی اوسط لائن کے فرق اور ایم اے سی ڈی اشارے پر مبنی ایک جامع حکمت عملی ہے جو بی ٹی سی کی مختصر تجارت کے لئے استعمال کی جاتی ہے۔ یہ ای ایم اے کی اوسط لائن اور ایم اے سی ڈی کے اشاروں کو جوڑتا ہے جس سے مخصوص حالات میں خرید اور فروخت کے اشارے پیدا ہوتے ہیں۔
حکمت عملی کا اصول
جب فرق منفی ہو ، اور کم سے کم ہو ، اور MACD خالی سر سے کراس ہو تو ، خریدنے کا اشارہ پیدا کریں۔ جب فرق مثبت ہو ، اور کم سے زیادہ ہو ، اور MACD کثیر سر سے کراس ہو تو ، فروخت کا اشارہ پیدا کریں۔
EMA اوسط فرق اور MACD اشارے کا استعمال کرتے ہوئے سگنل کے مجموعہ کی طرف سے، کچھ جعلی سگنل کو فلٹر کر سکتے ہیں، سگنل کی وشوسنییتا کو بہتر بنانے کے لئے.
طاقت کا تجزیہ
- جامع اشارے کا استعمال، سگنل زیادہ قابل اعتماد
- مختصر مدت کے پیرامیٹرز کے ساتھ ترتیب دیا گیا ، جو مختصر لائن تجارت کے لئے موزوں ہے
- خطرے کو کنٹرول کرنے کے لئے نقصان اور روکنے کی ترتیبات
خطرے کا تجزیہ
- مارکیٹ میں شدید اتار چڑھاؤ کے دوران اسٹاپ نقصان کا خاتمہ کیا جاسکتا ہے
- مختلف مارکیٹ کے حالات کے مطابق پیرامیٹرز کو بہتر بنانے کی ضرورت ہے
- مختلف کرنسیوں اور مختلف ایکسچینجز کی جانچ کی ضرورت
اصلاح کی سمت
- ای ایم اے اور ایم اے سی ڈی کی پیرامیٹرز کو بہتر بنانا تاکہ وہ بی ٹی سی کے اتار چڑھاؤ والے ماحول کے مطابق ہوں
- ذخیرہ اندوزی اور ذخیرہ اندوزی کی حکمت عملی میں اضافہ ، فنڈز کے استعمال کی کارکردگی کو بہتر بنانا
- خطرے کو کم کرنے کے لئے نقصانات کو روکنے کے طریقوں کو شامل کریں، جیسے کہ حرکت پذیری نقصانات، کمپن نقصانات وغیرہ
- مختلف تبادلے اور کرنسیوں کی جانچ
خلاصہ کریں۔
اس حکمت عملی میں اوسط اور MACD دونوں اشارے کی خوبیوں کو مربوط کیا گیا ہے۔ اس میں ایک جامع سگنل استعمال کیا گیا ہے ، جس سے جعلی سگنل کو مؤثر طریقے سے فلٹر کیا جاسکتا ہے۔ پیرامیٹرز کو بہتر بنانے اور پوزیشن کھولنے کی حکمت عملی کے ذریعہ ، مستحکم منافع حاصل کیا جاسکتا ہے۔ تاہم ، اسٹاپ نقصانات کے خلاف خطرہ سے بھی آگاہ رہنے کی ضرورت ہے ، جس کی مزید جانچ اور بہتر بنانے کی ضرورت ہے۔
/*backtest
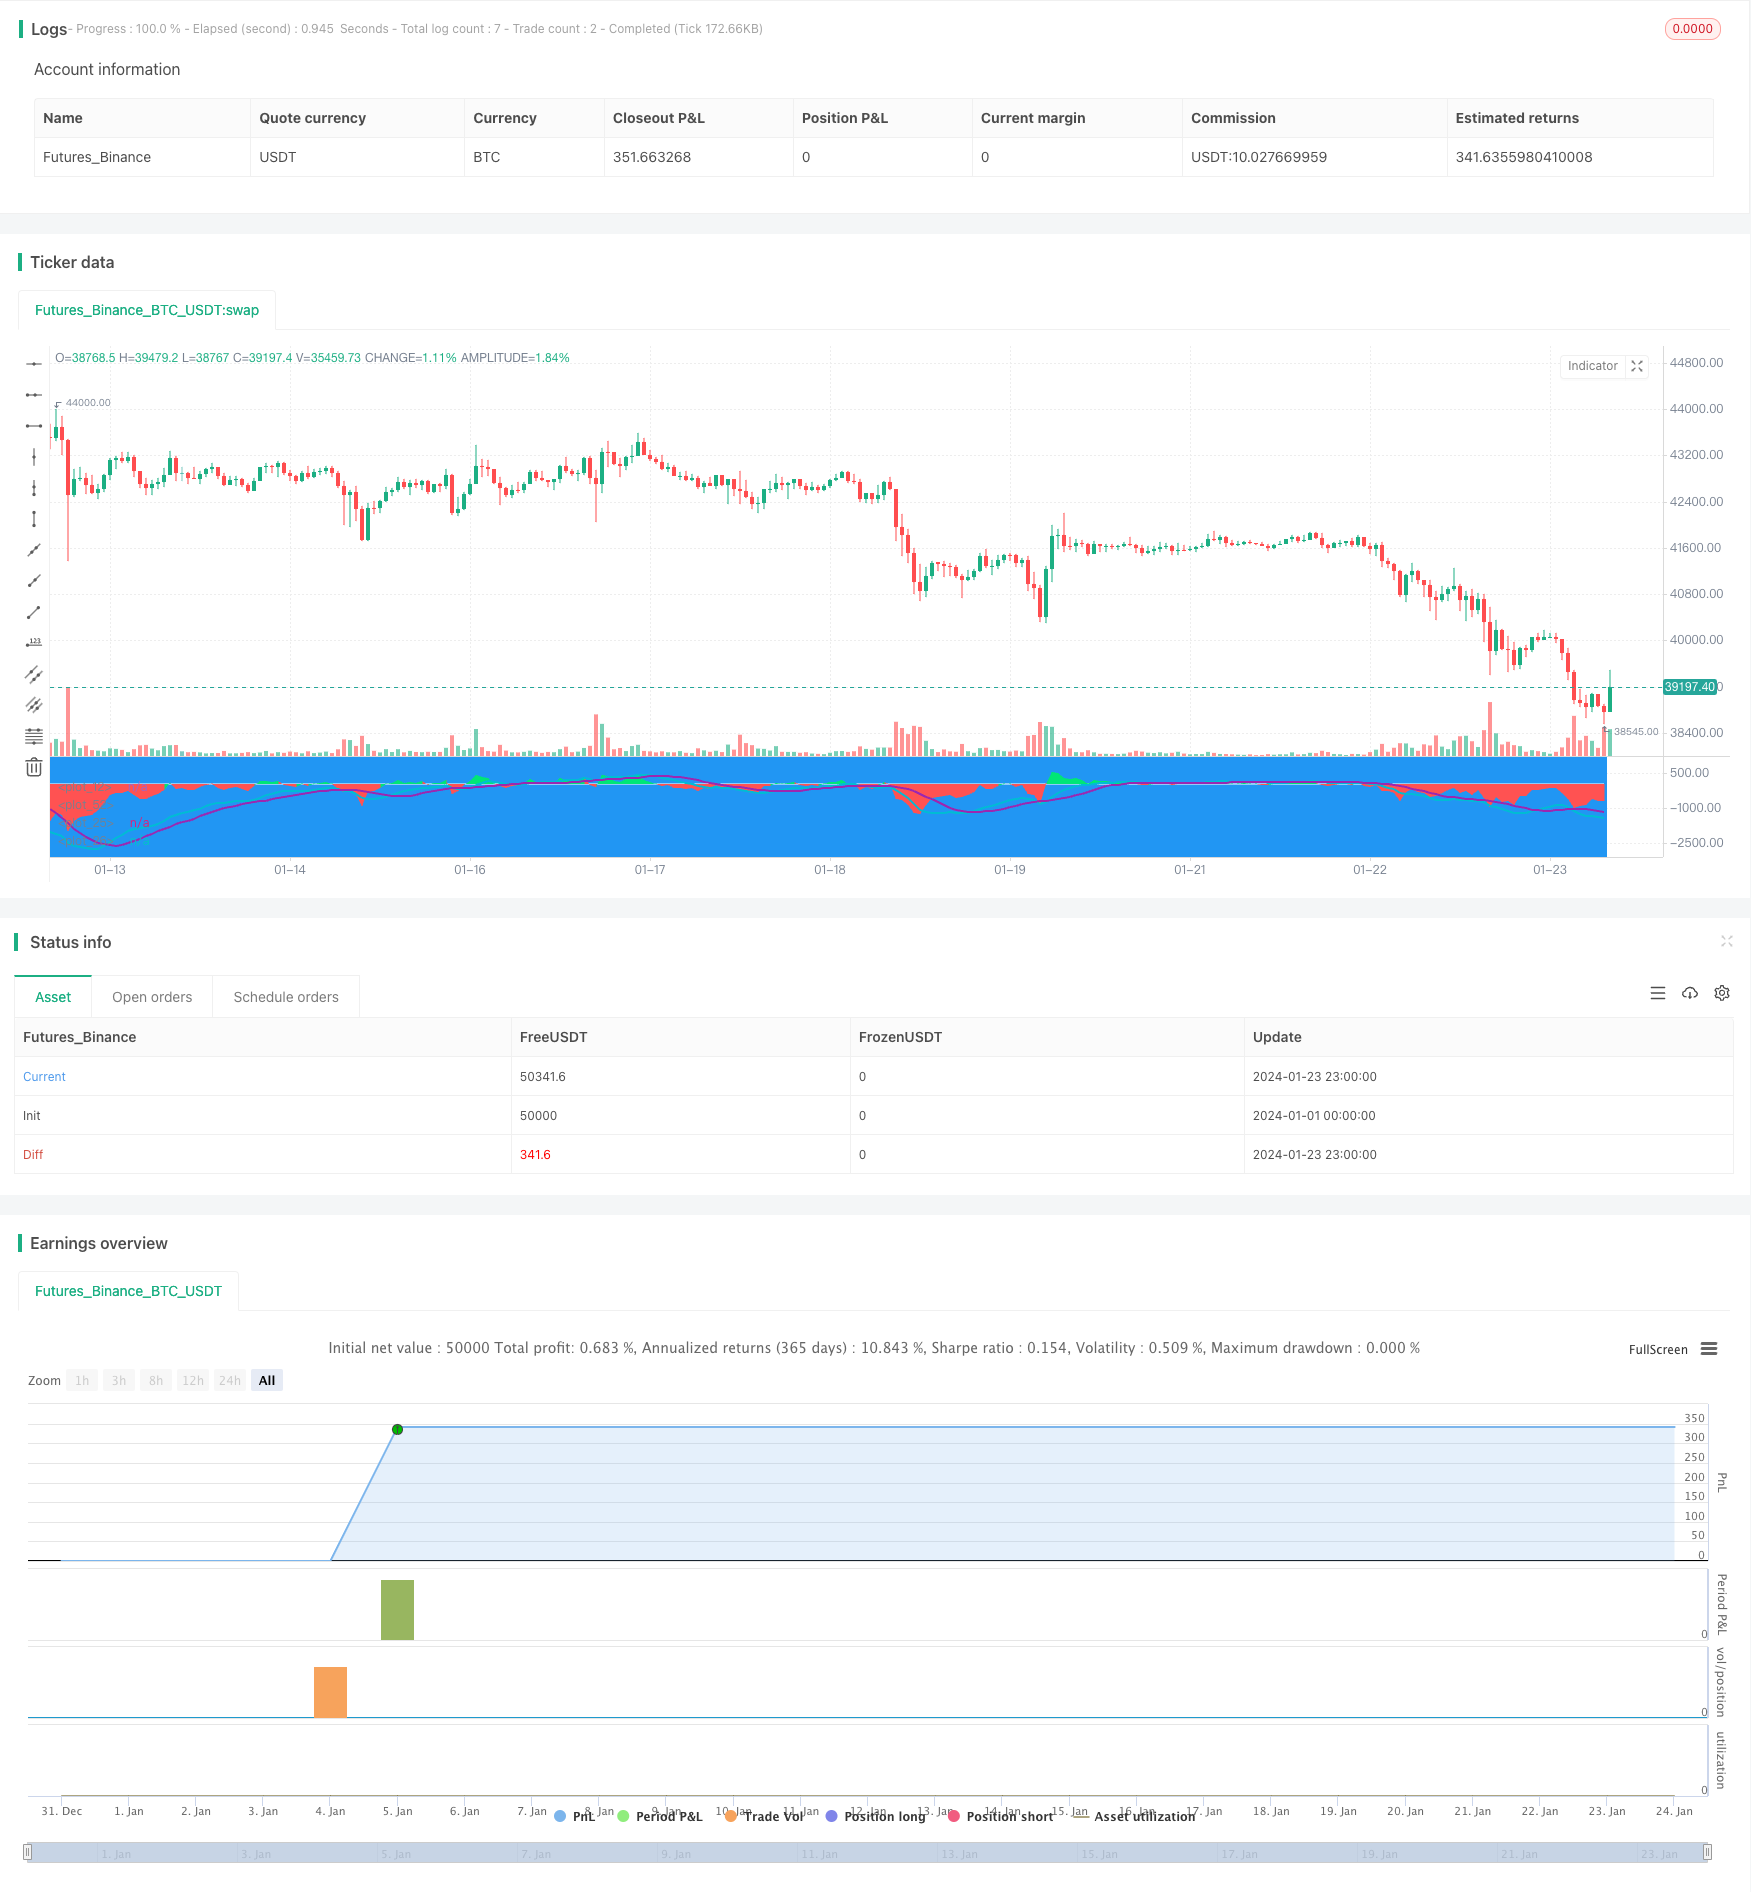
start: 2024-01-01 00:00:00
end: 2024-01-24 00:00:00
period: 1h
basePeriod: 15m
exchanges: [{"eid":"Futures_Binance","currency":"BTC_USDT"}]
*/
//@version=3
strategy("EMA50Diff & MACD Strategy", overlay=false)
EMA = input(18, step=1)
MACDfast = input(12)
MACDslow = input(26)
EMADiffThreshold = input(8)
MACDThreshold = input(80)
TargetValidityThreshold = input(65, step=5)
Target = input(120, step=5)
StopLoss = input(650, step=5)
ema = ema(close, EMA)
hl = plot(0, color=white, linewidth=1)
diff = close - ema
clr = color(blue, transp=100)
if diff>0
clr := lime
else
if diff<0
clr := red
fastMA = ema(close, MACDfast)
slowMA = ema(close, MACDslow)
macd = (fastMA - slowMA)*3
signal = sma(macd, 9)
plot(macd, color=aqua, linewidth=2)
plot(signal, color=purple, linewidth=2)
macdlong = macd<-MACDThreshold and signal<-MACDThreshold and crossover(macd, signal)
macdshort = macd>MACDThreshold and signal>MACDThreshold and crossunder(macd, signal)
position = 0.0
position := nz(strategy.position_size, 0.0)
long = (position < 0 and close < strategy.position_avg_price - TargetValidityThreshold and macdlong) or
(position == 0.0 and diff < -EMADiffThreshold and diff > diff[1] and diff[1] < diff[2] and macdlong)
short = (position > 0 and close > strategy.position_avg_price + TargetValidityThreshold and macdshort) or
(position == 0.0 and diff > EMADiffThreshold and diff < diff[1] and diff[1] > diff[2] and macdshort)
amount = (strategy.equity / close) //- ((strategy.equity / close / 10)%10)
bgclr = color(blue, transp=100) //#0c0c0c
if long
strategy.entry("long", strategy.long, amount)
bgclr := green
if short
strategy.entry("short", strategy.short, amount)
bgclr := maroon
bgcolor(bgclr, transp=20)
strategy.close("long", when=close>strategy.position_avg_price + Target)
strategy.close("short", when=close<strategy.position_avg_price - Target)
strategy.exit("STOPLOSS", "long", stop=strategy.position_avg_price - StopLoss)
strategy.exit("STOPLOSS", "short", stop=strategy.position_avg_price + StopLoss)
//plotshape(long, style=shape.labelup, location=location.bottom, color=green)
//plotshape(short, style=shape.labeldown, location=location.top, color=red)
pl = plot(diff, style=histogram, color=clr)
fill(hl, pl, color=clr)