کوبیرن اسٹریٹجی: مارکیٹ کنٹرول کے لیے انٹرسیکشن اسٹریٹجی
حکمت عملی کا جائزہ
کوبرن حکمت عملی ایک طاقتور تجارتی حکمت عملی ہے جو کیتھیر نے لکھی ہے۔ اس میں متعدد تجزیاتی تکنیکوں کو ملا کر ایک منفرد اور طاقتور تجارتی طریقہ کار تشکیل دیا گیا ہے۔ اس حکمت عملی کا نام دولت کے دیوتا کوبرن کے نام پر رکھا گیا ہے ، جو اس کے تاجروں کے پورٹ فولیو کو مالا مال کرنے کے اہداف کی علامت ہے۔
کوبرن صرف ایک حکمت عملی نہیں بلکہ ایک جامع تجارتی نظام ہے۔ یہ اعلی امکانات والے تجارتی مواقع کی نشاندہی کرنے کے لئے رجحان تجزیہ ، حرکیات کے اشارے اور حجم کے اشارے کو جوڑتا ہے۔ ان عناصر کے ہم آہنگی کا استعمال کرتے ہوئے ، کوبرن واضح داخلہ اور خارجی سگنل فراہم کرتا ہے ، جو مختلف سطحوں کے تاجروں کے لئے موزوں ہے۔
حکمت عملی کا اصول
کوبرین کی حکمت عملی کا مرکز کثیر اشارے کے تبادلوں کا اصول ہے۔ اس میں اشارے کا ایک انوکھا مجموعہ استعمال کیا گیا ہے جو شور اور غلط سگنل کو کم کرنے کے لئے ایک دوسرے کے ساتھ مل کر کام کرتے ہیں۔ خاص طور پر ، اس حکمت عملی میں درج ذیل کلیدی اجزاء استعمال کیے گئے ہیں:
- رجحان کی سمت کا تعین: موجودہ قیمت کی حمایت اور مزاحمت کی جگہوں کے ساتھ موازنہ کرکے موجودہ رجحان کی سمت کا تعین کریں۔
- سپورٹ اور مزاحمت کی پوزیشنیں: زگ زگ اشارے اور محور پوائنٹس کے ذریعہ اہم سپورٹ اور مزاحمت کی پوزیشنوں کی شناخت کریں۔
- انحراف کا فیصلہ: قیمتوں کے رجحانات اور حرکیات کے اشارے کا موازنہ کرکے ، فیصلہ کریں کہ آیا کوئی انحراف واقع ہوا ہے ، جس سے ممکنہ رجحان کا رخ موڑنے کا اشارہ ملتا ہے۔
- اتار چڑھاؤ کی شرح خود کو اپنانے: اے ٹی آر اشارے کے ذریعے متحرک طور پر اسٹاپ لسٹ کو ایڈجسٹ کریں تاکہ مارکیٹ کی مختلف اتار چڑھاؤ کی شرح کو ایڈجسٹ کیا جاسکے۔
- K لائن موڈ کا فیصلہ: مخصوص K لائن مجموعہ کے ذریعے رجحان اور الٹ سگنل کی تصدیق کریں۔
مندرجہ بالا عوامل کو مجموعی طور پر مدنظر رکھتے ہوئے ، کوبیران کی حکمت عملی مارکیٹ کے مختلف حالات میں خود کو ایڈجسٹ کرنے اور اعلی امکانات کے تجارتی مواقع کو پکڑنے کے قابل ہے۔
اسٹریٹجک فوائد
- کثیر اشارے کا تبادلہ: کوبرن حکمت عملی نے متعدد اشارے کے ہم آہنگی کا استعمال کیا ، جس سے سگنل کی وشوسنییتا میں بہتری آئی اور شور کی مداخلت میں کمی واقع ہوئی۔
- لچکدار: پیرامیٹرز کو متحرک طور پر ایڈجسٹ کرکے ، یہ حکمت عملی بدلتے ہوئے مارکیٹ کے ماحول کے مطابق ڈھال سکتی ہے اور اس کی ناکامی کا خطرہ نہیں ہے۔
- واضح سگنل: کوبرن واضح داخلہ اور باہر نکلنے کے سگنل فراہم کرتا ہے ، جس سے تجارت کے فیصلے کا عمل آسان ہوجاتا ہے۔
- مضبوط واپسی: اس حکمت عملی کو سخت تاریخی جانچ پڑتال کے بعد مارکیٹ کے مختلف حالات میں مضبوط کارکردگی کا مظاہرہ کیا گیا ہے۔
- وسیع پیمانے پر قابل اطلاق: کوبرن مختلف مارکیٹوں اور اقسام کے لئے موزوں ہے ، نہ کہ کسی خاص تجارتی نشان تک محدود۔
اسٹریٹجک رسک
- پیرامیٹر حساس: کوبیران کی حکمت عملی کی کارکردگی پیرامیٹر کے انتخاب کے لئے زیادہ حساس ہے ، اور غلط پیرامیٹرز کی وجہ سے کارکردگی میں کمی واقع ہوسکتی ہے۔
- حادثات: یہ حکمت عملی بنیادی طور پر تکنیکی سگنل پر مبنی ہے اور بنیادی حادثات کا جواب دینے کی محدود صلاحیت رکھتی ہے۔
- اوور فٹ ہونے کا خطرہ: اگر پیرامیٹرز کو بہتر بنانے کے دوران بہت زیادہ تاریخی اعداد و شمار پر غور کیا جائے تو ، حکمت عملی ماضی کے لئے زیادہ موزوں ہوسکتی ہے ، اور مستقبل کے حالات کے لئے اس کی موافقت میں کمی واقع ہوسکتی ہے۔
- لیوریج کا خطرہ: اگر زیادہ لیوریج کا استعمال کیا جاتا ہے تو ، بڑے پیمانے پر واپسی کا سامنا کرنے پر پوزیشن کا خطرہ ہوتا ہے۔
مذکورہ بالا خطرات کے لئے ، مناسب کنٹرول اقدامات جیسے پیرامیٹرز کو باقاعدگی سے ایڈجسٹ کرنا ، معقول نقصانات کا تعین کرنا ، اعتدال پسندی پر قابو پانا ، بنیادی تبدیلیوں پر توجہ دینا وغیرہ۔
اصلاح کی سمت
- مشین لرننگ کی اصلاح: حکمت عملی کے پیرامیٹرز کو متحرک طور پر بہتر بنانے اور موافقت کو بہتر بنانے کے لئے مشین لرننگ الگورتھم متعارف کرایا جاسکتا ہے۔
- بنیادی عوامل کو شامل کریں: تکنیکی سگنل کی ناکامیوں کا مقابلہ کرنے کے لئے بنیادی تجزیہ کو تجارتی فیصلوں میں شامل کرنے پر غور کریں۔
- پورٹ فولیو مینجمنٹ: فنڈ مینجمنٹ کی سطح پر ، کوبرن حکمت عملی کو اپنے پورٹ فولیو میں شامل کیا جاسکتا ہے ، تاکہ دیگر حکمت عملیوں کے ساتھ موثر طور پر بیعانہ بنایا جاسکے۔
- مارکیٹ کے حصوں کو بہتر بنانا: مختلف مارکیٹ کی اقسام کے لئے خصوصیات ، تخصیص شدہ اصلاحاتی حکمت عملی کے پیرامیٹرز۔
- ہائی فریکوئینسی ٹرانسفارمیشن: حکمت عملی کو ہائی فریکوئینسی ٹریڈنگ ورژن میں تبدیل کریں تاکہ زیادہ سے زیادہ مختصر لائن ٹریڈنگ کے مواقع کو پکڑ سکیں۔
خلاصہ کریں۔
کوبرن ایک طاقتور ، محفوظ اور قابل اعتماد تجارتی حکمت عملی ہے۔ اس میں متعدد تکنیکی تجزیاتی طریقوں کا ہوشیار امتزاج کیا گیا ہے۔ اس نے اشارے کے تبادلے کے اصول کے ذریعہ رجحانات کو پکڑنے اور موڑ کے مقامات کو پکڑنے میں بہت اچھا کام کیا ہے۔ اگرچہ کسی بھی حکمت عملی کو خطرہ لاحق ہے ، لیکن کوبرن نے بیک اپ میں اس کی استحکام کا ثبوت دیا ہے ، اور مناسب خطرے سے متعلق کنٹرول اور اصلاح کے اقدامات کے ساتھ ، اس بات پر یقین ہے کہ اس حکمت عملی سے تاجروں کو مارکیٹ کے کھیل میں برتری حاصل کرنے میں مدد مل سکتی ہے ، جس سے ان کے پورٹ فولیو کی طویل مدتی مستحکم ترقی ہوتی ہے۔
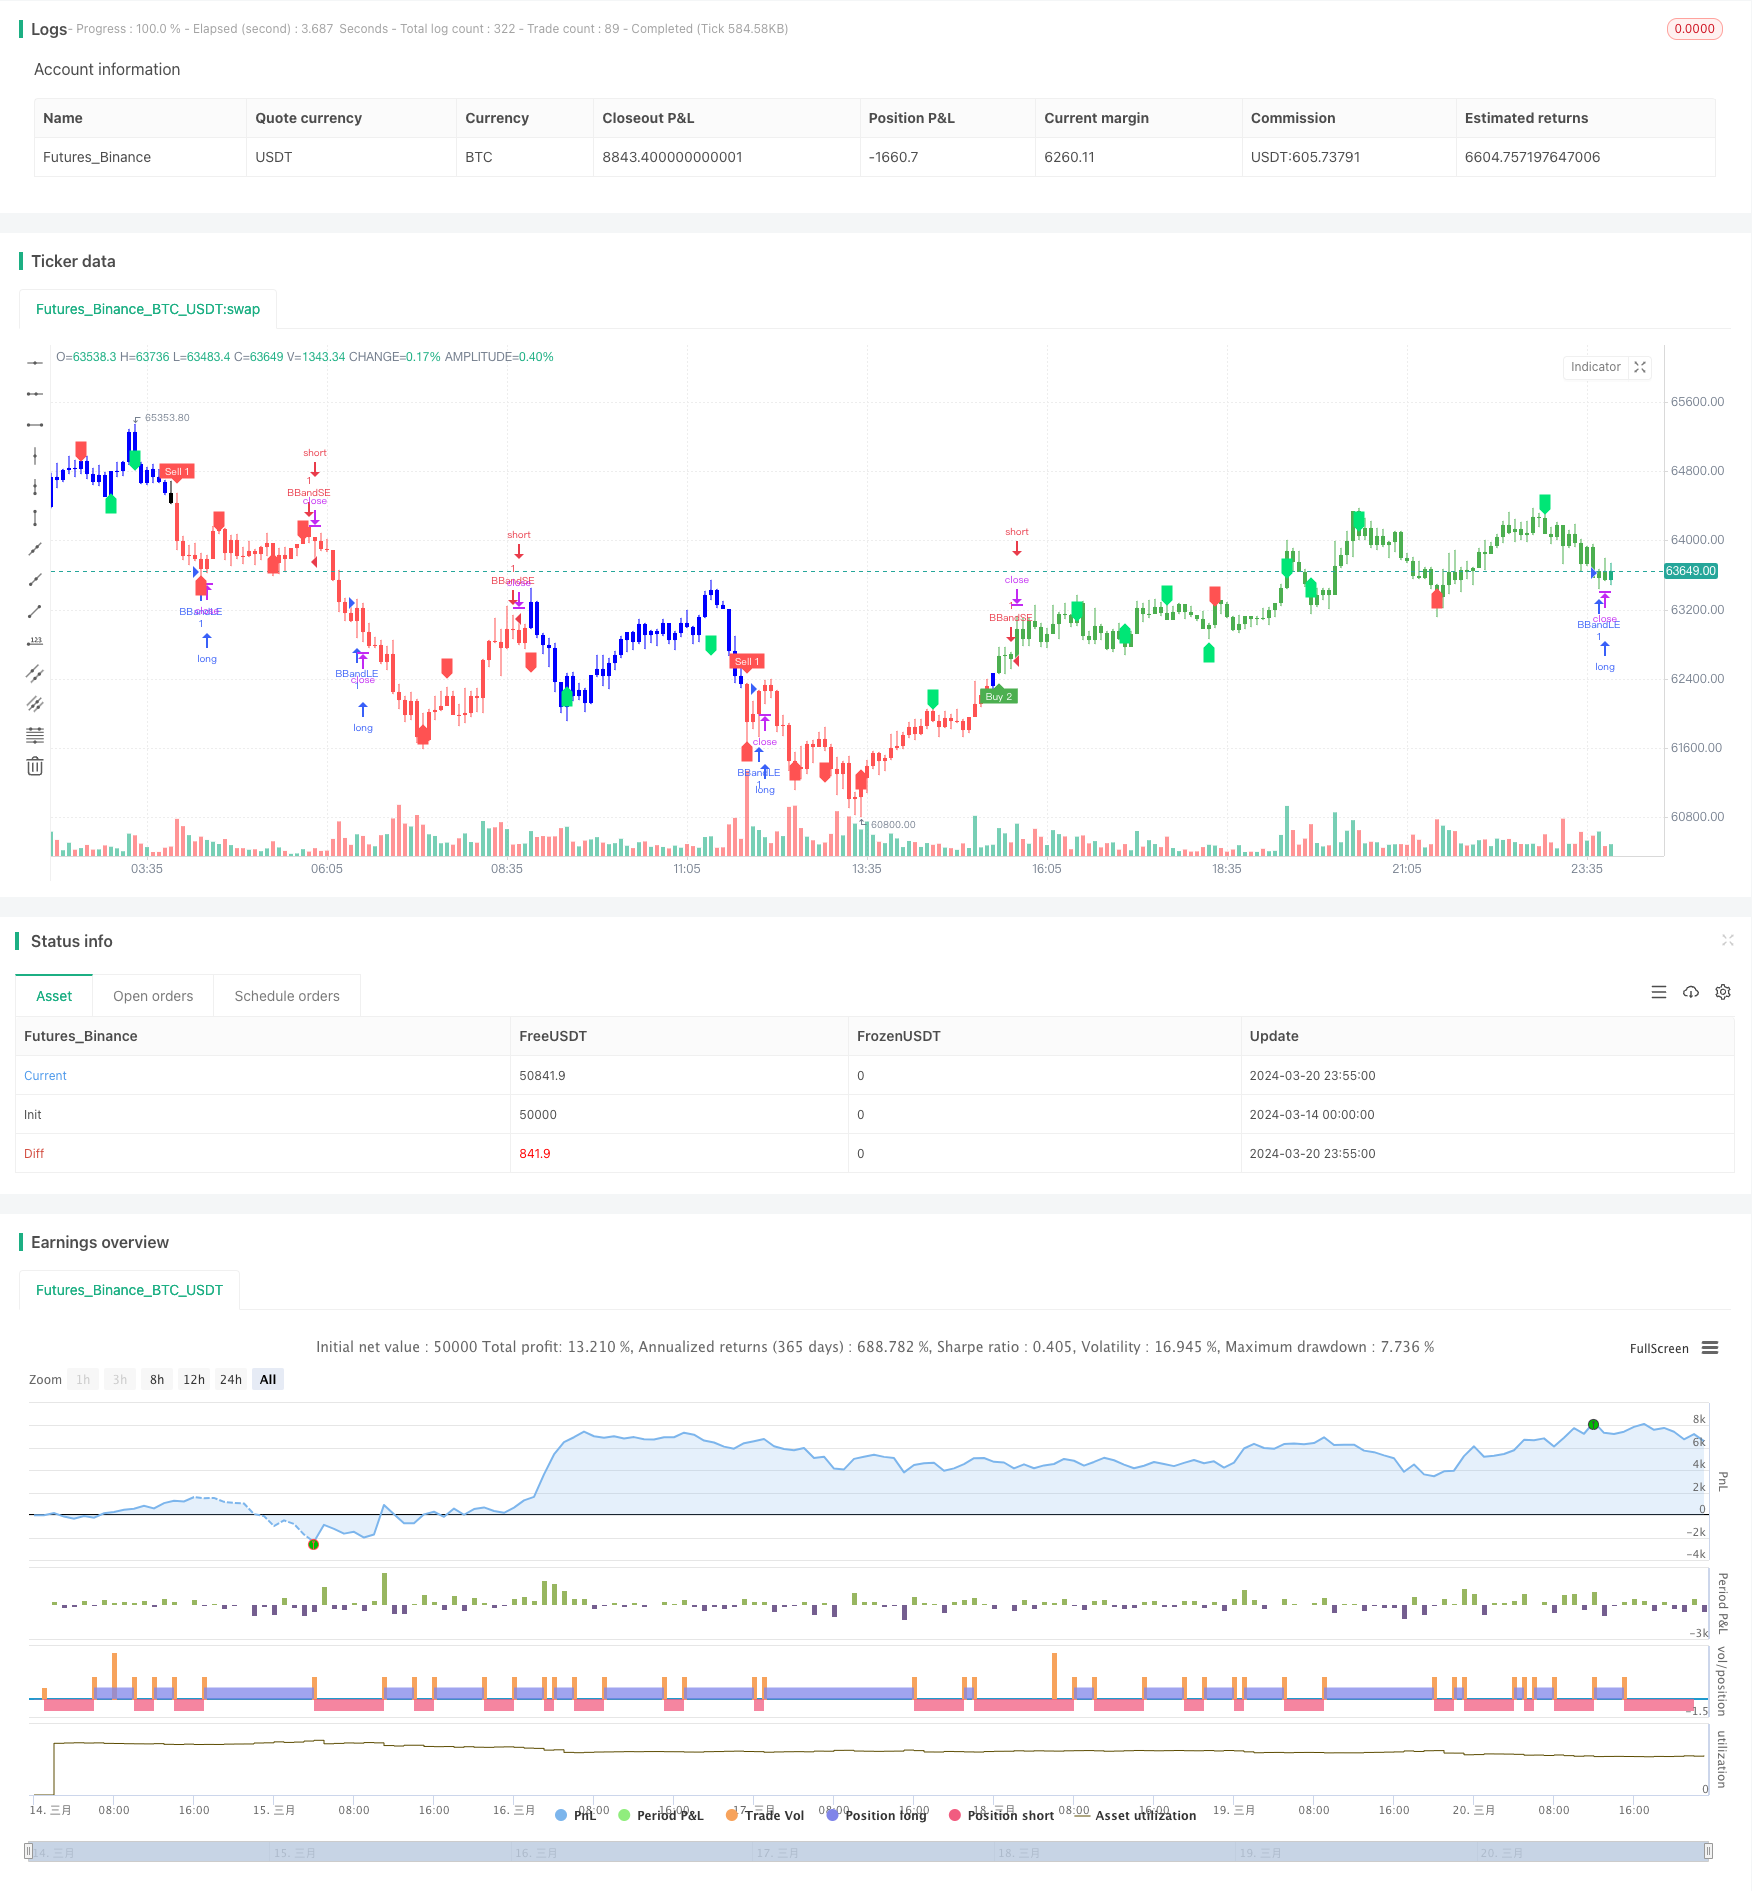
/*backtest
start: 2024-03-14 00:00:00
end: 2024-03-21 00:00:00
period: 5m
basePeriod: 1m
exchanges: [{"eid":"Futures_Binance","currency":"BTC_USDT"}]
*/

// This source code is subject to the terms of the Mozilla Public License 2.0 at https://mozilla.org/MPL/2.0/
// © LonesomeThecolor.blue
// This source code is subject to the terms of the Mozilla Public License 2.0 at https://mozilla.org/MPL/2.0/
// © LonesomeThecolor.blue

//@version=5
strategy('Kuberan*', overlay=true, max_lines_count=500)
lb = input.int(5, title='Left Bars', minval=1)
rb = input.int(5, title='Right Bars', minval=1)
showsupres = input.bool(false, title='Support/Resistance', inline='srcol')
supcol = input.color(color.lime, title='', inline='srcol')
rescol = input.color(color.red, title='', inline='srcol')
// srlinestyle = input(line.style_dotted, title='Line Style/Width', inline='style')
srlinewidth = input.int(3, title='', minval=1, maxval=5, inline='style')
changebarcol = input.bool(true, title='Change Bar Color', inline='bcol')
bcolup = input.color(color.blue, title='', inline='bcol')
bcoldn = input.color(color.black, title='', inline='bcol')

ph = ta.pivothigh(lb, rb)
pl = ta.pivotlow(lb, rb)

iff_1 = pl ? -1 : na  // Trend direction
hl = ph ? 1 : iff_1
iff_2 = pl ? pl : na  // similar to zigzag but may have multTLiple highs/lows
zz = ph ? ph : iff_2
valuewhen_1 = ta.valuewhen(hl, hl, 1)
valuewhen_2 = ta.valuewhen(zz, zz, 1)
zz := pl and hl == -1 and valuewhen_1 == -1 and pl > valuewhen_2 ? na : zz
valuewhen_3 = ta.valuewhen(hl, hl, 1)
valuewhen_4 = ta.valuewhen(zz, zz, 1)
zz := ph and hl == 1 and valuewhen_3 == 1 and ph < valuewhen_4 ? na : zz

valuewhen_5 = ta.valuewhen(hl, hl, 1)
valuewhen_6 = ta.valuewhen(zz, zz, 1)
hl := hl == -1 and valuewhen_5 == 1 and zz > valuewhen_6 ? na : hl
valuewhen_7 = ta.valuewhen(hl, hl, 1)
valuewhen_8 = ta.valuewhen(zz, zz, 1)
hl := hl == 1 and valuewhen_7 == -1 and zz < valuewhen_8 ? na : hl
zz := na(hl) ? na : zz

findprevious() =>  // finds previous three points (b, c, d, e)
    ehl = hl == 1 ? -1 : 1
    loc1 = 0.0
    loc2 = 0.0
    loc3 = 0.0
    loc4 = 0.0
    xx = 0
    for x = 1 to 1000 by 1
        if hl[x] == ehl and not na(zz[x])
            loc1 := zz[x]
            xx := x + 1
            break
    ehl := hl
    for x = xx to 1000 by 1
        if hl[x] == ehl and not na(zz[x])
            loc2 := zz[x]
            xx := x + 1
            break
    ehl := hl == 1 ? -1 : 1
    for x = xx to 1000 by 1
        if hl[x] == ehl and not na(zz[x])
            loc3 := zz[x]
            xx := x + 1
            break
    ehl := hl
    for x = xx to 1000 by 1
        if hl[x] == ehl and not na(zz[x])
            loc4 := zz[x]
            break
    [loc1, loc2, loc3, loc4]

float a = na
float b = na
float c = na
float d = na
float e = na
if not na(hl)
    [loc1, loc2, loc3, loc4] = findprevious()
    a := zz
    b := loc1
    c := loc2
    d := loc3
    e := loc4
    e

_hh = zz and a > b and a > c and c > b and c > d
_ll = zz and a < b and a < c and c < b and c < d
_hl = zz and (a >= c and b > c and b > d and d > c and d > e or a < b and a > c and b < d)
_lh = zz and (a <= c and b < c and b < d and d < c and d < e or a > b and a < c and b > d)

plotshape(_hl, title='Higher Low', style=shape.labelup, color=color.new(color.lime, 0), textcolor=color.new(color.black, 0), location=location.belowbar, offset=-rb)
plotshape(_hh, title='Higher High', style=shape.labeldown, color=color.new(color.lime, 0), textcolor=color.new(color.black, 0), location=location.abovebar, offset=-rb)
plotshape(_ll, title='Lower Low', style=shape.labelup, color=color.new(color.red, 0), textcolor=color.new(color.white, 0), location=location.belowbar, offset=-rb)
plotshape(_lh, title='Lower High', style=shape.labeldown, color=color.new(color.red, 0), textcolor=color.new(color.white, 0), location=location.abovebar, offset=-rb)

float res = na
float sup = na
res := _lh ? zz : res[1]
sup := _hl ? zz : sup[1]

int trend = na
iff_3 = close < sup ? -1 : nz(trend[1])
trend := close > res ? 1 : iff_3

res := trend == 1 and _hh or trend == -1 and _lh ? zz : res
sup := trend == 1 and _hl or trend == -1 and _ll ? zz : sup
rechange = res != res[1]
suchange = sup != sup[1]

var line resline = na
var line supline = na
if showsupres
    if rechange
        line.set_x2(resline, bar_index)
        line.set_extend(resline, extend=extend.none)
        resline := line.new(x1=bar_index - rb, y1=res, x2=bar_index, y2=res, color=rescol, extend=extend.right, style=line.style_dotted, width=srlinewidth)
        resline

    if suchange
        line.set_x2(supline, bar_index)
        line.set_extend(supline, extend=extend.none)
        supline := line.new(x1=bar_index - rb, y1=sup, x2=bar_index, y2=sup, color=supcol, extend=extend.right, style=line.style_dotted, width=srlinewidth)
        supline

iff_4 = trend == 1 ? bcolup : bcoldn
barcolor(color=changebarcol ? iff_4 : na)


// Inputs
A1 = input(5, title='Key Value. \'This changes the sensitivity\' for sell1')
C1 = input(400, title='ATR Period for sell1')
A2 = input(6, title='Key Value. \'This changes the sensitivity\' for buy2')
C2 = input(1, title='ATR Period for buy2')
h = input(false, title='Signals from Heikin Ashi Candles')

xATR1 = ta.atr(C1)
xATR2 = ta.atr(C2)
nLoss1 = A1 * xATR1
nLoss2 = A2 * xATR2

src = h ? request.security(ticker.heikinashi(syminfo.tickerid), timeframe.period, close, lookahead=barmerge.lookahead_off) : close

xATRTrailingStop1 = 0.0
iff_5 = src > nz(xATRTrailingStop1[1], 0) ? src - nLoss1 : src + nLoss1
iff_6 = src < nz(xATRTrailingStop1[1], 0) and src[1] < nz(xATRTrailingStop1[1], 0) ? math.min(nz(xATRTrailingStop1[1]), src + nLoss1) : iff_5
xATRTrailingStop1 := src > nz(xATRTrailingStop1[1], 0) and src[1] > nz(xATRTrailingStop1[1], 0) ? math.max(nz(xATRTrailingStop1[1]), src - nLoss1) : iff_6

xATRTrailingStop2 = 0.0
iff_7 = src > nz(xATRTrailingStop2[1], 0) ? src - nLoss2 : src + nLoss2
iff_8 = src < nz(xATRTrailingStop2[1], 0) and src[1] < nz(xATRTrailingStop2[1], 0) ? math.min(nz(xATRTrailingStop2[1]), src + nLoss2) : iff_7
xATRTrailingStop2 := src > nz(xATRTrailingStop2[1], 0) and src[1] > nz(xATRTrailingStop2[1], 0) ? math.max(nz(xATRTrailingStop2[1]), src - nLoss2) : iff_8

pos1 = 0
iff_9 = src[1] > nz(xATRTrailingStop1[1], 0) and src < nz(xATRTrailingStop1[1], 0) ? -1 : nz(pos1[1], 0)
pos1 := src[1] < nz(xATRTrailingStop1[1], 0) and src > nz(xATRTrailingStop1[1], 0) ? 1 : iff_9

pos2 = 0
iff_10 = src[1] > nz(xATRTrailingStop2[1], 0) and src < nz(xATRTrailingStop2[1], 0) ? -1 : nz(pos2[1], 0)
pos2 := src[1] < nz(xATRTrailingStop2[1], 0) and src > nz(xATRTrailingStop2[1], 0) ? 1 : iff_10

xcolor1 = pos1 == -1 ? color.red : pos1 == 1 ? color.green : color.blue
xcolor2 = pos2 == -1 ? color.red : pos2 == 1 ? color.green : color.blue

ema1 = ta.ema(src, 1)
ema2 = ta.ema(src, 1)
above1 = ta.crossover(ema1, xATRTrailingStop1)
below1 = ta.crossover(xATRTrailingStop1, ema1)
above2 = ta.crossover(ema2, xATRTrailingStop2)
below2 = ta.crossover(xATRTrailingStop2, ema2)

buy1 = src > xATRTrailingStop1 and above1
sell1 = src < xATRTrailingStop1 and below1
buy2 = src > xATRTrailingStop2 and above2
sell2 = src < xATRTrailingStop2 and below2

barbuy1 = src > xATRTrailingStop1
barsell1 = src < xATRTrailingStop1
barbuy2 = src > xATRTrailingStop2
barsell2 = src < xATRTrailingStop2

// plotshape(buy1, title="Buy 1", text='Buy 1', style=shape.labelup, location=location.belowbar, color=color.green, textcolor=color.white, transp=0, size=size.tiny)
plotshape(sell1, title='Sell 1', text='Sell 1', style=shape.labeldown, location=location.abovebar, color=color.new(color.red, 0), textcolor=color.new(color.white, 0), size=size.tiny)
plotshape(buy2, title='Buy 2', text='Buy 2', style=shape.labelup, location=location.belowbar, color=color.new(color.green, 0), textcolor=color.new(color.white, 0), size=size.tiny)
// plotshape(sell2, title="Sell 2", text='Sell 2', style=shape.labeldown, location=location.abovebar, color=color.red, textcolor=color.white, transp=0, size=size.tiny)

// barcolor(barbuy1 ? color.green : na)
barcolor(barsell1 ? color.red : na)
barcolor(barbuy2 ? color.green : na)
// barcolor(barsell2 ? color.red : na)

// alertcondition(buy1, "UT Long 1", "UT Long 1")
alertcondition(sell1, 'UT Short 1', 'UT Short 1')
alertcondition(buy2, 'UT Long 2', 'UT Long 2')

// strategy.entry('long', strategy.long, when=buy2)
source = close
length = input.int(20, minval=1)
mult = input.float(2.0, minval=0.001, maxval=50)
basis = ta.sma(source, length)
dev = mult * ta.stdev(source, length)
upper = basis + dev
lower = basis - dev
buyEntry = ta.crossover(source, lower)
sellEntry = ta.crossunder(source, upper)
if (ta.crossover(source, lower) )
	strategy.entry("BBandLE", strategy.long, stop=lower, oca_name="BollingerBands",  comment="BBandLE")
else
	strategy.cancel(id="BBandLE")
if (ta.crossunder(source, upper))
	strategy.entry("BBandSE", strategy.short, stop=upper, oca_name="BollingerBands",comment="BBandSE")
else
	strategy.cancel(id="BBandSE")
//plot(strategy.equity, title="equity", color=color.red, linewidth=2, style=plot.style_areabr)

lengthTL = input.int(14, 'Swing Detection Lookback')
multTL = input.float(1., 'Slope', minval = 0, step = .1)
calcMethod = input.string('Atr', 'Slope Calculation Method', options = ['Atr','Stdev','Linreg'])
backpaint = input(true, tooltip = 'Backpainting offset displayed elements in the past. Disable backpainting to see real time information returned by the indicator.')

//Style
upCss = input.color(color.teal, 'Up Trendline Color', group = 'Style')
dnCss = input.color(color.red, 'Down Trendline Color', group = 'Style')
showExt = input(true, 'Show Extended Lines')

//-----------------------------------------------------------------------------}
//Calculations
//-----------------------------------------------------------------------------{
var upperTL = 0.
var lowerTL = 0.
var slope_phTL = 0.
var slope_plTL = 0.

var offset = backpaint ? lengthTL : 0

n = bar_index
srcTL = close

phTL = ta.pivothigh(lengthTL, lengthTL)
plTL = ta.pivotlow(lengthTL, lengthTL)

//Slope Calculation Method
slope = switch calcMethod
    'Atr'    => ta.atr(lengthTL) / lengthTL * multTL
    'Stdev'  => ta.stdev(srcTL,lengthTL) / lengthTL * multTL
    'Linreg' => math.abs(ta.sma(srcTL * n, lengthTL) - ta.sma(srcTL, lengthTL) * ta.sma(n, lengthTL)) / ta.variance(n, lengthTL) / 2 * multTL

//Get slopes and calculate trendlines
slope_phTL := phTL ? slope : slope_phTL
slope_plTL := plTL ? slope : slope_plTL

upperTL := phTL ? phTL : upperTL - slope_phTL
lowerTL := pl ? pl : lowerTL + slope_plTL

var upos = 0
var dnos = 0
upos := phTL ? 0 : close > upperTL - slope_phTL * lengthTL ? 1 : upos
dnos := pl ? 0 : close < lowerTL + slope_plTL * lengthTL ? 1 : dnos