TrendScalp-FractalBox-3EMA
Tác giả:ChaoZhang, Ngày: 2022-05-23 11:45:02Tags:EMA
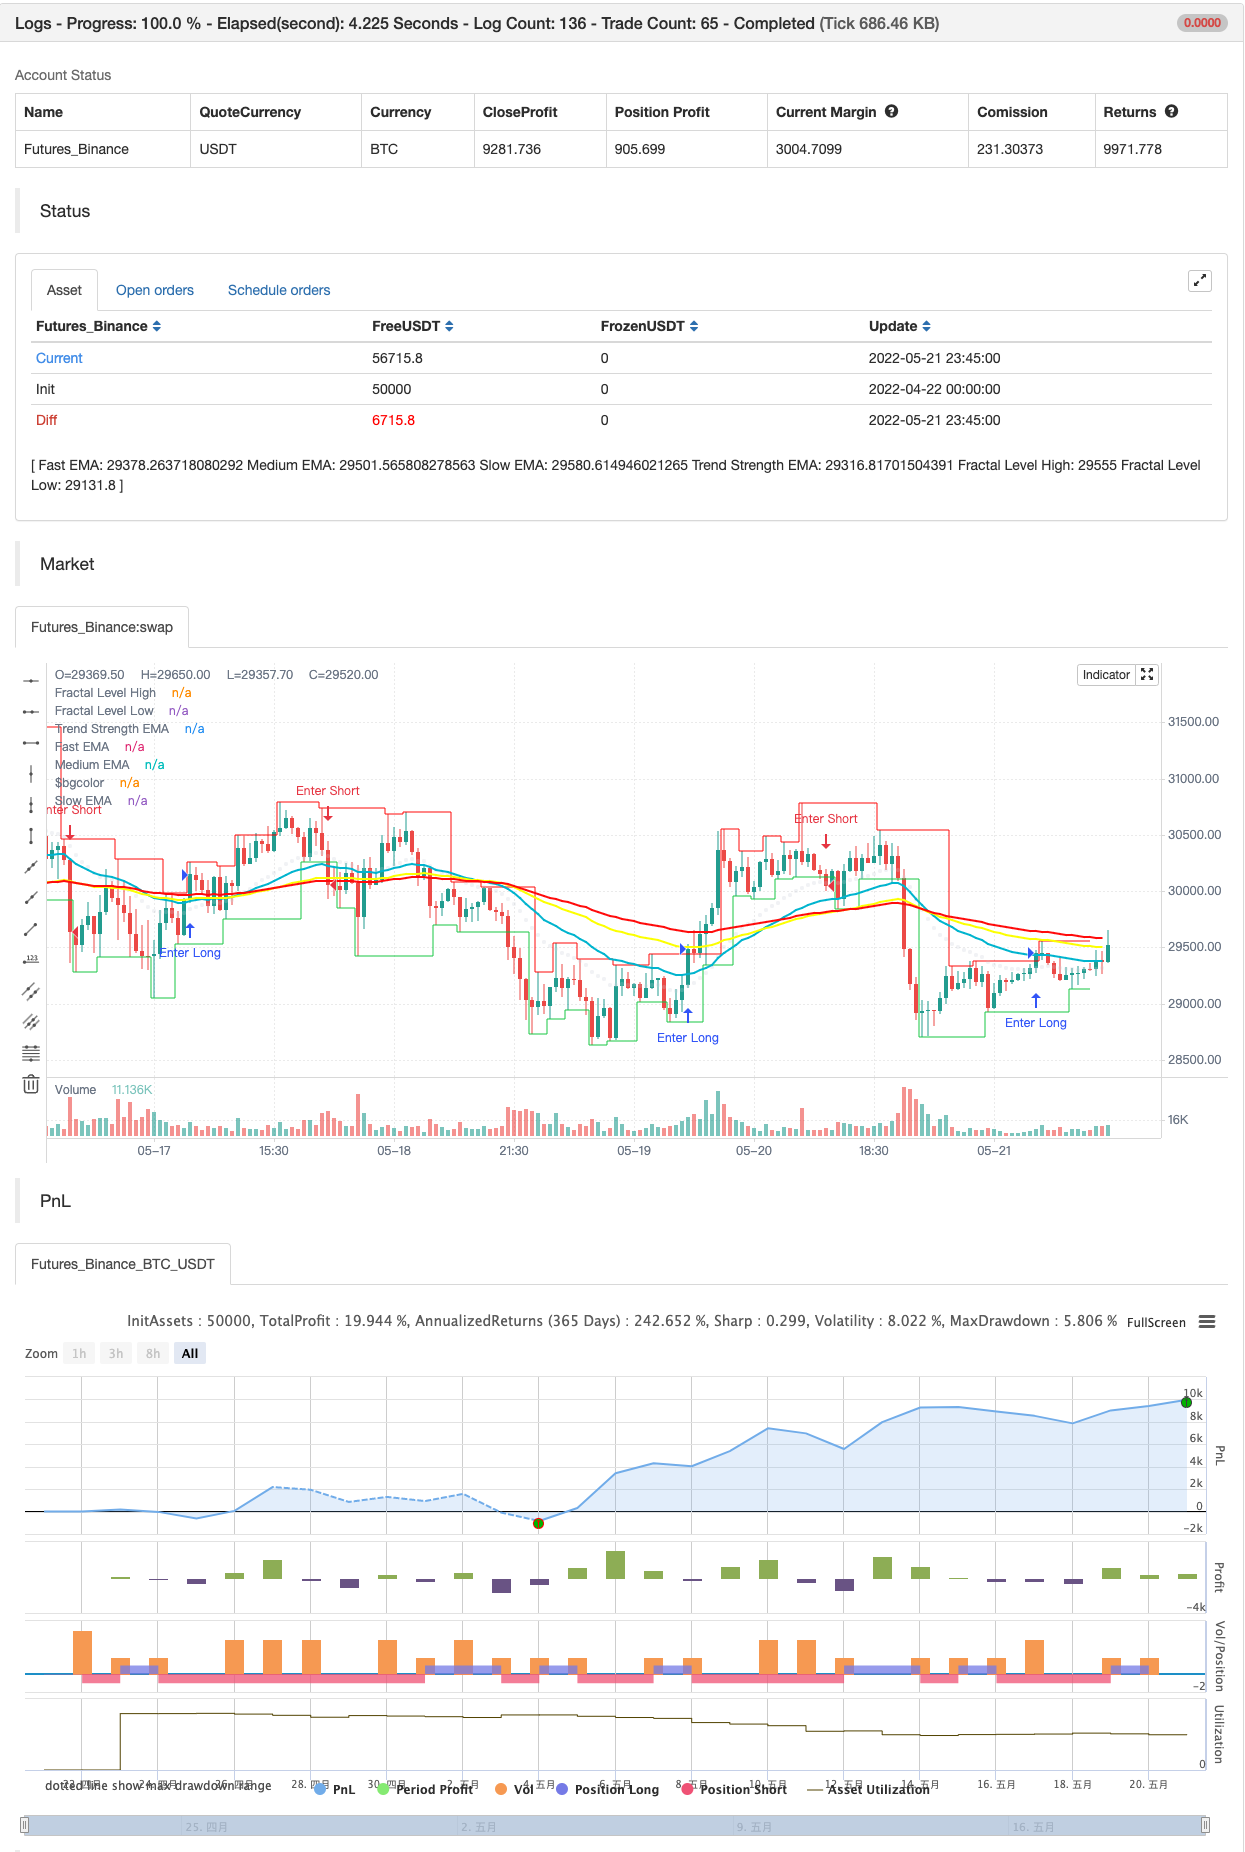
Có rất nhiều chỉ số với Fractal và Alligator của William. Vì nhiều người sử dụng EMA, nó có thể hữu ích để xác định một ruy băng 3-EMA và kết hợp Fractal Levels / Box (đóng nền giữa fractals trên và dưới) cho việc đánh giá xu hướng. Tôi đã tìm kiếm loại chỉ số này trong cộng đồng
Điểm chính:
EMA ribbon được tạo ra bằng cách sử dụng 3 EMA 35/70/105. Người dùng có thể thay đổi chúng theo sở thích của họ. Điều này được sử dụng để xác định xu hướng.
Hình nền được đánh dấu khi vượt qua EMA1 và EMA2 để cảnh báo về sự thay đổi xu hướng có thể xảy ra.
Các fractal 5 bar được sử dụng để đánh dấu các mức fractal và nền giữa các fractal trên và dưới được lấp đầy để tạo ra một hộp fractal.
Các mức fractal chỉ được đánh dấu khi sự hình thành fractal hoàn tất.
Cách sử dụng:
Dải EMA nghiêng được sử dụng để xác định xu hướng.
Phân hỏng hộp fractal được sử dụng để kích hoạt giao dịch với mức cao / thấp fractal để vào / SL. Chờ cho sự co lại giá hướng tới ruột EMA dẫn đến các hộp nhỏ hơn là chìa khóa để bắt đầu giao dịch. Tránh các hộp lớn hơn vì SL
DISCLAIMER: Chỉ số này được tạo ra chỉ để tham khảo giáo dục và không tạo thành lời khuyên đầu tư. Chỉ số này không nên được dựa vào như là một sự thay thế cho nghiên cứu thị trường độc lập rộng rãi trước khi đưa ra quyết định giao dịch thực tế của bạn. Dữ liệu thị trường hoặc bất kỳ nội dung nào khác có thể thay đổi bất cứ lúc nào mà không cần thông báo. Trách nhiệm đối với bất kỳ tổn thất hoặc thiệt hại nào, bao gồm không giới hạn bất kỳ mất lợi nhuận nào, có thể phát sinh trực tiếp hoặc gián tiếp từ việc sử dụng chỉ số này là trách nhiệm của người dùng sử dụng nó.
backtest
/*backtest
start: 2022-04-22 00:00:00
end: 2022-05-21 23:59:00
period: 45m
basePeriod: 5m
exchanges: [{"eid":"Futures_Binance","currency":"BTC_USDT"}]
*/

//@version=5

indicator('[VDB]TrendScalp-FractalBox-3EMA', shorttitle='[VDB]TS-FB-3EMA', overlay=true, max_lines_count=500)

// By: ©vireshdb/vdb/vdb007
//
//Description:
//          There are many indicators with William’s Fractal and Alligator. As many use EMA’s it may be useful to define an EMA ribbon and
//          combining Fractal levels/box (filling background between top and bottom fractals) for trend scalping. I searched for this kind of indicator in community – some show fractals,
//          some just levels, some with alligator etc.but couldn't find the one needed. Hence thought of this indicator which may be of interest to other users too.
//Key Points:
//          EMA ribbon is created using3 EMA’s 35/70/105. Users can change these as per their preference. This is used for trend identification –
//              1. Bullish bias if Price > EMA1 > EMA2 > EMA3. 2. Bearish bias if Price < EMA1 < EMA2 < EMA3.
//          Background is marked during crossing of EMA1 and EMA2 to alert possible change in trend.
//          5-bar fractals are used to mark the Fractal levels and backgrounds between top and bottom fractals are filled to create the Fractal Box.
//          Fractal levels are marked with offset 2 only when the fractal formation is complete and hence are lagging.
//How to Use:
//          Sloping EMA ribbon is used for identifying the trend.
//          Trend strength ema is enabled. Angle of 30degree and above is strength
//          Fractal box break-out/ break-downs are used to trigger the trade with fractal high/low for entry/stoploss.
//              - Waiting for price contraction towards EMA ribbon resulting in smaller boxes is key to initiate trade.
//              - Avoid bigger boxes as SL’s will be big and price may move within.
//              - To draw the vertical lines of FractalBox change fractal level0 style to stepline.
//          This indicator -
//              - Combined with the cycle/ banded indicators such as CCI/Stochastic/RSI etc can make it a good trend scalping setup
//              - While trading in the direction of momentum in higher timeframe.
// Reference : This indicator was achieved by combing some fractal ideas from "Fractal Framer by brobear"
//
// Copyright 2022 vireshdb
//
// This program is free software: you can redistribute it and/or modify
// it under the terms of the GNU General Public License as published by
// the Free Software Foundation, either version 3 of the License, or
// any later version.
//
// This program is distributed in the hope that it will be useful,
// but WITHOUT ANY WARRANTY; without even the implied warranty of
// MERCHANTABILITY or FITNESS FOR A PARTICULAR PURPOSE.  See the
// GNU General Public License for more details.
//
// The GNU General Public License can be found here
// <http://www.gnu.org/licenses/>.
//
// Start of code *************************************************************************************************

showema = input.bool(true, title='Show EMA Ribbon')
fastema = input.int(35, title='Fast EMA', minval=1)
medema = input.int(70, title='Medium EMA', minval=1)
slowema = input.int(105, title='Slow EMA', minval=1)
trstrema = input.int(20, title='Trend Strength EMA', minval=1)
EMA1 = ta.ema(close, fastema)
EMA2 = ta.ema(close, medema)
EMA3 = ta.ema(close, slowema)
TSEMA = ta.ema(close, trstrema)

plot(showema and fastema ? EMA1 : na, title='Fast EMA', color=color.new(#00bcd4, 0), linewidth=2)
plot(showema and medema ? EMA2 : na, title='Medium EMA', color=color.new(#fcff00, 0), linewidth=2)
plot(showema and slowema ? EMA3 : na, title='Slow EMA', color=color.new(#ff0909, 0), linewidth=2)
plot(showema and trstrema ? TSEMA : na, title='Trend Strength EMA', color=color.new(#d1d4dc, 75), linewidth=1, style=plot.style_circles)

bgcolor(color=ta.crossover(EMA1, EMA2) ? color.new(color.lime, 90) : ta.crossunder(EMA1, EMA2) ? color.new(color.red, 90) : na, title='Trend Marker')

// FRACTAL Levels and Box *******************************************************************************************
PlotFractLevel = input(defval=true, title='Show Fractal Levels and Box')
lnwidth = input.int(defval=1, title='Fractal Line Width', minval=1, maxval=3)

//----- Main ---------------------
fractLevelHigh = float(na)
fractLevelLow = float(na)
fractHigh = bool(na)
fractLow = bool(na)
lag = 0
lag := 2
fractHigh := high[4] <= high[2] and high[3] <= high[2] and high[2] > high[1] and high[2] > high ? true : false
fractLow := low[4] >= low[2] and low[3] >= low[2] and low[2] < low[1] and low[2] < low ? true : false

// Fractal levels
fractLevelHigh := fractHigh ? nz(high[lag], high) : nz(fractLevelHigh[1], high)
fractLevelLow := fractLow ? nz(low[lag], low) : nz(fractLevelLow[1], low)

//---- Plotting Fractal levels ---------------------
p1 = plot(PlotFractLevel ? fractLevelHigh : na, title='Fractal Level High', color=color.new(#ff0909, 0), linewidth=lnwidth, offset=-lag, style=plot.style_stepline)
p2 = plot(PlotFractLevel ? fractLevelLow : na, title='Fractal Level Low', color=color.new(#1bce4e, 0), linewidth=lnwidth, offset=-lag, style=plot.style_stepline)
fill(p1, p2, title='Fill Fractal Box', color=fractLevelHigh >= fractLevelLow ? color.new(#d1d4dc,90) : color.new(#fff59d, 90))

// Alert conditions
alertcondition(close > nz(fractLevelHigh, high), title='Above Fractal Level High', message='Fractal High Breakout')
alertcondition(close < nz(fractLevelLow, low), title='Below Fractal Level Low', message='Fractal Low Breakdown')

// End of FRACTAL Levels and Box ****************************************************************************************
// End of code***********************************************************************************************************

if close > nz(fractLevelHigh, high)
    strategy.entry("Enter Long", strategy.long)
else if close < nz(fractLevelLow, low)
    strategy.entry("Enter Short", strategy.short)
- Chiến lược giao dịch dựa trên các đường chéo vàng và chết MACD liên tiếp
- Chiến lược giao dịch RSI Bollinger Bands nâng cao
- Chiến lược chuyển đổi EMA ba lần
- Chiến lược đòn bẩy chéo trung bình chuyển động theo cấp số nhân
- GM-8 & ADX Chiến lược trung bình di chuyển kép
- Chiến lược chéo EMA tăng cường với RSI/MACD/ATR
- Xu hướng Z-Score theo chiến lược
- Mức đầu tư dài trên EMA với chiến lược quản lý rủi ro
- Chiến lược giao dịch VWAP
- WaveTrend Cross LazyBear Chiến lược
- Chiến lược giao dịch AlphaTradingBot
- MACD Reloaded STRATEGY
- Đường trung bình di chuyển siêu xu hướng
- Giao dịch ABC
- 15MIN BTCUSDTPERP BOT
- Shannon Entropy V2
- SUPERTREND ATR WITH TRAILING STOP LOSS
- Dòng lưu lượng v3
- tương lai tiền điện tử scalping hàng giờ với ma & rsi - ogcheckers
- ATR được làm mịn
- Order Block Finder
- Các tín hiệu QQE
- Lưu ý:
- CM MACD Chỉ số tùy chỉnh - Khung thời gian đa - V2
- HODL LINE
- 2 Phát hiện hướng màu trung bình chuyển động
- Scalping PullBack Tool R1
- Chiến lược mua&bán phụ thuộc vào AO+Stoch+RSI+ATR
- EMA TREND CLOUD
- Tỷ lệ năng lượng hướng tăng tốc theo khối lượng RedK
- Donchian Breakout không sơn lại