Chiến lược Super Trend V

Tổng quan
Chiến lược siêu xu hướng V là một chiến lược giao dịch đường ngắn dựa trên đường trung bình di chuyển và chênh lệch chuẩn. Nó sử dụng chỉ số Super Trend để xác định hướng xu hướng của giá, kết hợp với hỗ trợ và kháng cự hình thành từ đường trung bình di chuyển để nhập vào. Đồng thời, nó sử dụng kênh chênh lệch chuẩn để dự đoán vùng hỗ trợ và kháng cự tiềm ẩn của giá, thiết lập khoảng giá dừng lỗ, thực hiện theo xu hướng và chiến lược giao dịch đường ngắn hiệu quả thoát ra.
Nguyên tắc chiến lược
Chiến lược này đầu tiên tính toán chỉ số Super Trend, chỉ số Super Trend sử dụng ATR và mối quan hệ của giá để xác định xu hướng. Giá là lạc quan khi giá cao hơn xu hướng tăng và giảm khi giá thấp hơn xu hướng giảm.
Sau đó, tính toán EMA di chuyển trung bình của giá và EMA di chuyển trung bình của giá mở, khi giá trên đường trung bình di chuyển và cao hơn đường trung bình mở là tín hiệu mua, khi giá dưới đường trung bình di chuyển và thấp hơn đường trung bình mở là tín hiệu bán.
Sau đó, sử dụng chênh lệch tiêu chuẩn để tính toán đường dẫn giá lên và xuống, và xử lý trơn tru, dấu hiệu dừng khi giá vượt qua chênh lệch tiêu chuẩn và dấu hiệu dừng khi giá vượt qua chênh lệch tiêu chuẩn.
Cuối cùng, kết hợp các trung bình di chuyển trong các khoảng thời gian khác nhau để đánh giá xu hướng, kết hợp với chỉ số Super Trend để tạo ra một phán đoán xu hướng ổn định.
Lợi thế chiến lược
- Sử dụng chỉ số Super Trend để xác định xu hướng giá, tránh biến động xu hướng gây thiệt hại
- Trung bình di chuyển kết hợp với giá mở cửa giúp xác định thời gian nhập cảnh, tránh phá vỡ giả
- Đường phân biệt chuẩn dự đoán giá tiềm năng hỗ trợ và vùng kháng cự, thiết lập giá dừng lỗ
- Nhiều chu kỳ thời gian kết hợp với định hướng xu hướng, tăng sự ổn định
Rủi ro chiến lược
- Chỉ số Super Trend bị tụt hậu, có thể bỏ qua điểm chuyển hướng
- Đường trung bình di chuyển tạo ra tín hiệu chéo có sự chậm trễ, thời gian nhập cảnh không đúng
- Phương thức phân chênh lệch tiêu chuẩn quá cố định và không thể phản ánh biến động thị trường trong thời gian thực
- Nhiều thời kỳ có thể gây ra xung đột.
Phương pháp giải quyết rủi ro:
- Tóm tắt các tham số Super Trend để tăng độ nhạy
- Tối ưu hóa chu kỳ trung bình di chuyển, hoặc thêm các chỉ số khác để đánh giá nhập cảnh
- Động thái điều chỉnh các tham số đường phân cách tiêu chuẩn để phù hợp với thị trường
- Xác định rõ ràng logic phán đoán đa chu kỳ, xử lý xung đột có thể
Hướng tối ưu hóa chiến lược
- Tối ưu hóa các tham số Super Trend để tìm các tham số kết hợp tốt nhất
- Thử các chỉ số khác kết hợp với trung bình di chuyển để xác định thời gian nhập cảnh
- Cố gắng điều chỉnh động các tham số kênh chênh lệch chuẩn
- Kiểm tra các kết hợp đa chu kỳ khác nhau để tìm chu kỳ phù hợp nhất
- Tối ưu hóa chiến lược dừng lỗ để tăng cơ hội chiến lược
Tóm tắt
Chiến lược siêu xu hướng V tích hợp các lợi thế của các chỉ số như xu hướng, đường trung bình và đường chênh lệch tiêu chuẩn, thực hiện định hướng xu hướng ổn định, chọn thời gian nhập cảnh phù hợp và thiết lập chiến lược giao dịch đường ngắn của dừng lỗ trong khu vực giá. Bằng cách tối ưu hóa tham số, tối ưu hóa chỉ số, tối ưu hóa dừng lỗ, cải tiến các khía cạnh khác, có thể nâng cao sự ổn định và lợi nhuận của chiến lược.
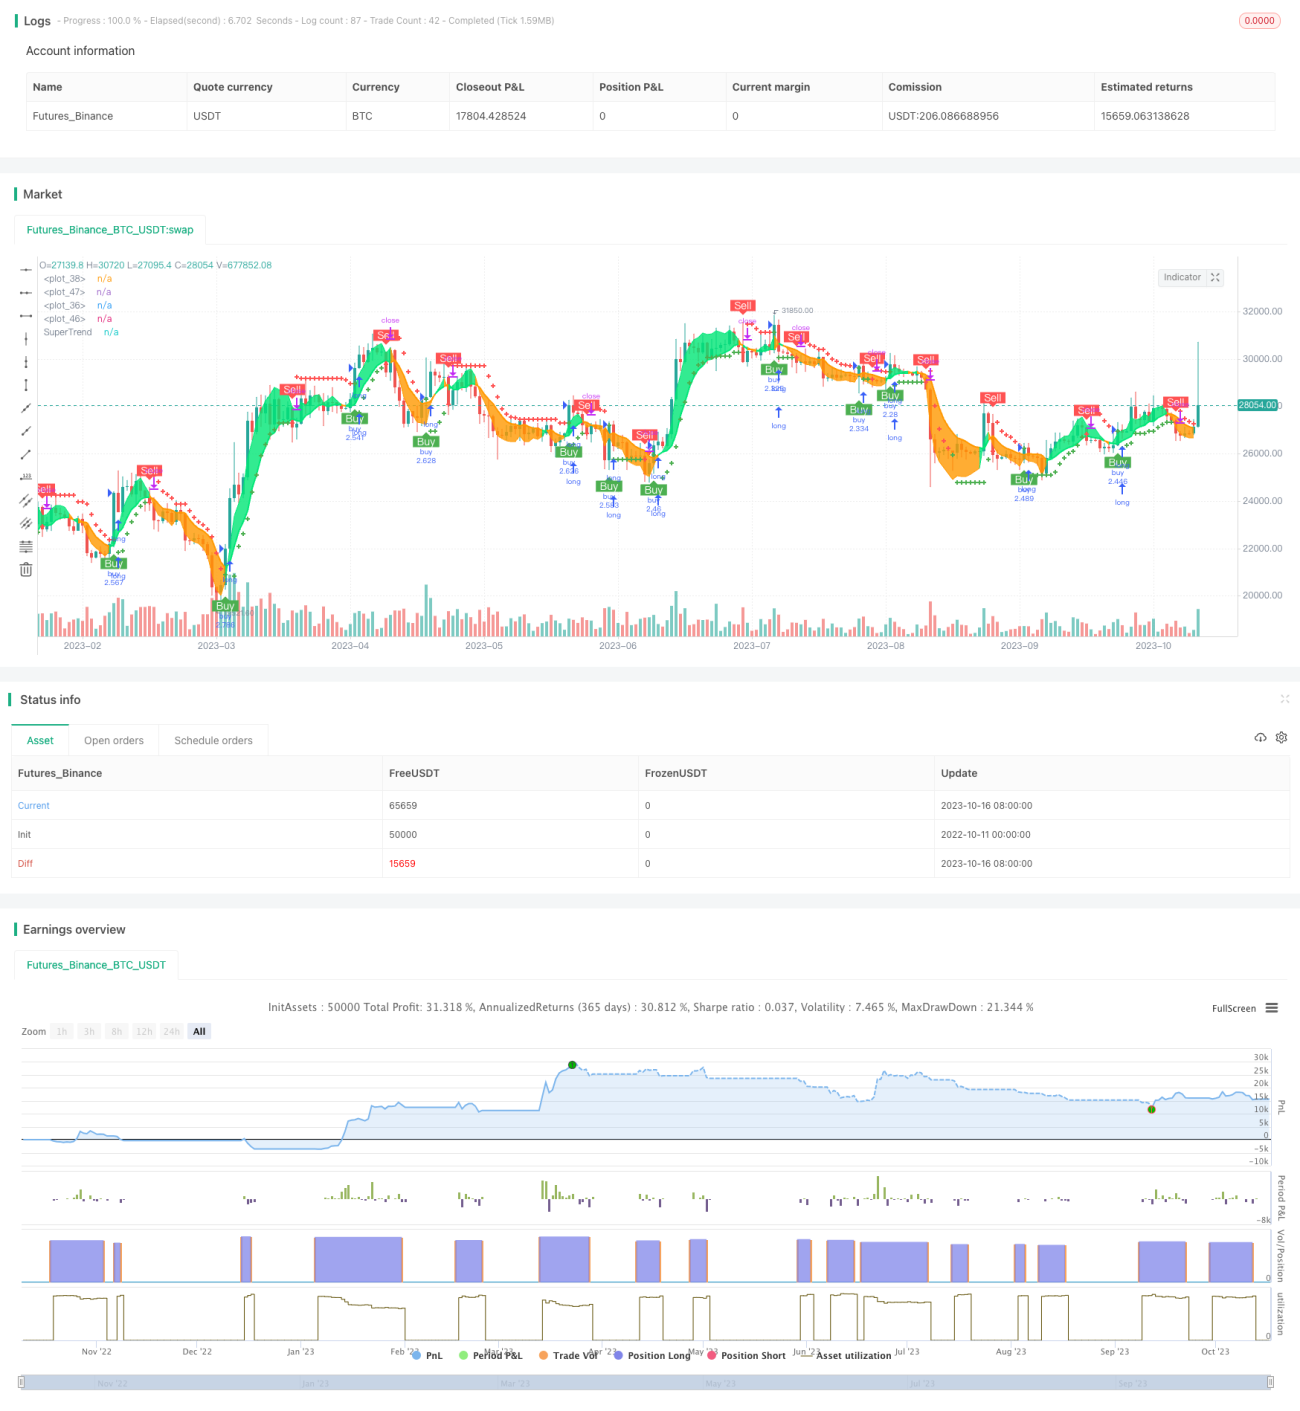
/*backtest
start: 2022-10-11 00:00:00
end: 2023-10-17 00:00:00
period: 1d
basePeriod: 1h
exchanges: [{"eid":"Futures_Binance","currency":"BTC_USDT"}]
*/

// © theCrypster 2020

//@version=4
strategy(title = "Super trend V Strategy version", overlay = true, pyramiding=1,initial_capital = 1000, default_qty_type= strategy.percent_of_equity, default_qty_value = 100, calc_on_order_fills=false, slippage=0,commission_type=strategy.commission.percent,commission_value=0.075)- 1