Chiến lược cắt đường trung bình động


Ngày tạo: 2023-10-24 12:27:20 sửa đổi lần cuối: 2023-10-24 12:27:20
sao chép: 1 Số nhấp chuột: 736
1
tập trung vào
1617
Người theo dõi

Chiến lược cắt đường trung bình động

Tổng quan

Chiến lược này sử dụng nhiều chỉ số kỹ thuật như đường trung bình di chuyển, chỉ số dao động, kết hợp với hình dạng đường trung bình, xác định xu hướng giá cổ phiếu và điểm biến động giảm giá để thực hiện giao dịch mua và bán.

Nguyên tắc

Chiến lược này bao gồm:

  1. Chọn khoảng thời gian: thiết lập khoảng thời gian của biểu đồ K bằng số phút, chẳng hạn như 1 phút, 5 phút, v.v.

  2. Chọn đường trung bình di chuyển: cấu hình các tham số của đường trung bình di chuyển như EMA, SMA, đường 10 ngày, đường 20 ngày, v.v.

  3. Chọn chỉ số chấn động: cấu hình các tham số cho các chỉ số chấn động như RSI, MACD, William.

  4. Tính toán tín hiệu mua bán: Sử dụng các hàm tùy chỉnh, tính toán các giá trị của đường trung bình di chuyển và chỉ số dao động. Một tín hiệu mua được tạo ra khi đường trung bình ngắn hạn vượt qua đường trung bình dài hạn; Một tín hiệu bán được tạo ra khi đường trung bình ngắn hạn vượt qua đường trung bình dài hạn.

  5. Hệ thống xếp hạng: Điểm số hóa các tín hiệu mua và bán của các chỉ số, sau đó lấy trung bình, để có được chỉ số xếp hạng tổng thể. Chỉ số xếp hạng lớn hơn 0 cho tín hiệu mua và nhỏ hơn 0 cho tín hiệu bán.

  6. Tín hiệu giao dịch: tạo tín hiệu giao dịch cuối cùng, mua hoặc bán tùy theo chỉ số xếp hạng lớn hơn hoặc nhỏ hơn 0.

Chiến lược này sử dụng nhiều chỉ số để kết hợp, có thể xác định hiệu quả xu hướng giá và điểm biến, tăng cường độ tin cậy của tín hiệu. Hình thức vượt qua đường thẳng là một tín hiệu kỹ thuật xu hướng hiệu quả, kết hợp với chỉ số dao động giúp tránh phá vỡ giả. Hệ thống xếp hạng cũng làm cho tín hiệu giao dịch rõ ràng hơn.

Ưu điểm

  • Kết hợp đường đồng nhất và nhiều chỉ số biến động, tín hiệu giao dịch đáng tin cậy hơn, tránh tín hiệu giả
  • Hệ thống xếp hạng làm cho tín hiệu mua và bán rõ ràng hơn
  • Sử dụng hàm tùy chỉnh để lập trình mô-đun, cấu trúc mã rõ ràng
  • Sử dụng nhiều chu kỳ thời gian để phân tích kết hợp để tăng độ chính xác
  • Tối ưu hóa các thiết lập tham số, chẳng hạn như độ dài RSI, chu kỳ trung bình MACD
  • Tăng tính linh hoạt thông qua các tham số có thể tùy chỉnh cấu hình chỉ số và tham số đường trung bình

Rủi ro

  • Các cổ phiếu khác nhau trong xu hướng thị trường lớn
  • Tần suất giao dịch có thể cao hơn, tăng chi phí giao dịch và rủi ro trượt
  • Cần thử nghiệm nhiều lần các tham số tối ưu hóa để thích ứng với các tính năng khác nhau của cổ phiếu
  • Có một số rủi ro rút tiền và mất mát

Những rủi ro này có thể được giảm bớt bằng cách:

  • Lựa chọn cổ phiếu theo xu hướng thị trường lớn
  • Điều chỉnh thời gian nắm giữ để giảm tần suất giao dịch
  • Cài đặt tham số tối ưu hóa để phù hợp hơn với đặc điểm cá nhân của cổ phiếu
  • Sử dụng chiến lược dừng lỗ để kiểm soát tổn thất

Hướng tối ưu hóa

Chiến lược này có thể được tối ưu hóa hơn nữa ở những khía cạnh sau:

  1. Thêm nhiều chỉ số, chẳng hạn như chỉ số tỷ lệ dao động, tín hiệu tăng cường
  2. Các tham số tự động tối ưu hóa kết hợp với phương pháp học máy
  3. Thêm mô-đun lựa chọn cổ phiếu và ngành
  4. Kết hợp phương pháp chọn cổ phiếu định lượng
  5. Sử dụng các phương pháp như tự điều chỉnh, theo dõi.
  6. Cân nhắc về thị trường lớn, tránh những điều không chắc chắn
  7. Phân tích kết quả giao dịch trên thị trường chứng khoán, điều chỉnh trọng số xếp hạng

Tóm lại, chiến lược này tích hợp phá vỡ đường trung bình và nhiều chỉ số, có thể xác định hiệu quả động thái giá. Tuy nhiên, cần phải liên tục kiểm tra tối ưu hóa, kiểm soát rủi ro. Trong tương lai, có thể cải thiện về mặt lựa chọn danh mục, tối ưu hóa tham số và dừng lỗ.

Tóm tắt

Chiến lược này sử dụng đường trung bình là tín hiệu giao dịch chính, được xác nhận bằng nhiều chỉ số xung đột, sử dụng hệ thống điểm số để tạo ra tín hiệu mua và bán rõ ràng. Nó có thể xác định hiệu quả xu hướng giá và điểm biến đổi, nhưng cần kiểm soát tần suất giao dịch, giảm chi phí và rủi ro giao dịch, đồng thời cần tối ưu hóa các tham số liên tục.
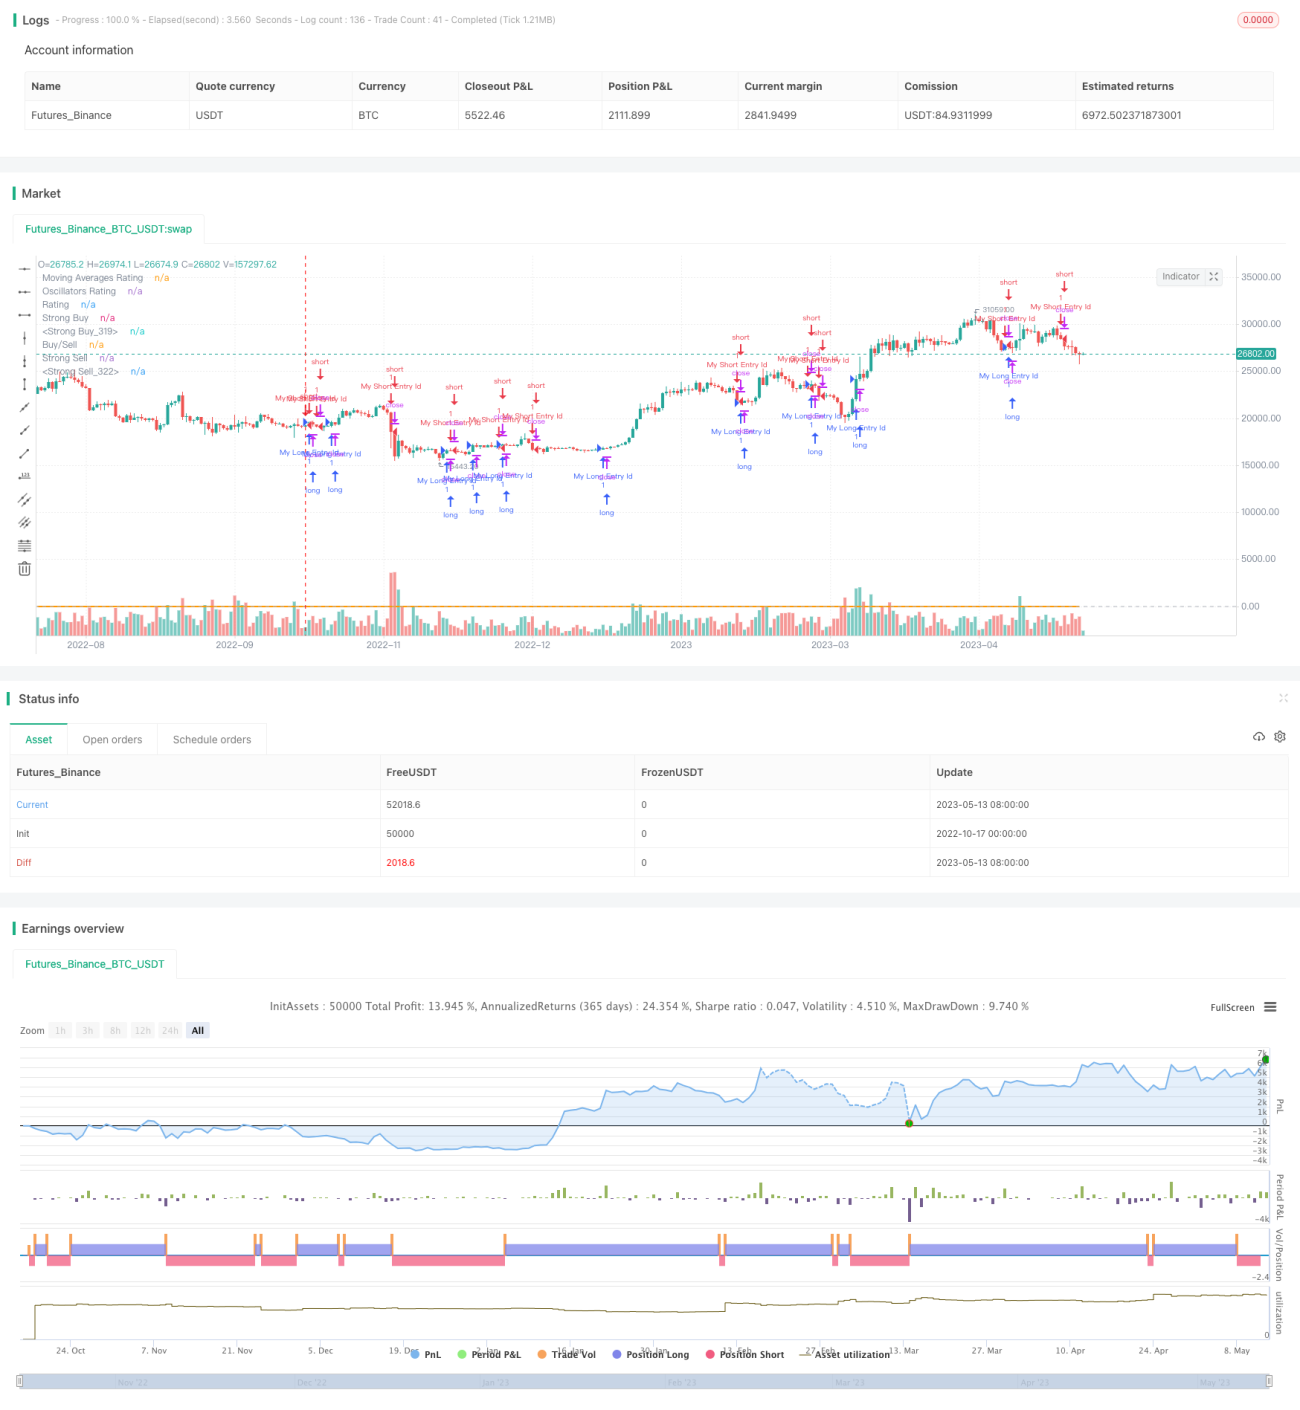
Mã nguồn chiến lược
/*backtest
start: 2022-10-17 00:00:00
end: 2023-05-14 00:00:00
period: 1d
basePeriod: 1h
exchanges: [{"eid":"Futures_Binance","currency":"BTC_USDT"}]
*/

//@version=4
strategy("TV Signal", overlay=true, initial_capital = 500, currency = "USD")

// -------------------------------------- GLOBAL SELECTION --------------------------------------------- //
//res  = input(defval="5"  , title="resolution " , type=resolution)
res_num  = input("240", title="Resolution (minutes)", options=["1", "5", "15", "60", "240"] )
res = res_num
src  = close

// -----------------------------------MOVING AVERAGES SELECTION----------------------------------------- //
// EMAS input
ema10                 = 10
ema20                 = 20
ema30                 = 30
ema50                 = 50
ema100                = 100
ema200                = 200
// SMAS input
sma10                 = 10
sma20                 = 20
sma30                 = 30
sma50                 = 50
sma100                = 100
sma200                = 200
// Ichimoku - is not active in the calculation brought to you by TV TEAM for the lolz
// VWMA
vwma20                = 20
// Hull
hma9                  = 9

// -----------------------------------OSCILLATORS SELECTION----------------------------------------- //
//RSI
rsi_len         = input(14, minval=1, title="RSI Length")
//STOCH K
stoch_k         = input(14, minval=1, title="STOCH K")
stoch_d         = input(3,  minval=1, title="STOCH D")
stoch_smooth    = input(3,  minval=1, title="STOCH Smooth")
//CCI
cci_len         = input(20, minval=1, title="CCI Length")
//Momentum
momentum_len = input(10, minval=1, title="Momentum Length")
//MACD
macd_fast           = input(12,  title="MACD fast")
macd_slow           = input(27,  title="MACD slow")
//ADX
adxlen = input(14, title="ADX Smoothing")
dilen  = input(14, title="DI Length")
//BBP
bbp_len           = input(13,  title="BBP EMA Length")
//William Percentage Range
wpr_length = input(14, minval=1,  title="William Perc Range Length")
//Ultimate Oscillator
uo_length7 = input(7, minval=1, title="UO Length 7"), uo_length14 = input(14, minval=1, title="UO Length 14"), uo_length28 = input(28, minval=1, title="UO Length 28")
	
// -------------------------------------- FUNCTIONS - Moving Averages -------------------------------------- //
// Simple Moving Averages Calculation Function - SELL indicator values < price // BUY – indicator values > price
calc_sma_index(len, src, res) =>	
    sma_val = request.security(syminfo.tickerid, res, sma(src, len))
    sma_index  = if( sma_val > close )
        -1
    else
        1
    sma_index
// Exponential Moving Averages Calculation Function - SELL indicator values < price // BUY – indicator values > price 
calc_ema_index(len, src, res) =>	
    ema_val = request.security(syminfo.tickerid, res, sma(src, len))
    ema_index  = if( ema_val > close )
        -1
    else
        1
    ema_index
// Hull Moving Averages Calculation Function - SELL indicator values < price // BUY – indicator values > price   
calc_hull_index(len, src, res) =>
    hull_val = request.security(syminfo.tickerid, res, wma(2*wma(src, len/2)-wma(src, len), round(sqrt(len))))
    hull_index  = if( hull_val > close )
        -1
    else
        1
    hull_index
// VW Moving Averages Calculation Function - SELL indicator values < price // BUY – indicator values > price  
calc_vwma_index(len, src, res) =>  
    vwma_val = request.security(syminfo.tickerid, res, vwma(src, len))
    vwma_index  = if( vwma_val > close )
        -1
    else
        1
    vwma_index
// -------------------------------------- FUNCTIONS - Oscillators -------------------------------------- //
// RSI indicator < lines that represent oversold conditions(70) and indicator values are rising    = -1
// RSI indicator > lines that represent overbought conditions(30) and indicator values are falling = +1
calc_rsi_index(len, src, res) => 
    up         = rma(max(change(src), 0), len)
    down       = rma(-min(change(src), 0), len)
    rsi        = down == 0 ? 100 : up == 0 ? 0 : 100 - (100 / (1 + up / down))
    rsi_res    = request.security(syminfo.tickerid, res, rsi)
    rsi_change = rsi_res - rsi_res[1]
    rsi_index  = 0
    if( rsi_res > 70 and rsi_change < 0 )
        rsi_index := -1
    if( rsi_res < 30 and rsi_change > 0  )
        rsi_index := 1 
    rsi_index
    
// STOCH indicator – main line < lower band (20) and main line crosses the signal line from bottom-up
// STOCH indicato  – main line > upper band (80) and main line crosses the signal line from above-down
calc_stoch_index(len_k, len_d, smoothK, res) => 
    stoch_k     = sma(stoch(close, high, low, len_k), smoothK)
    stoch_d     = sma(stoch_k, len_d)
    res_stoch_k = request.security(syminfo.tickerid, res, stoch_k)
    res_stoch_d = request.security(syminfo.tickerid, res, stoch_d)
    spread      = (res_stoch_k/res_stoch_d -1)*100
    stoch_index = 0
    if( res_stoch_k > 80 and spread < 0 )
        stoch_index := -1
    if( res_stoch_k < 20 and spread > 0  )
        stoch_index := 1
    stoch_index
    
// CCI indicator – indicator < oversold level (-100) and reversed upwards
// CCI indicator – indicator > overbought level (100) and reversed downwards
calc_cci_index(len, src, res) => 
    cci_ma     = sma(src, len)
    cci        = (src - cci_ma) / (0.015 * dev(src, len))
    cci_res    = request.security(syminfo.tickerid, res, cci)
    cci_change = cci_res - cci_res[1]
    cci_index  = 0
    if( cci_res > 100 and cci_change > 0 )
        cci_index := -1
    if( cci_res < -100 and cci_change < 0  )
        cci_index := 1
    cci_index  

//AWESOME OSCILLATOR – saucer and values are greater than 0 or zero line cross from bottom-up - BUY
//AWESOME OSCILLATOR – saucer and values are lower than 0 or zero line cross from above-down  - SELL    
calc_awesome_index(src, res) =>
    ao        = sma(hl2,5) - sma(hl2,34)
    ao_res    = request.security(syminfo.tickerid, res, ao)
    ao_change = ao_res - ao_res[1]
    ao_index  = 0
    if( ao_res > 0 and ao_change > 0 )
        ao_index := 1
    if( ao_res < 0 and ao_change < 0 )
        ao_index := -1
    ao_index 

// Momentum indicator - indicator values are rising  - BUY
// Momentum indicator - indicator values are falling - SELL
calc_momentum_index(len, src, res) => 
    mom       = src - src[len]
    res_mom   = request.security(syminfo.tickerid, res, mom)
    mom_index = 0
    if res_mom>= 0
        mom_index := 1
    if res_mom <= 0
        mom_index := -1
    mom_index 

// MACD - main line values > signal line values  - BUY
// MACD - main line values < signal line values - SELL
calc_macd_index(macd_fast, macd_slow, src, res) => 
    macd       = ema(src, macd_fast) - ema(src, macd_slow)
    res_macd   = request.security(syminfo.tickerid, res, macd)
    macd_index = 0
    if res_macd>= 0
        macd_index := 1
    if res_macd <= 0
        macd_index := -1
    macd_index  

//STOCHRSI - main line < lower band (20) and main line crosses the signal line from bottom-up
//STOCHRSI - main line > upper band (80) and main line crosses the signal line from above-down
calc_stochrsi_index(len_rsi, len_stoch, smoothK, smoothD, src, res) =>
    rsi     = rsi(src, len_rsi)
    stoch_k = sma(stoch(rsi, rsi, rsi, len_stoch), smoothK)
    stoch_d = sma(stoch_k, smoothD)
    res_stoch_k = request.security(syminfo.tickerid, res, stoch_k)
    res_stoch_d = request.security(syminfo.tickerid, res, stoch_d)
    spread  = (res_stoch_k/res_stoch_d -1)*100
    stochrsi_index = 0
    if( res_stoch_k > 80 and spread < 0 )
        stochrsi_index := -1
    if( res_stoch_k < 20 and spread > 0  )
        stochrsi_index := 1
    stochrsi_index 

//Williams % Range  - line is above -20 and values are dropping - Overbough conditions - SELL 
//Williams % Range  - line is below -80 and values are rising   - Oversold conditions  - BUY
calc_wpr_index(len, src, res) => 
    wpr_upper = highest(len)
    wpr_lower = lowest(len)
    wpr = 100 * (src - wpr_upper) / (wpr_upper - wpr_lower)
    wpr_res = request.security(syminfo.tickerid, res, wpr)
    wpr_change = wpr_res - wpr_res[1]
    wpr_index = 0
    if( wpr_res < -80 and wpr_change > 0 )
        wpr_index := 1
    if( wpr_res > -20 and wpr_change < 0 )
        wpr_index := -1
    wpr_index

//Ultimate Oscillator - line is above -20 and values are dropping - Overbough conditions - SELL 
//Ultimate Oscillator - line is below -80 and values are rising   - Oversold conditions  - BUY
average(bp, tr_, length) => sum(bp, length) / sum(tr_, length)

calc_uo_index(len7, len14, len28, res) => 
    high_ = max(high, close[1])
    low_ = min(low, close[1])
    bp = close - low_
    tr_ = high_ - low_
    avg7 = average(bp, tr_, len7)
    avg14 = average(bp, tr_, len14)
    avg28 = average(bp, tr_, len28)
    uo = 100 * (4*avg7 + 2*avg14 + avg28)/7
    uo_res = request.security(syminfo.tickerid, res, uo)
    uo_index = 0
    if uo_res >= 70
        uo_index := 1
    if uo_res <= 30
        uo_index := -1
    uo_index   

//Average Directional Index - indicator > 20 and +DI line crossed -DI line from bottom-up
//Average Directional Index - indicator > 20 and +DI line crossed -DI line from above-down
dirmov(len) =>
	up = change(high)
	down = -change(low)
	truerange = rma(tr, len)
	plus = fixnan(100 * rma(up > down and up > 0 ? up : 0, len) / truerange)
	minus = fixnan(100 * rma(down > up and down > 0 ? down : 0, len) / truerange)
	[plus, minus]

adx(dilen, adxlen) => 
	[plus, minus] = dirmov(dilen)
	sum = plus + minus
	adx = 100 * rma(abs(plus - minus) / (sum == 0 ? 1 : sum), adxlen)

adxHigh(dilen, adxlen) => 
	[plus, minus] = dirmov(dilen)
	plus
	
adxLow(dilen, adxlen) => 
	[plus, minus] = dirmov(dilen)
	minus

calc_adx_index(res) => 
    sig         = adx(dilen, adxlen) //ADX
    sigHigh     = adxHigh(dilen, adxlen) // DI+
    sigLow      = adxLow(dilen, adxlen) // DI-
    res_sig     = request.security(syminfo.tickerid, res, sig)
    res_sigHigh = request.security(syminfo.tickerid, res, sigHigh)
    res_sigLow  = request.security(syminfo.tickerid, res, sigLow)    
    spread      = (res_sigHigh/res_sigLow  -1)*100
    adx_index   = 0
    if res_sig >= 20 and spread > 0
        adx_index := 1
    if res_sig >= 20 and spread < 0
        adx_index := -1
    adx_index

//Bull Bear Power Index - bear power is below 0 and is weakening -> BUY
//Bull Bear Power Index - bull power is above 0 and is weakening -> SELL
calc_bbp_index(len, src, res ) =>
    ema   = ema(src, len)
    bulls = high - ema
    bears = low  - ema
    bulls_res = request.security(syminfo.tickerid, res, bulls)
    bears_res = request.security(syminfo.tickerid, res, bears)
    sum = bulls_res + bears_res
    bbp_index = 0
    if bears_res < 0 and bears_res > bears_res[1]
        bbp_index := 1
    if bulls_res > 0 and bulls_res < bulls_res[1]
        bbp_index := -1
    bbp_index

// --------------------------------MOVING AVERAGES CALCULATION------------------------------------- //
sma10_index  = calc_sma_index(sma10,  src, res)
sma20_index  = calc_sma_index(sma20,  src, res)
sma30_index  = calc_sma_index(sma30,  src, res)
sma50_index  = calc_sma_index(sma50,  src, res)
sma100_index = calc_sma_index(sma100, src, res)
sma200_index = calc_sma_index(sma200, src, res)
ema10_index  = calc_ema_index(ema10,  src, res)
ema20_index  = calc_ema_index(ema20,  src, res)
ema30_index  = calc_ema_index(ema30,  src, res)
ema50_index  = calc_ema_index(ema50,  src, res)
ema100_index = calc_ema_index(ema100, src, res)
ema200_index = calc_ema_index(ema200, src, res)
hull9_index  = calc_ema_index(hma9,   src, res)
vwma20_index = calc_ema_index(vwma20, src, res)

ichimoku_index = 0.0 //Ichimoku - is not active in the calculation brought to you by TV TEAM for the lolz
moving_averages_index = ( ema10_index + ema20_index + ema30_index + ema50_index + ema100_index + ema200_index +
						  sma10_index + sma20_index + sma30_index + sma50_index + sma100_index + sma200_index +
                          ichimoku_index + vwma20_index + hull9_index ) / 15

// -----------------------------------OSCILLATORS CALCULATION----------------------------------------- //
rsi_index       = calc_rsi_index(rsi_len, src, res)
stoch_index     = calc_stoch_index(stoch_k, stoch_d, stoch_smooth, res)
cci_index       = calc_cci_index(cci_len, src, res)
ao_index        = calc_awesome_index(src, res)
mom_index       = calc_momentum_index(momentum_len, src, res)
macd_index      = calc_macd_index(macd_fast, macd_slow, src, res)
stochrsi_index  = calc_stochrsi_index(rsi_len, stoch_k, stoch_d, stoch_smooth, src, res)
wpr_index       = calc_wpr_index(wpr_length, src, res)
uo_index        = calc_uo_index(uo_length7, uo_length14, uo_length28, res)
adx_index       = calc_adx_index(res)
bbp_index       = calc_bbp_index(bbp_len , src, res)

oscillators_index = ( rsi_index + stoch_index + adx_index + cci_index + stochrsi_index + ao_index + mom_index + macd_index + wpr_index + uo_index + bbp_index )	/ 11   

rating_index = ( moving_averages_index + oscillators_index ) / 2

plot(moving_averages_index, color=green, linewidth = 1, title="Moving Averages Rating",transp = 70)
plot(oscillators_index    , color=blue,  linewidth = 1, title="Oscillators Rating",transp = 70)
plot(rating_index         , color=orange,   linewidth = 2, title="Rating")

strongbuy       = hline(1,   "Strong Buy" , color=silver ) 
buy             = hline(0.5, "Strong Buy" , color=green  )
normal          = hline(0,   "Buy/Sell"   , color=silver )
sell            = hline(-0.5,"Strong Sell", color=red    )
strongsell      = hline(-1,  "Strong Sell", color=silver )

fill(strongbuy,buy,   color=green,   transp=90)
fill(buy,normal,      color=#b2ffb2, transp=90)
fill(sell,normal,     color=#F08080, transp=90)
fill(strongsell,sell, color=red,     transp=90)

longCondition = rating_index > 0
if (longCondition)
    strategy.entry("My Long Entry Id", strategy.long)

shortCondition = rating_index < 0
if (shortCondition)
    strategy.entry("My Short Entry Id", strategy.short)